Automated Dispensing Machines Market Size and Share
Market Overview
| Study Period | 2019 - 2030 |
|---|---|
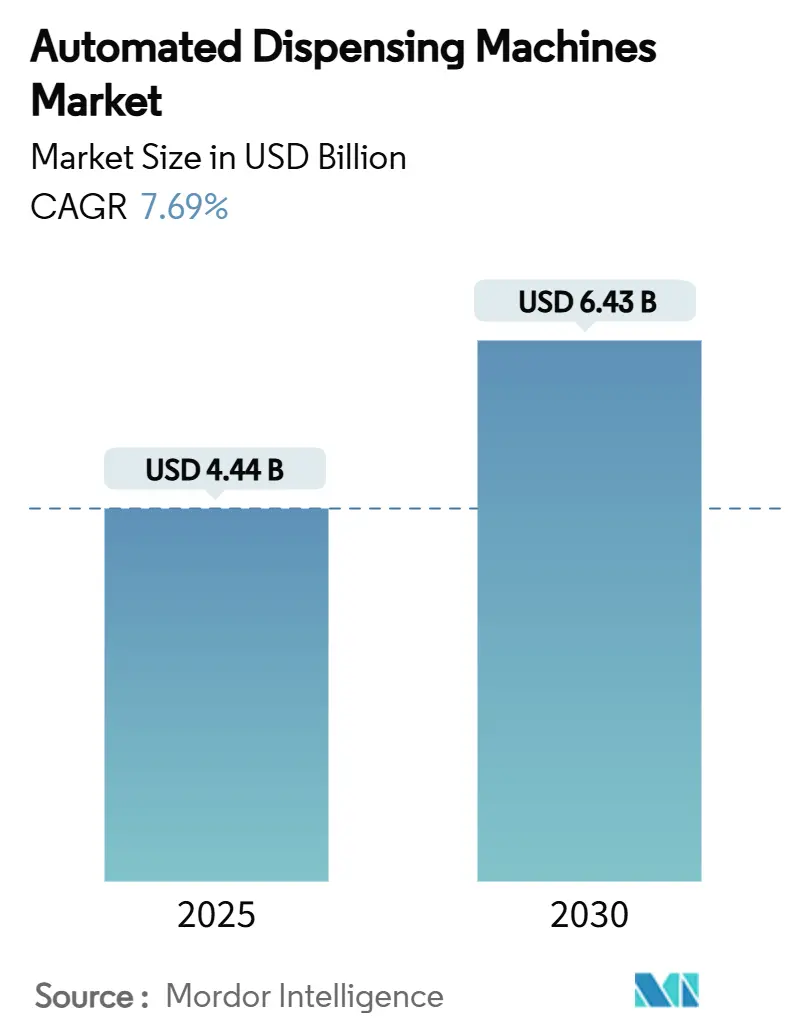
| Market Size (2025) | USD 4.44 Billion |
| Market Size (2030) | USD 6.43 Billion |
| Growth Rate (2025 - 2030) | 7.69% CAGR |
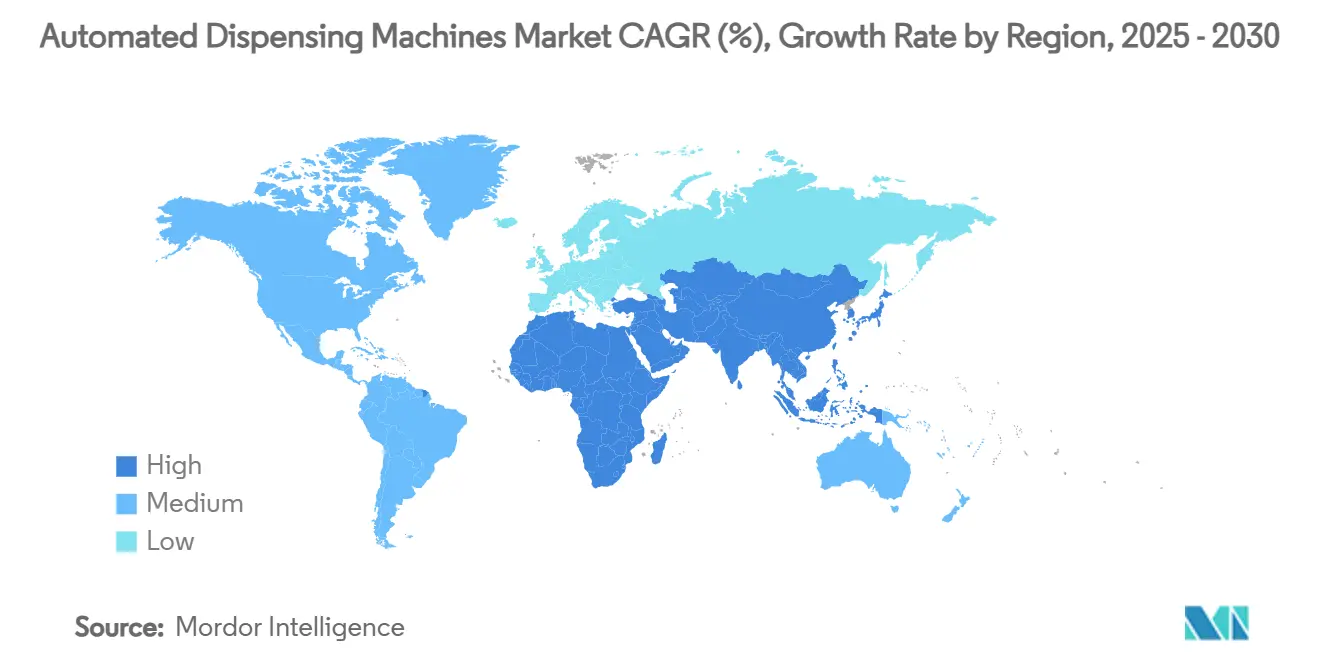
| Fastest Growing Market | Asia Pacific |
| Largest Market | North America |
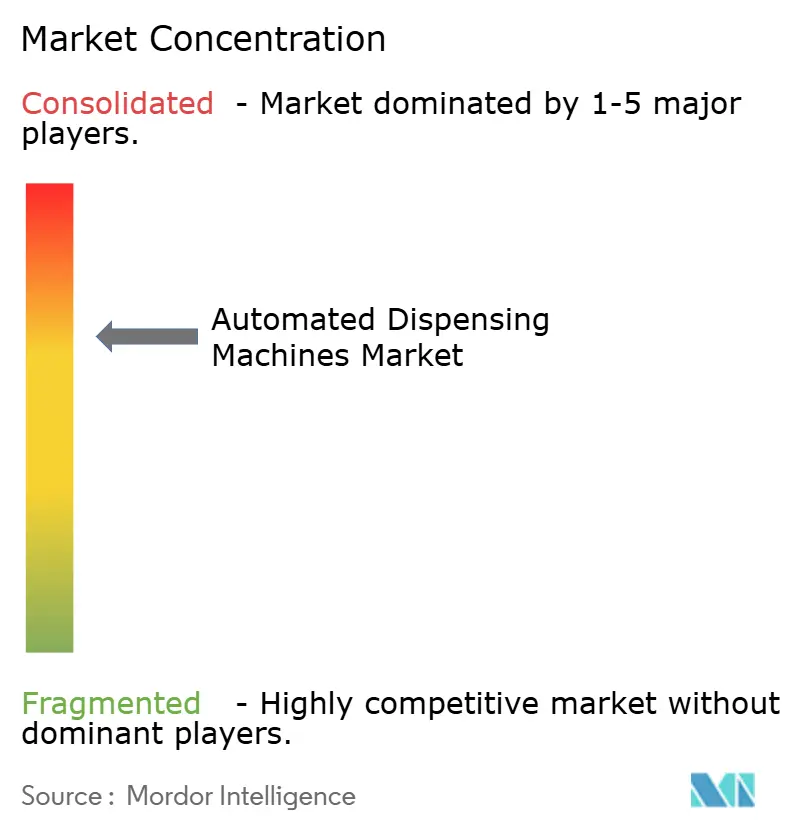
| Market Concentration | Medium |
Major Players *Disclaimer: Major Players sorted in no particular order Image © Mordor Intelligence. Reuse requires attribution under CC BY 4.0. | |
Automated Dispensing Machines Market Analysis by Mordor Intelligence
The automated dispensing machine market size is valued at USD 4.44 billion in 2025 and is forecast to reach USD 6.43 billion by 2030, reflecting a 7.69% CAGR over the period. Rising digitalization in hospital and retail pharmacy operations, along with stricter medication-safety mandates, is lifting demand for connected point-of-care systems that track every dose in real time. DEA rules that require electronic prescribing for controlled substances have accelerated U.S. adoption, while FDA Class II classification for remote medication management systems has clarified the regulatory pathway for vendors. At the same time, APAC governments are investing heavily in modern pharmacy infrastructure, placing the region on a faster adoption curve than North America and Europe. Consolidation trends among health systems are shifting purchasing criteria toward enterprise-level automation suites that combine hardware, software, analytics, and cybersecurity in one integrated platform.
Key Report Takeaways
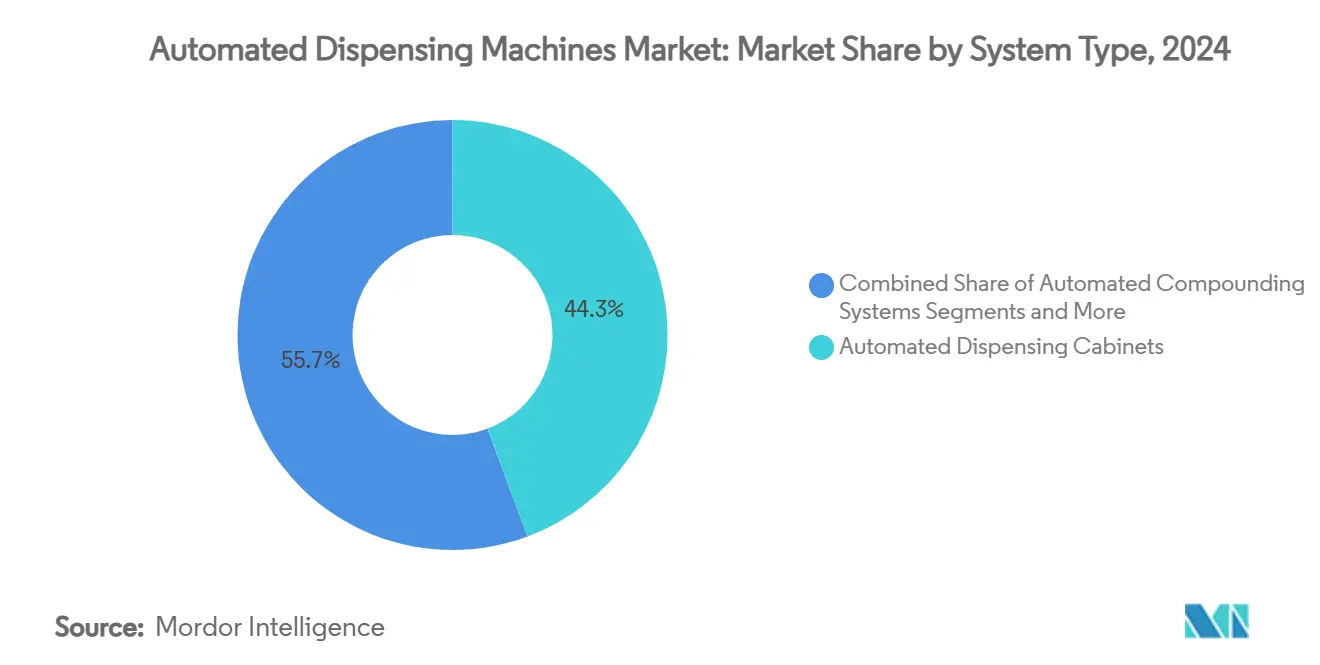
- By system type, automated dispensing cabinets held 44.32% of automated dispensing machine market share in 2024, while decentralized ADCs are expanding at a 10.89% CAGR through 2030.
- By deployment model, centralized installations accounted for 61.47% of automated dispensing machine market size in 2024; decentralized systems are advancing at an 11.04% CAGR to 2030.
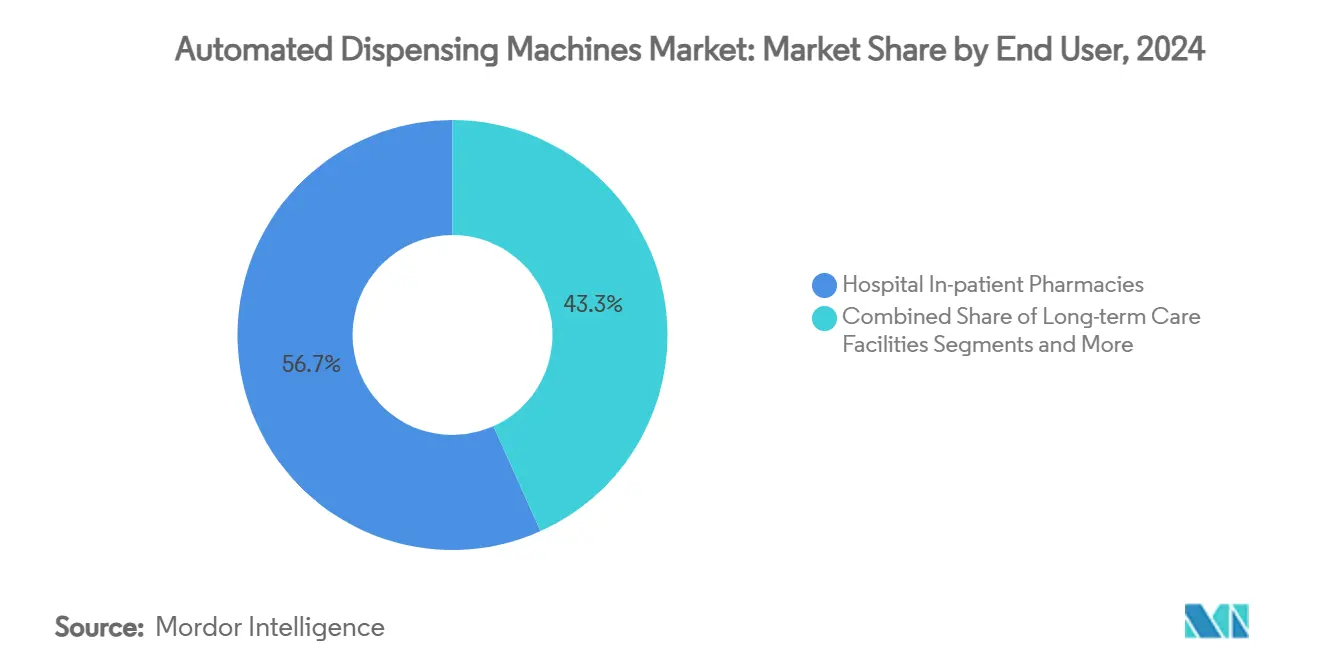
- By end user, hospital in-patient pharmacies captured 56.72% revenue share in 2024; retail and community pharmacies are forecast to expand at a 10.54% CAGR through 2030.
- By medication class, unit-dose oral solids dominated with 48.52% share of automated dispensing machine market size in 2024 and controlled substances are growing at a 9.34% CAGR to 2030.
- Regionally, North America led with 39.81% revenue share in 2024, while Asia-Pacific is poised to record a 9.35% CAGR through 2030.
Global Automated Dispensing Machines Market Trends and Insights
Drivers Impact Analysis*
| Driver | (~) % Impact on CAGR Forecast | Geographic Relevance | Impact Timeline |
|---|---|---|---|
| Rising need to reduce medication errors | +1.8% | Global, highest in North America and Europe | Medium term (2-4 years) |
| Increasing decentralization toward POC | +1.5% | North America and APAC core, spill-over to Europe | Short term (≤2 years) |
| Growing geriatric population | +1.2% | Global, early gains in North America, Europe, Japan | Long term (≥4 years) |
| Predictive-analytics inventory optimization | +1.0% | North America and Europe, expanding to APAC | Medium term (2-4 years) |
| Expansion of outpatient infusion pharmacies | +0.9% | North America and Europe, selective APAC markets | Medium term (2-4 years) |
| ESG-led sustainability mandates | +0.7% | Europe and North America, emerging in APAC | Long term (≥4 years) |
| Source: Mordor Intelligence | |||
Rising need to reduce medication errors & improve patient safety
Medication errors remain a top patient-safety concern, with 68% occurring during administration. Healthcare providers are turning to automated dispensing cabinets that verify dose, drug, and patient in one workflow. Studies in long-term care show a 71% cut in retrieval time and a 96% drop in unscheduled deliveries, saving USD 8,900 per site each year. The FDA’s Class II designation for remote medication management devices in 2024 created uniform labeling, testing, and recall rules, which in turn drives compliance-driven purchasing. Closed-loop systems that combine barcode medication administration with dispensing cabinets virtually remove transcription errors and wrong-patient events.
Increasing decentralization toward point-of-care automation
Care delivery is shifting beyond the central pharmacy into ambulatory surgery centers, clinics, and even retail outlets. Omnicell’s XT Amplify platform posted double-digit sales growth in Q1 2025 as health systems looked to extend medication control to the bedside. CVS Health’s remote prescription-filling robots now serve 9,000 stores, freeing pharmacists for clinical tasks while keeping accuracy high. Workforce shortages amplify the appeal, letting one clinical pharmacist oversee multiple satellite sites without compromising safety. New DEA telemedicine rules covering controlled substances add tailwinds because every remote prescription must be linked to a secure automated vault.
Growing geriatric population driving prescription volumes
Nearly every resident in a senior facility takes multiple daily medications, with average regimens hitting five or more drugs. Japan’s Tomod’s chain shows how full automation covers 90% of pharmacist tasks, releasing staff time for counseling. As populations age, hospital readmissions linked to medication mismanagement rise, pressing administrators to adopt machine-verified dispensing workflows. Predictive analytics embedded in newer platforms anticipate refill spikes tied to chronic conditions, ensuring no stock-outs for life-sustaining therapies.
Predictive-analytics inventory optimization initiatives
Artificial-intelligence engines now forecast usage by hour and automate re-ordering to cut waste. Case studies in U.S. health networks note 13% lower fill costs when micro-fulfillment robots steer inventory across 5,000 stores. Hospitals in Europe integrate machine learning with automated dispensing to balance safety stock against just-in-time delivery, shrinking expired-drug write-offs. Controlled substance vaults also benefit; algorithms match DEA quota changes with historic demand so compliance and availability can coexist.
Restraints Impact Analysis*
| Restraint | (~) % Impact on CAGR Forecast | Geographic Relevance | Impact Timeline |
|---|---|---|---|
| High capital and lifecycle costs | -1.4% | Global, highest in emerging markets | Short term (≤2 years) |
| Workflow-disruption reluctance | -1.1% | North America and Europe, selective APAC | Medium term (2-4 years) |
| Cyber-security and ransomware threats | -0.8% | Global, highest concern in North America and Europe | Short term (≤2 years) |
| Regulatory delays for vault algorithms | -0.6% | North America and Europe, emerging in APAC | Medium term (2-4 years) |
| Source: Mordor Intelligence | |||
High capital & lifecycle costs of ADM deployment
Automated systems demand sizable upfront budgets and recurring service fees that can run 20–30% of hardware value per year. Smaller hospitals often defer purchases until payback becomes undeniable. Financial models show ROI inside two years when labor savings and inventory turns are counted, yet capital scarcity in emerging markets drags on adoption. Leasing, outcome-based contracts, and modular rollouts are gaining ground as vendors try to lower the entry barrier.
Cyber-security & ransomware threats to medication networks
Connected devices enlarge the attack surface. Hospital ransomware incidents surged again in 2024, prompting manufacturers to embed UL 2900-2-1-certified defenses, as seen in Baxter’s ExactaMix Pro. Providers must weigh the convenience of cloud dashboards against the risk of downtime that could halt medication access. Multi-factor authentication, encrypted audit trails, and zero-trust network designs are becoming standard bid requirements, which raises implementation complexity and cost.
*Our forecasts treat driver/restraint impacts as directional, not additive. The impact forecasts reflect baseline growth, mix effects, and variable interactions.
Segment Analysis
By System Type: ADCs Lead While Robotics Reshape Operations
Automated dispensing cabinets delivered 44.32% of 2024 revenue, confirming their role as the backbone of hospital medication logistics. Robotic central pharmacy systems, however, handle the bulk volume. Walgreens’ micro-fulfillment centers process 16 million scripts monthly, illustrating how high-speed robotics cut per-fill cost and improve accuracy. Decentralized ADC installations are climbing fastest at a 10.89% CAGR because bedside access trims nurse walk time and keeps critical meds available during surges. As a result, the automated dispensing machine market is pivoting from isolated cabinets to networked ecosystems with inventory analytics.
Product innovation is focusing on AI-driven predictive stocking, LED-guided pick-to-light modules, and modular drawers that adapt to varying drug sizes. Automated medication vending kiosks are moving beyond hospitals into university clinics and corporate health centers. Compounding robots now integrate gravimetric checks to confirm dose before release, while storage and retrieval towers use machine vision to spot vial defects. Vendors that marry hardware speed with software intelligence enjoy a pricing premium.


By Deployment Model: Centralized Dominance Faces Decentralized Disruption
Centralized configurations held 61.47% of value in 2024, rooted in legacy investments and the comfort of pharmacist oversight. Management benefits include bulk purchasing discounts and streamlined controlled-substance auditing. Yet decentralized nodes are adding double-digit growth thanks to telehealth expansion, pandemic-era capacity restraints, and home-care models. The automated dispensing machine market size tied to decentralized systems is projected to widen quickly as regulators approve more remote workflows.
Hybrid architectures now link central fills with satellite cabinets. Omnicell’s cloud suite lets pharmacists release doses from a tablet, whether the cabinet sits in an ICU or a standalone surgery center.[1]Omnicell Inc., “Omnicell Announces XT Amplify,” Omnicell, omnicell.com Interoperability with electronic health records has become non-negotiable; health systems demand that every dispense transaction flow into the patient chart without manual reconciliation. Vendors that solve this integration cleanly often win multiyear enterprise contracts.
By End User: Hospitals Maintain Lead as Retail Accelerates
Hospital in-patient pharmacies produced 56.72% of 2024 sales, because acute-care environments cannot tolerate dispensing delays. Sophisticated interfaces flag allergy mismatches in real time and support nurse-verified wasting for narcotics. Retail and community outlets, on the other hand, are expanding quickest. Large chains add compact robots that sort, cap, and label up to 300 prescriptions an hour, a critical lever amid staffing shortages.
Long-term care centers adopt drawer-level control to manage polypharmacy. Studies note a 71% reduction in nurse retrieval time when cabinets replace manual carts. Ambulatory surgery suites rely on RFID-tagged smart cabinets to track high-value anesthetics, minimizing shrinkage. Mail-order hubs lean on conveyor-fed vision systems that photograph every completed pack, providing audit evidence for payors. This end-user diversity fuels demand for configurable platforms rather than rigid, one-size stacks.
By Medication Class: Oral Solids Dominate While Controlled Substances Accelerate
Unit-dose oral solids owned 48.52% of 2024 turnover because tablets and capsules remain the most prescribed forms. Cabinets built around canister cassettes enable high-density storage and quick replenishment. Controlled substances, although a smaller slice today, will post the fastest rise at 9.34% CAGR. DEA rules now require digital chain-of-custody for every dose, making automated vaults with biometric locks indispensable.[2]Drug Enforcement Administration, “Physical Security Controls for Non-Practitioners; Storage Areas,” Federal Register, federalregister.gov
Injectable and IV therapies claim growing share as biologics gain traction. Compounding robots reduce contamination risk by performing gravimetric checks and isolating operators from cytotoxics. AI engines in the latest software modules predict when specialty injectables will spike, prompting earlier restock. Other classes, such as transdermals and inhalables, record modest gains but demand tailored drawer shapes and environmental controls.
Geography Analysis
North America generated the largest slice, 39.81%, in 2024. The region benefits from high EHR adoption, mandatory e-prescribing for narcotics, and a reimbursement system that rewards safety investments. U.S. health systems typically refresh cabinet fleets every seven to nine years, keeping replacement demand steady. Canada follows similar patterns, though provincial funding cycles can delay purchases.
Europe shows consistent uptake, propelled by national medication-error reduction targets. Scandinavian hospitals favor closed-loop setups where bedside scanning ties into automated carts. Germany’s upcoming Krankenhauszukunftsgesetz funding channel earmarks digital health grants, some of which funnel into dispensing automation.
Asia-Pacific is the growth front, with a 9.35% CAGR predicted. Japan leads in per-capita installations, yet China and India supply the unit volume. Investments in smart hospitals, led by public-private partnerships, speed rollouts. Regulatory convergence projects coordinated by ISPE have cut approval times for imported devices, smoothing market entry.[3]Scott Fotheringham, “Navigating the Asia-Pacific Pharmaceutical Landscape,” ISPE.ORG South America and Middle East & Africa begin from a smaller base but show rising tenders tied to new tertiary facilities.

Competitive Landscape
The landscape is moderately fragmented. Omnicell, BD, and Swisslog hold sizable installed bases, but newcomers armed with cloud architectures and AI analytics challenge them. Hospitals now issue RFPs that bundle cabinets, robotics, sterile compounding, and analytics dashboards in one contract, raising the bar for incumbents that once excelled at a single device.
Omnicell doubled down on software by opening its Austin Innovation Lab, recruiting pharmacists to co-design workflow tweaks. BD refreshed Pyxis® with machine-vision drawer validation to cut refill errors. Swisslog Healthcare rolled out PillPick Octave, adding eco-friendly pouching to score ESG points. Smaller firms target niches such as long-term care or controlled-substance tracking, using SaaS pricing to undercut capital-heavy rivals.
Mergers edge the sector toward higher concentration, yet antitrust scrutiny remains. Buyers favor interoperable platforms that sit natively inside Cerner and Epic. Vendors able to certify UL cybersecurity and meet DEA vault standards gain an edge. Overall, the automated dispensing machine market gravitates to full-stack providers poised to manage hardware, software, and 24/7 remote support.
Automated Dispensing Machines Industry Leaders
Takazono Corporation
Capsa Healthcare
Swisslog Healthcare
Omnicell Inc.
Becton, Dickinson and Company
- *Disclaimer: Major Players sorted in no particular order

Recent Industry Developments
- June 2025: Swisslog Healthcare unveiled PillPick Octave, introducing eco-friendly packaging and enhanced patient-specific validation
- May 2025: Omnicell launched RFID-enabled MedTrack for perioperative inventory and MedVision for outpatient clinics, entering new specialty niches
- May 2025: Walgreens opened a Brooklyn Park micro-fulfillment site serving nearly 200 stores and processing 13 million annual prescriptions via robotics.


Global Automated Dispensing Machines Market Report Scope
| Automated Dispensing Cabinets (ADCs) |
| Robotic Central Pharmacy Dispensing Systems |
| Automated Medication Vending / Pill Dispensers |
| Automated Compounding Systems |
| Automated Storage & Retrieval Systems |
| Centralized Systems |
| Decentralized Systems |
| Hospital In-patient Pharmacies |
| Hospital Out-patient Pharmacies |
| Retail & Community Pharmacies |
| Long-term Care Facilities |
| Ambulatory Surgical & Specialty Clinics |
| Mail-order & Central-fill Pharmacies |
| Unit-dose Oral Solids |
| Injectable / IV Medications |
| Controlled Substances & Narcotics |
| Others |
| North America | United States |
| Canada | |
| Mexico | |
| Europe | Germany |
| United Kingdom | |
| France | |
| Italy | |
| Spain | |
| Rest of Europe | |
| Asia-Pacific | China |
| Japan | |
| India | |
| Australia | |
| South Korea | |
| Rest of Asia-Pacific | |
| Middle East and Africa | GCC |
| South Africa | |
| Rest of Middle East and Africa | |
| South America | Brazil |
| Argentina | |
| Rest of South America |
| By System Type | Automated Dispensing Cabinets (ADCs) | |
| Robotic Central Pharmacy Dispensing Systems | ||
| Automated Medication Vending / Pill Dispensers | ||
| Automated Compounding Systems | ||
| Automated Storage & Retrieval Systems | ||
| By Deployment Model | Centralized Systems | |
| Decentralized Systems | ||
| By End User | Hospital In-patient Pharmacies | |
| Hospital Out-patient Pharmacies | ||
| Retail & Community Pharmacies | ||
| Long-term Care Facilities | ||
| Ambulatory Surgical & Specialty Clinics | ||
| Mail-order & Central-fill Pharmacies | ||
| By Medication Class | Unit-dose Oral Solids | |
| Injectable / IV Medications | ||
| Controlled Substances & Narcotics | ||
| Others | ||
| By Geography | North America | United States |
| Canada | ||
| Mexico | ||
| Europe | Germany | |
| United Kingdom | ||
| France | ||
| Italy | ||
| Spain | ||
| Rest of Europe | ||
| Asia-Pacific | China | |
| Japan | ||
| India | ||
| Australia | ||
| South Korea | ||
| Rest of Asia-Pacific | ||
| Middle East and Africa | GCC | |
| South Africa | ||
| Rest of Middle East and Africa | ||
| South America | Brazil | |
| Argentina | ||
| Rest of South America | ||


Key Questions Answered in the Report
1. What is the current value of the automated dispensing machine market?
The automated dispensing machine market size stands at USD 4.44 billion in 2025 and is projected to reach USD 6.43 billion by 2030.
2. Which region leads in adoption of automated dispensing machines?
North America leads, holding 39.81% of 2024 revenue, owing to strict e-prescribing mandates and advanced hospital digitization.
3. Which segment is growing fastest within the market?
Decentralized automated dispensing cabinets record the highest growth at a 10.89% CAGR because health systems are pushing medication access to the bedside.
4. Why are controlled-substance dispensing solutions in demand?
Enhanced DEA compliance rules now require digital chain-of-custody tracking, driving a 9.34% CAGR for controlled-substance focused systems.
5. How do automated dispensing machines improve patient safety?
They cut retrieval time by more than 70%, eliminate manual transcription errors through barcode verification, and provide end-to-end audit trails.
Page last updated on:


