Market Overview
| Study Period | 2020 - 2031 |
|---|---|
| Base Year For Estimation | 2025 |
| Forecast Data Period | 2026 - 2031 |
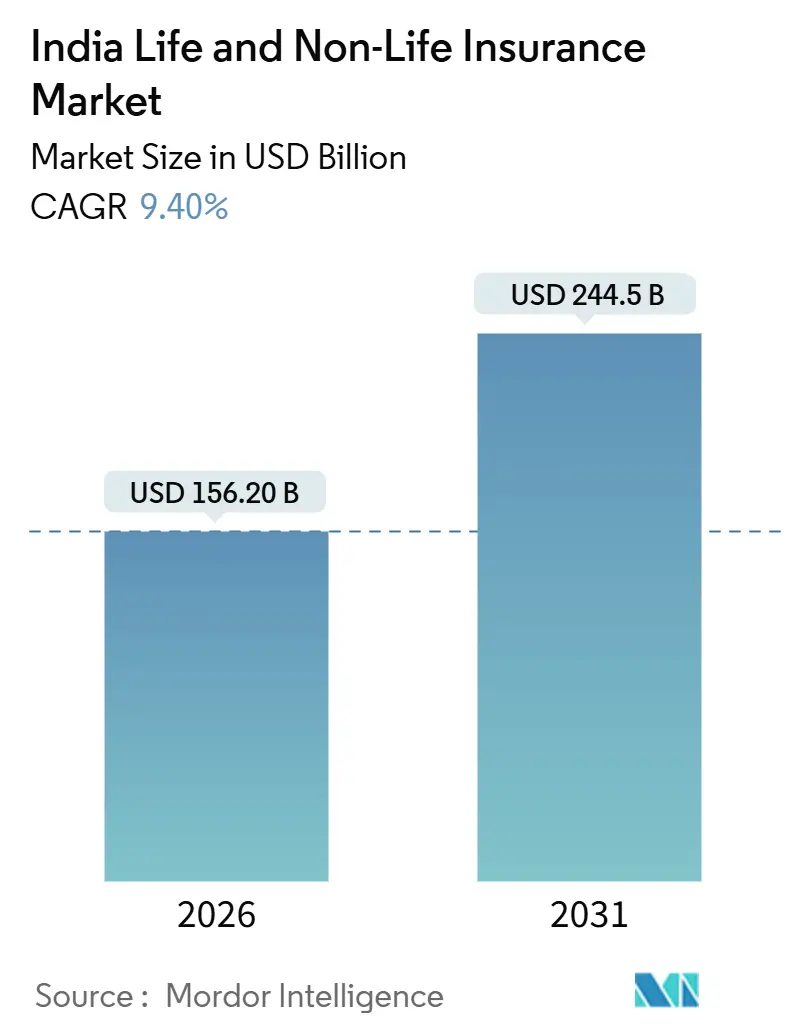
| Market Size (2026) | USD 156.20 Billion |
| Market Size (2031) | USD 244.5 Billion |
| Growth Rate (2026 - 2031) | 9.40% CAGR |
| Market Concentration | Medium |
Major Players *Disclaimer: Major Players sorted in no particular order Image © Mordor Intelligence. Reuse requires attribution under CC BY 4.0. | |
India Life And Non-Life Insurance Market Analysis by Mordor Intelligence
The India life and non-life insurance market size is USD 156.2 billion in 2026 and is projected to reach USD 244.5 billion by 2031, reflecting a 9.4% CAGR during the forecast period.
Life insurance maintains a larger base, while non-life expands faster as health and motor lines benefit from regulatory clarity, cashless claims, and product innovation under a use-and-file regime. Distribution continues to transition to hybrid models that blend agency, bancassurance, direct-to-customer, and aggregator platforms, improving issuance speed and service quality. Structural reforms, including principle-based regulations and service standards for fast cashless approvals and discharge, are reshaping underwriting and claims operations. Capital liberalization, including 100% FDI and eased reinsurance entry norms, is drawing capacity and expertise into the India life and non-life insurance market, strengthening its long-term growth runway[1]Insurance Regulatory and Development Authority of India, “Handbook on Indian Insurance Statistics,” IRDAI, irdai.gov.in.
Key Report Takeaways
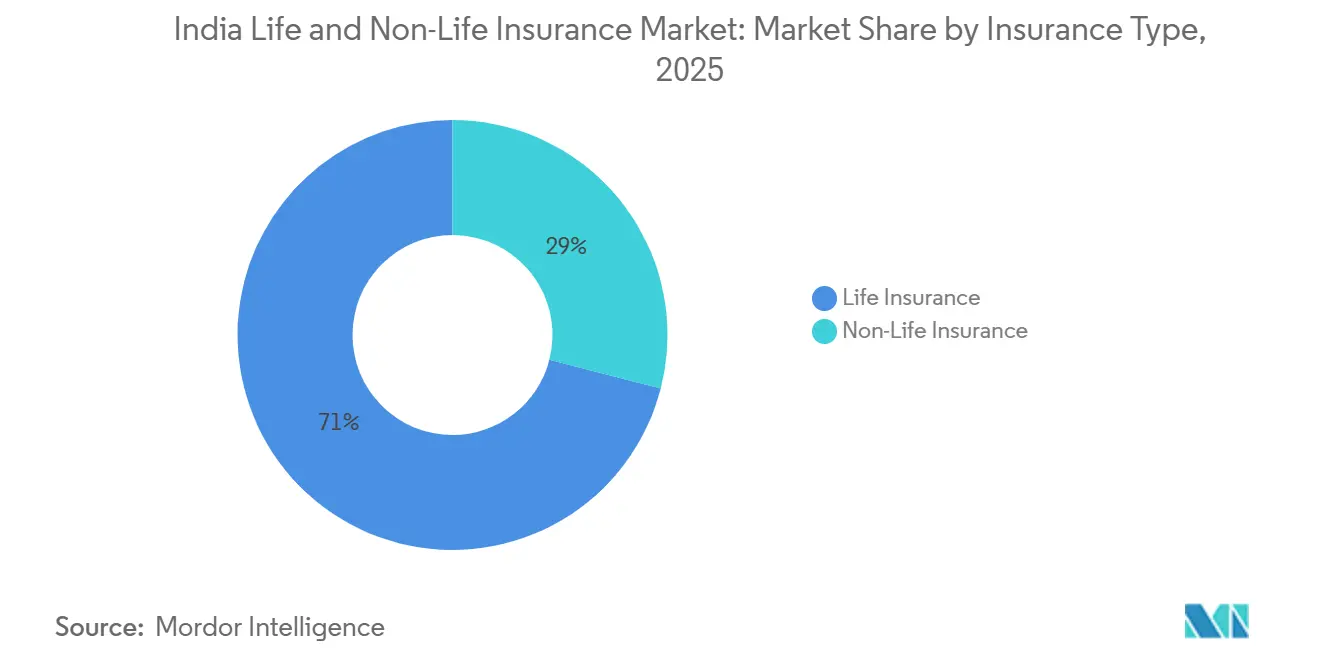
- By insurance type, in the India life and non-life insurance market, life insurance led with a 71% share in 2025, while non-life is forecast to expand at a 10.8% CAGR to 2031.
- By non-life line, in the India life and non-life insurance market, health insurance accounted for a 38.6% share in FY25 and is advancing at a 13.4% CAGR through 2031.
- By customer segment, in the India life and non-life insurance market, the retail segment held a 65% share in 2025 and is projected to grow at a 12.4% CAGR through 2031.
- By distribution channel, in the India life and non-life insurance market, brokers and agents held a 33.2% share in 2025, while direct sales and other digital-led channels recorded the highest projected CAGR at 10.4% through 2031.
Note: Market size and forecast figures in this report are generated using Mordor Intelligence’s proprietary estimation framework, updated with the latest available data and insights as of January 2026.
India Life And Non-Life Insurance Market Trends and Insights
Drivers Impact Analysis
| Driver | (~) % Impact on CAGR Forecast | Geographic Relevance | Impact Timeline |
|---|---|---|---|
| Middle-Class Expansion and Income Growth | +2.1% | National, strongest in urban tier-1 and tier-2 cities | Medium term (2-4 years) |
| Government Schemes and IRDAI Campaigns | +1.8% | National, with concentrated reach in rural and semi-urban areas | Long term (≥ 4 years) |
| Apps, Aggregators, and Online Policies | +1.5% | National core, spillover to tier-3 cities and rural pockets | Short term (≤ 2 years) |
| Tax Incentives | +1.0% | National | Medium term (2-4 years) |
| Rising Health Awareness | +1.3% | National, urban-centric, with expanding semi-urban penetration | Medium term (2-4 years) |
| Climate Catastrophe Losses and Property Re-rating | +0.9% | Regional hotspots including Gujarat, Maharashtra, Tamil Nadu, and Delhi-NCR | Long term (≥ 4 years) |
| Source: Mordor Intelligence | |||
Rising Middle-Class Population & Income Levels
The growth of the middle-income cohort supports a larger protection and savings footprint, with the group projected to reach a meaningful majority share of households by 2030 as per national development indicators, which raises demand for life, health, and motor covers across cities and towns. Rising per capita income, which reached USD 2,730 in FY25, links to stronger persistency and higher ticket sizes as households maintain premiums through inflation cycles and rising healthcare costs, which is visible in improving 13th and 61st month metrics at leading carriers. Tier-2 and tier-3 cities now drive a larger proportion of new retail premium issuance, and customers in smaller towns increasingly select higher sum-insured brackets for family health covers, indicating both awareness gains and ability to pay. The policy environment supports affordability through targeted tax relief and exemptions, including the GST exemption on individual and family floater health covers effective September 22, 2025, which reduces out-of-pocket costs and accelerates adoption[2]Press Information Bureau, “Ministry of Finance Year Ender 2025 Department of Financial Services,” Government of India, pib.gov.in. Faster product filings under use-and-file and digital onboarding reduce friction for first-time buyers, which strengthens the funnel in emerging centers of demand across the India life and non-life insurance market.
Government Schemes and IRDAI-Led Campaigns Improving Insurance Understanding
Large public programs anchor awareness and habitual use of protection across rural, semi-urban, and urban households by providing standardized covers, claims processes, and service touchpoints through bank-linked channels. The Pradhan Mantri Jeevan Jyoti Bima Yojana and Pradhan Mantri Suraksha Bima Yojana continue to enroll millions of lives while disbursing claims at scale, which normalizes insurance as a family financial necessity and builds a cross-sell base for voluntary covers. The Pradhan Mantri Fasal Bima Yojana extends protection for farmers with expanded state participation and insured area gains, supported by digital tools for data collection and transparent claim estimation. IRDAI’s “Insurance for All by 2047” roadmap aligns public education, product simplification, and last-mile distribution through initiatives such as Bima Vistaar and Bima Vahak, including a local women-led network that is scaling enrollment activity. Bima Sugam’s national marketplace is positioned to unify purchase, service, and claims and to lift penetration over the next five years, with ecosystem-wide participation mandated to reduce friction and improve transparency. Together, policy and regulator-led actions expand the addressable base for life, health, and crop in the India life and non-life insurance market.
Apps, Aggregator Platforms, and Online Policies Boosting Reach and Convenience
Digital channels have moved from adjunct to core, with IRDAI registering 32 web aggregators, a defined capital and disclosure framework, and a structured approach to policy comparison that protects consumers and clarifies commission practices. Aggregators and insurer direct platforms deliver faster issuance through automated KYC, rule-based underwriting, and simplified feature displays, which reduces information asymmetry for first-time buyers in both metros and smaller cities. UPI-based premium payments have crossed one-third of total premium transactions in FY25, with higher usage in health and investment-linked products, indicating strong acceptance of digital payments across customer cohorts. The Bima Sugam marketplace targets phased access from late 2025, with a neutral infrastructure for purchasing, servicing, and claims that is modeled on interoperable rails to amplify reach and lower distribution costs. Tier-2 and tier-3 regions are compounding faster than metros on digital policy purchases as smartphone and internet penetration deepen, which broadens the funnel for agent-assisted and direct models in the India life and non-life insurance market.
Rising Health Awareness
Medical inflation near 12% and heightened awareness of hospitalization expenses are driving sustained momentum in retail and group health, with carriers reporting record claim counts and improved settlement ratios through FY25. Settlement performance has strengthened with wider cashless adoption, in-house claims processing, and clearer service benchmarks for pre-authorization and discharge, which lift customer satisfaction. IRDAI has widened eligibility by removing upper age limits, reducing moratorium periods, and lowering waiting periods for pre-existing conditions, which expands retail addressability, including senior and high-risk populations. Payout trends reflect broader coverage of lower-ticket claims as retail and group penetration widen, even as carriers reprice and refine underwriting models to manage frequency and severity. The National Digital Health framework and claims exchange infrastructure are drawing more insurers into digital-first claim processing, which supports faster turnaround and data-rich underwriting in the India life and non-life insurance market.
Restraints Impact Analysis
| Restraint | (~) % Impact on CAGR Forecast | Geographic Relevance | Impact Timeline |
|---|---|---|---|
| Low Insurance Penetration and Density | -1.2% | National, most acute in rural and semi-urban regions | Long term (≥ 4 years) |
| Price-Based Competition in Motor and Health | -1.5% | National, concentrated in urban clusters with high insurer competition | Medium term (2-4 years) |
| Limited Reach in Rural Areas and Complex Products | -0.9% | Rural India, covering approximately 65% of the population | Long term (≥ 4 years) |
| Pricing and Competition Pressure | -1.1% | National, intensifying in tier-1 and tier-2 cities | Short term (≤ 2 years) |
| Source: Mordor Intelligence | |||
Low Insurance Penetration & Density
Penetration at 3.7% of GDP in FY25 remains below the global average, and density advances are gradual relative to global benchmarks, which signals continued gaps in awareness and affordability in mass-market and rural segments. Life penetration eased slightly in FY25 while non-life held steady near 1.0% of GDP, and density at USD 97 trails the global level by a large margin, which points to structural challenges in product comprehension and payment flexibility[3]Insurance Regulatory and Development Authority of India, “Handbook on Indian Insurance Statistics,” IRDAI, irdai.gov.in. Adequacy of life cover remains low, and motor underinsurance persists, which underscores the importance of simple composite micro-products and wider local distribution through Common Service Centres, PoSPs, and micro-agents. Vernacular interfaces and mobile-first journeys help make product features easier to compare and understand, which is necessary for first-time buyers in evolving markets. IRDAI’s roadmap and awareness initiatives are designed to close the penetration-density gap over time through targeted distribution expansion and product simplification across the India life and non-life insurance market.
Price-Based Competition in Motor and Health Driving Down Combined Ratios
Premium discounting and high-cost acquisition have pressured non-life underwriting performance, with combined ratios above 100% across several lines in FY25 and cost structures influenced by expense caps and channel commissions. Health lines face upward pressure from medical inflation and higher claim frequency, which has led carriers to sharpen provider network management, adapt pricing, and increase in-house claims capabilities. Motor lines are adjusting to EV risk profiles, repair cost dynamics, and court awards that influence third-party pricing benchmarks, while pay-as-you-drive and coverage add-ons seek to align premiums with actual risk. Regulators have flagged that growth driven by costly distribution rather than operating efficiency is not sustainable, and have signaled the need to realign intermediary incentives with persistency and value. The policy focus is to shift from a high-cost growth pattern to an affordable, broad inclusion model that balances scale with quality across the India life and non-life insurance market.
Segment Analysis
By Insurance Type: Life Dominates, Non-Life Accelerates
Life insurance accounted for 71% of India's life and non-life insurance market share in 2025, supported by tax-advantaged savings, broader protection choices, and distribution depth across agency and bancassurance. Premium momentum in FY25 included gains in individual new business, and leading carriers increased focus on non-par and unit-linked products to diversify beyond traditional participating lines. Persistency improved across the sector, with leading public and private carriers reporting stronger 13th and 61st month metrics that reflect better product-to-customer fit. Product innovation under the use-and-file framework has accelerated time to market, while protection and guaranteed-return choices have lifted value-of-new-business margins at large carriers. Tax and affordability changes, including the GST exemption on retail life and health premiums effective in late September 2025, boosted monthly sales and new business momentum into Q4 of calendar 2025.
Non-life is projected to expand at a 10.8% CAGR through 2031, which outpaces life growth as health and motor lines benefit from rising risk awareness, product modularity, and stronger cashless claim infrastructure. Health leads non-life by premium share and shows improved settlement performance with higher cashless throughput and greater in-house claims processing at top carriers. Motor’s path is supported by mandated third-party coverage and rising EV penetration that requires updated underwriting for battery risk, collision severity, and repair costs. Liberalization of tariffs in fire, marine, and engineering allows better alignment of price with risk, which supports product customization for mid-market and corporate buyers. As digital onboarding and aggregator comparisons expand choice and transparency, private carriers continue to gain ground in the India life and non-life insurance market.
Note: Segment shares of all individual segments available upon report purchase
Get Detailed Market Forecasts at the Most Granular Levels
Download PDF
By Non-Life Line: Motor Stabilizes, Health Surges Ahead
Motor insurance represented 32.2% of non-life premiums in FY25, with growth tempered by muted passenger vehicle demand and price competition, while a medium-term acceleration is expected as EV adoption increases and rural two-wheeler sales recover. Proposed third-party benchmarks reflect higher medical and repair cost trends, while coverage options such as zero-depreciation and usage-based pay-as-you-drive policies improve alignment of price with risk for consumers. Underwriting for EVs continues to evolve to address battery-related costs and network service limitations, which influence product design and premium levels. Claims analytics and telematics adoption are expected to increase for commercial and retail segments to improve frequency and severity management. As underwriting resets, motor’s projected 8.3% CAGR through 2029 provides a base for non-life expansion in the India life and non-life insurance market[4]Policyholder Service Portal, “Circulars,” IRDAI Policyholder Portal, policyholder.gov.in.
Health insurance is the fastest-growing non-life line and is projected to expand at a 13.4% CAGR through 2031, while also accounting for 38.6% of non-life premiums in FY25. Claims settlement reached record levels in FY25 with improved ratios, supported by cashless growth and expanded provider networks at general and standalone health carriers. Regulatory updates have widened the addressable market by removing age caps, reducing moratorium periods, and lowering waiting periods for pre-existing conditions, which supports senior and high-risk adoption. Payouts grew even as average payout per claim declined, indicating broader coverage of lower-ticket claims as retail and group penetration expanded. As the National Digital Health rails scale, the India life and non-life insurance market size for health is reinforced by faster, data-driven claim processing and more modular, add-on-oriented product designs.
By Customer Segment: Retail Leads Growth, Corporate Stabilizes
Retail customers held 65% of India's life and non-life insurance market share in 2025 and are projected to expand at a 12.4% CAGR through 2031, driven by rising incomes, digital onboarding, and simplified product options. Non-metro regions now contribute a larger share of new retail health policies as mobile-first journeys and vernacular interfaces reduce search and purchase friction. Customers are choosing higher sum insured brackets more often, and monthly payment adoption is rising in tier-2 and tier-3 towns as households manage cash flows. Modular designs dominate retail health, and protection products in life show faster growth within individual APE at several private carriers. The retail funnel benefits from aggregator transparency and direct-to-customer models that shorten issuance time and improve disclosure quality across the India life and non-life insurance market.
Corporate customers contribute the remaining share through group health, group term, and commercial property and liability covers, with slower growth influenced by price competition and cyclical demand in capital-intensive sectors. Group health holds the largest share of corporate premiums, while coverage of lives indicates higher average premiums compared to retail policies. Underwriting discipline has increased in group lines as claim ratios rise, which prompts carriers to rebalance toward retail where persistency and margins are stronger. Climate risk and infrastructure growth are raising awareness of property and specialty needs, including parametric structures under evaluation by government and regulators. As cost structures adjust and risk engineering deepens, corporate lines maintain steady demand within the India life and non-life insurance industry.

Note: Segment shares of all individual segments available upon report purchase
Get Detailed Market Forecasts at the Most Granular Levels
Download PDF
By Distribution Channel: Brokers/Agents Lead, Digital Channels Surge
Brokers and agents held 33.2% of distribution in 2025, which reflects the ongoing importance of advisory-led, local, and relationship-based selling. Agency expansion at public and private carriers supports a broader reach in semi-urban and rural areas, while professionalization and suitability checks are in sharper focus to address mis-selling risks. Bancassurance remains a central pillar for life issuance with contributions from major bank partners and rural banks, supported by flexible commission frameworks within expense-of-management limits. IRDAI has proposed perpetual registration for intermediaries and continues to refine guidelines for disclosure and grievance management, which supports higher channel quality over time. As hybrid advice models mature, brokers and agents remain core to the India life and non-life insurance market.
Direct and other channels are the fastest-growing cohort from a smaller base, with a projected 10.4% CAGR through 2031, supported by web aggregators, insurer-direct platforms, and point-of-sale persons. IRDAI registered 32 web aggregators with minimum capital and disclosure standards, which formalize comparison-based procurement and reinforce consumer protection. Aggregator journeys and direct models shorten issuance, improve transparency, and expand reach for first-time buyers in tier-2 and tier-3 regions as smartphone usage scales. As a neutral marketplace, Bima Sugam is expected to simplify comparisons and unify purchase, service, and claims, which can reduce distribution frictions and lift conversion. The India life and non-life insurance market size benefits from hybrid adoption as digital and assisted paths converge on faster issuance, lower friction, and consistent disclosure.
Geography Analysis
Penetration gains are strongest outside metros as tier-2 and tier-3 cities expand their share of new policy sales in retail health and add depth in retail life and motor. Vernacular interfaces and mobile-first journeys are central to adoption in these centers, and wider provider networks enable cashless claims that raise customer confidence. Faster pre-authorization and discharge timelines improve service outcomes, which supports word-of-mouth growth in policy purchasing. Aggregator and direct platforms expand coverage with transparent comparison for first-time buyers, which is central to building awareness and trust in smaller markets. These factors collectively lift the India life and non-life insurance market as non-metro demand compounds at higher rates than metro demand.
Urban and semi-urban centers remain the base for larger-ticket life savings and protection, and they drive scale in retail and group health as corporate benefits programs expand. Bancassurance and agent networks are dense in metro clusters and continue to support quick issuance, which aids persistency and cross-sell into protection. Regulatory changes that enable 100% FDI and lower net-owned-fund thresholds for foreign reinsurers invite more capacity and product breadth into urban markets first, with spillovers into semi-urban corridors. The distribution mix is shifting as bank partners integrate insurer journeys inside mobile and branch platforms, while direct models gain share through simplified disclosure and pricing transparency. As capital and product innovation concentrate in metros, the India life and non-life insurance market continues to grow through both product depth and geographic extension.
Regional risk concentration affects commercial lines in industrial hubs and coastal corridors, where flood, cyclone, and earthquake exposures raise the urgency for risk transfer. Modeling indicates rising frequency and severity for hydrological events, which strengthens the case for catastrophe protection and parametric structures to deliver faster post-event liquidity. Government agencies and IRDAI are evaluating broader frameworks to improve payouts following disasters, with reinsurance capacity diversifying as new entrants receive approvals. Specialty risk coverage for mid-market enterprises is expected to rise as risk engineering and analytics drive better pricing and segmentation. These dynamics broaden the India life and non-life insurance market across underinsured property and specialty classes.
Competitive Landscape
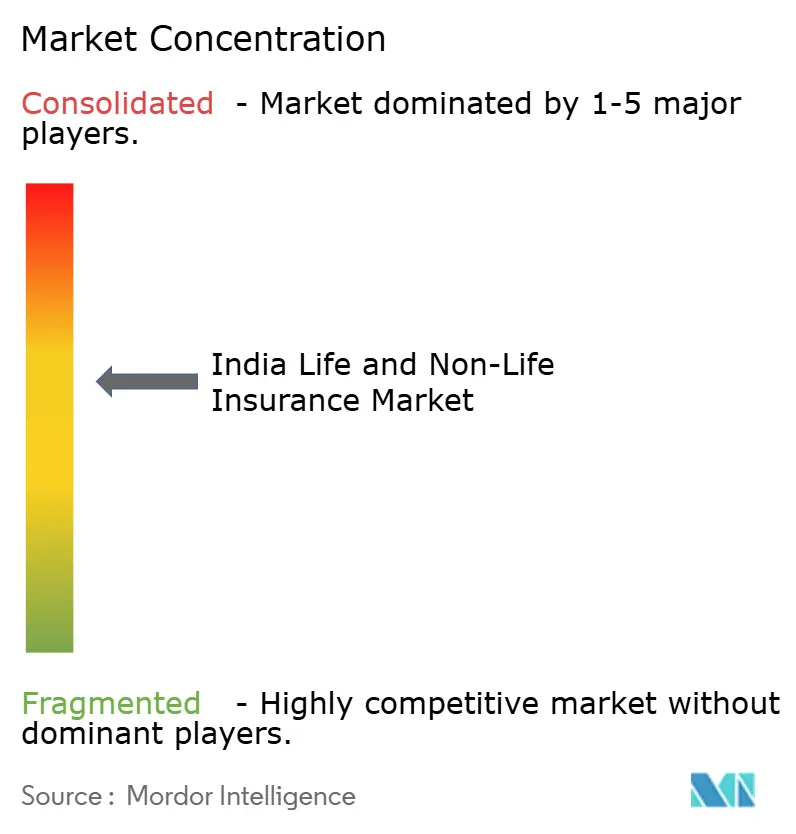
The India life and non-life insurance market features a concentrated life segment and a more fragmented non-life segment, with private players steadily expanding their footprint in distribution, claims capabilities, and product innovation.
Public sector leadership in life remains intact while private carriers accelerate non-par savings and protection mixes, faster issuance, and digital journeys to strengthen persistency. In non-life, private carriers have invested in analytics, provider networks, and modular product designs to improve claim outcomes and customer experience. Liberalized tariffs in fire, marine, and engineering enable more accurate risk-based pricing for corporate and mid-market clients. These shifts support sustainable growth as the India life and non-life insurance industry aligns products more closely with risk and service expectations.
Strategic activity is robust across deals, partnerships, and new entrants that add capacity and diversify expertise across lines. Allianz completed the divestment of a large stake in legacy joint ventures and is pursuing new partnerships, including reinsurance expansion with a local digital ecosystem anchor. Zurich acquired a controlling stake in a domestic general insurer to expand its presence, signaling long-term confidence in the growth outlook. Reinsurance depth is improving with IRDAI’s approval of a domestic private reinsurer and lowered net-owned-fund requirements for foreign branches, which reduces concentration and fosters competition. These moves sustain the momentum for product innovation and specialty coverage in the India life and non-life insurance market.
Channel models continue to evolve as carriers rebalance agency and bancassurance with direct and aggregator paths to improve cost-to-acquire and persistency. Regulatory focus on mis-selling prevention and suitability processes pushes the ecosystem toward higher advisory quality and standardized disclosures. Cashless claims, service benchmarks, and digital policy servicing are becoming central points of differentiation in both retail and corporate lines. As more carriers adopt in-house claims handling and expand provider networks, service quality and cost control are expected to improve. The combination of regulatory modernization, capital flexibility, and technology adoption strengthens the India life and non-life insurance market.
India Life And Non-Life Insurance Industry Leaders
Life Insurance Corporation of India
ICICI Prudential Life Insurance Company Limited
HDFC Life Insurance Co. Ltd.
SBI Life Insurance Co. Ltd.
Bajaj Allianz Life Insurance Co. Ltd.
- *Disclaimer: Major Players sorted in no particular order
Need More Details on Market Players and Competitors?
Download PDF
Recent Industry Developments
- January 2026: The Department of Financial Services Secretary M Nagaraju announced the government is reviewing the insurance commission structure to address rising distributor payouts and acquisition costs following the Reserve Bank of India’s Financial Stability Report of December 2025. The review aims to balance growth, affordability, and policyholder interests while addressing the high expense structure driven by costly distribution strategies.
- January 2026: Allianz SE completed the divestment of a 23% stake in Bajaj General Insurance Company and Bajaj Life Insurance Company to the Bajaj Promotor Group for approximately EUR 2.1 billion gross, with proceeds earmarked for strategic growth, including new ventures in India.
- December 2025: Parliament passed the Sabka Bima Sabki Raksha Amendment of Insurance Laws Act 2025, raising the FDI limit in insurance companies from 74% to 100% and introducing one-time intermediary registration and enhanced penalties.
- December 2025: The Ministry of Finance notified the Indian Insurance Companies Foreign Investment Amendment Rules 2025, relaxing governance norms for foreign-majority insurers and aligning with the 100% FDI framework.
Research Methodology Framework and Report Scope
Market Definitions and Key Coverage
Our study treats the Indian insurance market as the combined gross direct premiums of licensed life insurers and general (non-life) insurers, expressed in U.S. dollars at calendar-year average exchange rates. It tracks all new and renewal premiums across life, health, motor, property, crop, marine, liability, accident, and other statutory lines that domestic carriers underwrite.
Scope Exclusions: Reinsurance inward treaties, overseas branches, and mutual/co-operative micro-insurance pools lie outside the boundary.
Segmentation Overview
- By Insurance Type
- Life Insurance
- Non-Life Insurance
- Motor Insurance
- Health Insurance
- Property Insurance
- Liability Insurance
- Other Insurance
- By Customer Segment
- Retail
- Corporate
- By Distribution Channel
- Brokers/Agents
- Banks
- Direct Sales
- Other Channels
Detailed Research Methodology and Data Validation
Primary Research
Mordor analysts interviewed underwriting heads, bancassurance managers, digital broker CEOs, and actuarial consultants across the North, West, South, and East zones. These conversations clarified commission trajectories, embedded insurance uptake, and health loss ratios, enabling us to challenge desk-based assumptions and fine-tune channel growth curves.
Desk Research
We began with publicly available tier-1 references such as IRDAI annual handbooks, Reserve Bank of India Financial Stability Reviews, Ministry of Finance budget papers, the Insurance Information Bureau's morbidity tables, Swiss Re sigma series, and World Bank macro data. Company filings, 10-Ks, investor decks, and reputable press helped size carrier books and channel shares, while D&B Hoovers and Dow Jones Factiva supplied private-player financials. Periodic data from trade bodies like the General Insurance Council, plus patent statistics on insure-tech from Questel, rounded the secondary foundation. This list is illustrative, not exhaustive; many other sources were consulted for corroboration and gap-filling.
Market-Sizing & Forecasting
A calibrated top-down model converts regulator-reported premiums into U.S. dollars and splits them by line, customer type, and channel before being further filtered through lapse, surrender, and retention factors. Results are cross-checked with sampled bottom-up proxies, carrier disclosures, agent counts multiplied by average ticket, and policy-level ASPs to adjust totals. Key drivers include GDP per capita, insurance penetration, new-vehicle registrations, hospital utilization, digital policy share, and solvency-capital norms. Multivariate regression combined with scenario analysis projects each variable, and gap cases are bridged using three-year moving averages where disclosure is patchy.
Data Validation & Update Cycle
Outputs undergo variance checks against historic trends and independent ratio benchmarks; anomalies trigger analyst re-work and fresh stakeholder callbacks. The model is refreshed annually, with interim updates when material regulations or catastrophe losses emerge, ensuring clients always receive an up-to-date view.
Why Mordor's India Life & Non-Life Insurance Baseline Commands Confidence
Published estimates often differ because firms pick unequal scopes, fiscal calendars, and premium treatments.
Key gap drivers are inclusion of reinsurance and inward retrocession by some publishers, use of fiscal-year rupee values without currency harmonization, and varying optimism around digital channel momentum. Our disciplined scope and dual-track validation mitigate these swings.
Benchmark comparison
| Market Size | Anonymized source | Primary gap driver |
|---|---|---|
| USD 145.8 B (2025) | Mordor Intelligence | - |
| USD 205 B (2025) | Global Consultancy A | Counts reinsurer-accepted premiums and uses year-end FX; limited channel disaggregation |
| USD 222 B (FY 2026) | Industry Source B | Aggregates fiscal receipts, includes government micro-schemes, no calendar alignment |
| USD 303.3 B (2024) | Research Publisher C | Blends life and non-life with pension and mutual fund linked covers; lacks lapse adjustments |
The comparison shows that when discrete scope choices, consistent currency treatment, and lapse adjustments are applied, as in Mordor's approach, decision-makers obtain a balanced, transparent baseline they can trace back to auditable variables and refresh with minimal effort.
Need A Different Region or Segment?
Customize Now
Key Questions Answered in the Report
What is the projected size and growth of the India life and non-life insurance market by 2031
The India life and non-life insurance market size is USD 156.2 billion in 2026 and is projected to reach USD 244.5 billion by 2031 at a 9.4% CAGR.
Which segments lead and grow fastest within the India life and non-life insurance market
Life leads on current share with 71% in 2025, while non-life and health are the fastest growing, with non-life at 10.8% CAGR to 2031 and health at 13.4% CAGR to 2031.
How are channels evolving in the India life and non-life insurance market
Direct and digital-led channels grow fastest from a smaller base under IRDAI's aggregator and use-and-file frameworks, while brokers and agents retain a 33.2% share.
What regulatory shifts most shape product and claims in India
Principle-based regulations and use-and-file accelerate product launches, while IRDAI's service benchmarks drive faster cashless claim approvals and discharge.
Which non-life lines set the pace in the India life and non-life insurance market
Health leads on premium share and growth at 13.4% CAGR to 2031, while motor is set to improve to 8.3% CAGR through 2029 as EV adoption and rural demand rise.
What capital and capacity changes support growth in India
The FDI cap at 100% and lowered net-owned-fund requirements for foreign reinsurers add capacity, while new reinsurance entrants and strategic deals deepen competition.


