Levulinic Acid Market Size and Share
Market Overview
| Study Period | 2020 - 2031 |
|---|---|
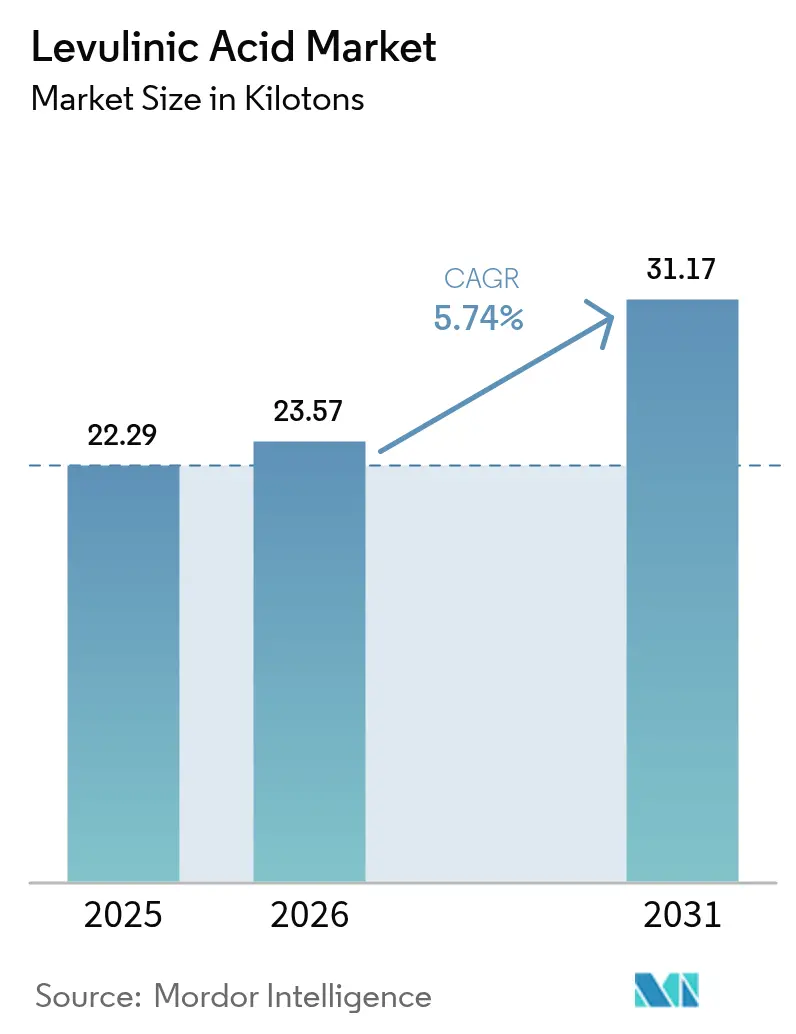
| Market Volume (2026) | 23.57 kilotons |
| Market Volume (2031) | 31.17 kilotons |
| Growth Rate (2026 - 2031) | 5.74% CAGR |
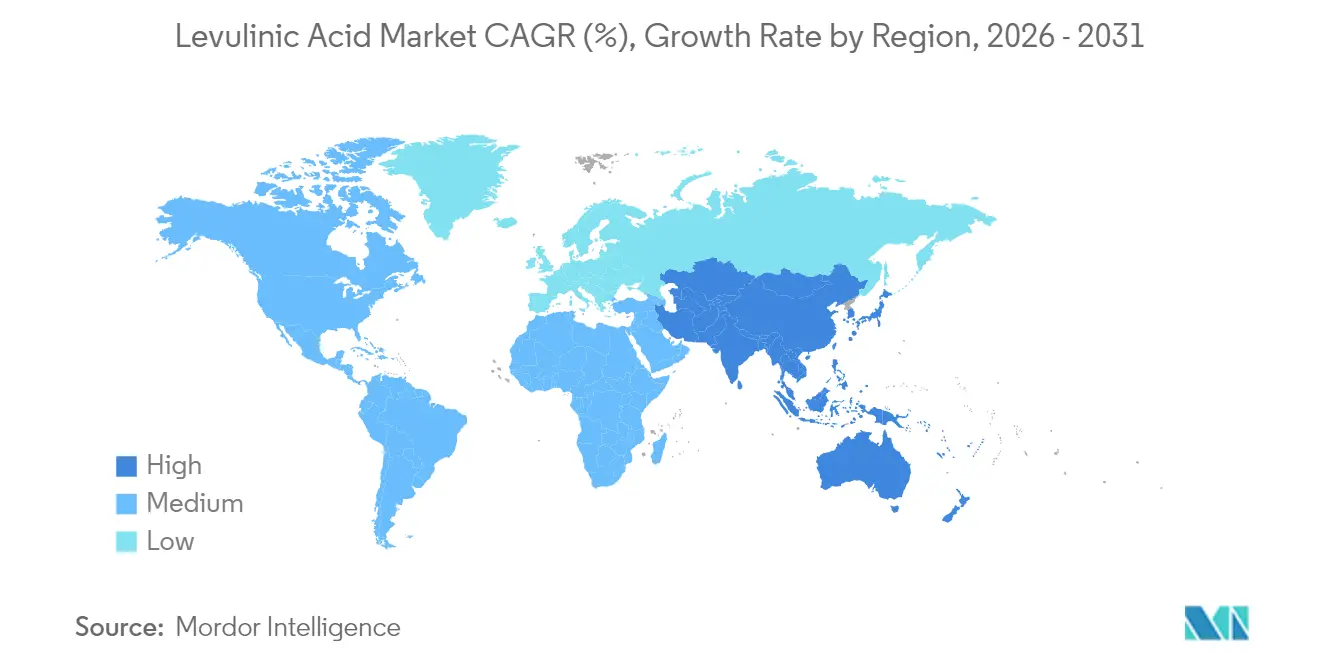
| Fastest Growing Market | Asia Pacific |
| Largest Market | Asia Pacific |
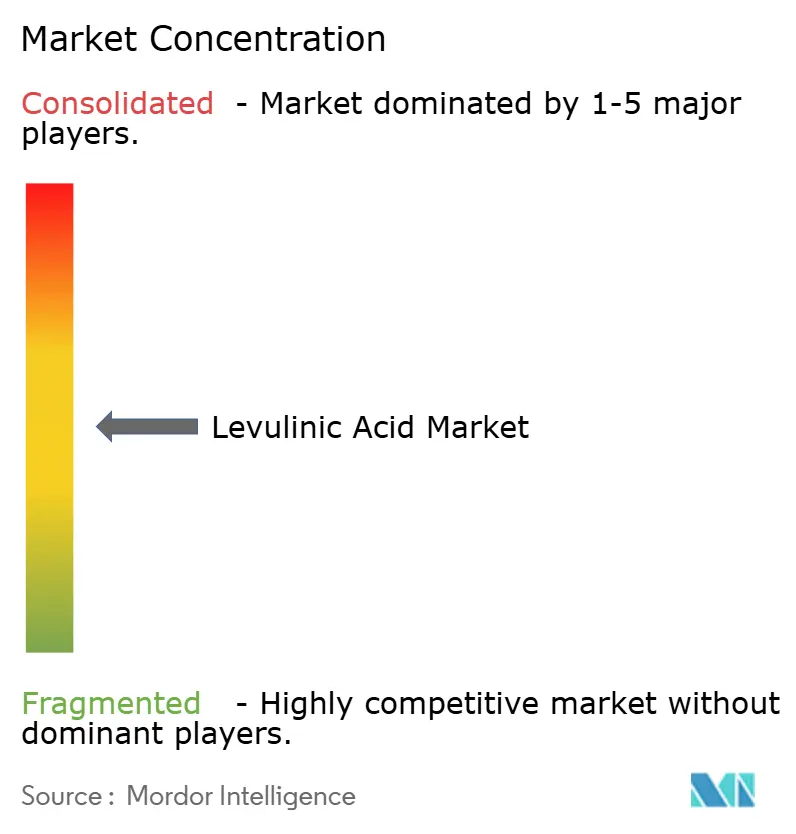
| Market Concentration | Medium |
Major Players *Disclaimer: Major Players sorted in no particular order Image © Mordor Intelligence. Reuse requires attribution under CC BY 4.0. | |
Levulinic Acid Market Analysis by Mordor Intelligence
Levulinic Acid market size in 2026 is estimated at 23.57 kilotons, growing from 2025 value of 22.29 kilotons with 2031 projections showing 31.17 kilotons, growing at 5.74% CAGR over 2026-2031. Demand grows as regulatory programs such as the EU Chemicals Strategy for Sustainability and the US Federal Sustainable Chemistry Plan press manufacturers to adopt bio-based intermediates that help decarbonize value chains. Cosmetics and personal care remain the largest outlet because levulinic acid serves as a naturally sourced preservative that satisfies clean-label preferences. Fuel and fuel-additive manufacturers are scaling purchases fastest as the compound underpins gamma-valerolactone pathways for sustainable aviation fuel. Acid hydrolysis technology continues to dominate installed capacity, yet enzymatic and microbial routes are attracting new investment to cut unit costs and ease catalyst deactivation issues. Asia-Pacific keeps its lead on both volume and growth thanks to abundant biomass, supportive policy, and a dense chemical manufacturing base, while new projects in Italy and North America signal gradual capacity consolidation across the levulinic acid market.
Key Report Takeaways
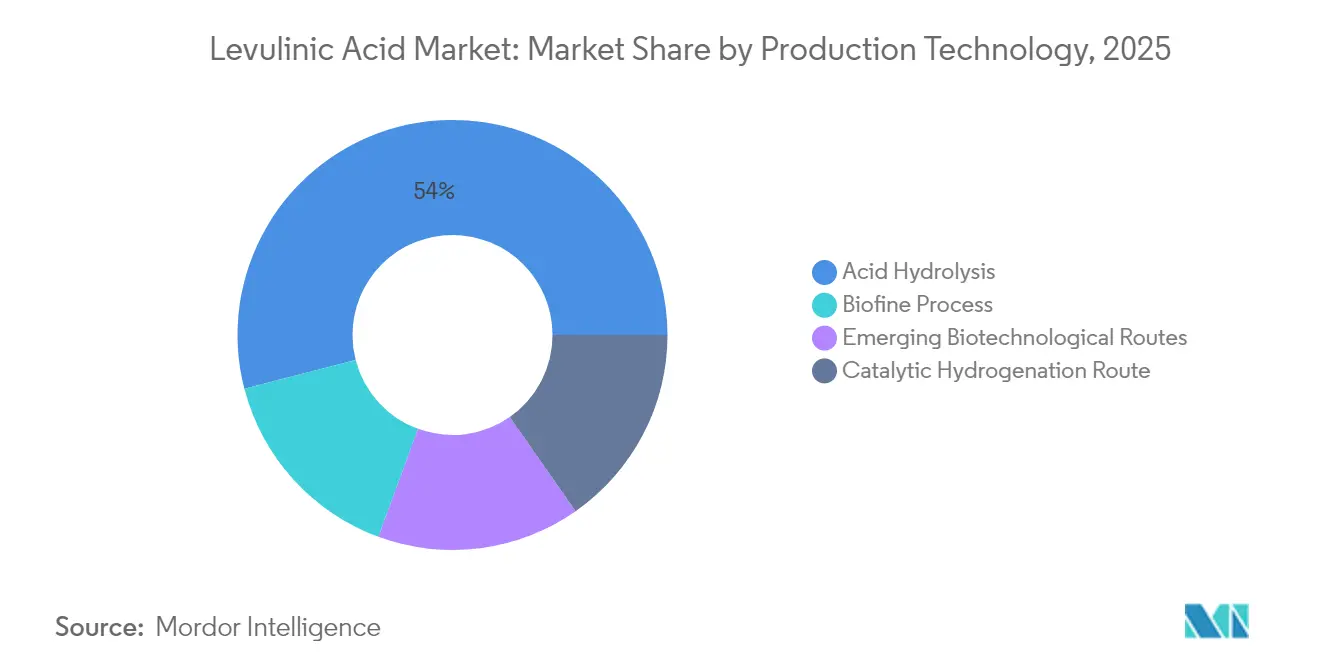
- By production technology, acid hydrolysis held 54.03% of levulinic acid market share in 2025, whereas emerging biotechnological routes are set to expand at 6.69% CAGR through 2031.
- By grade, industrial grade commanded 59.35% share of the levulinic acid market size in 2025, while pharmaceutical grade exhibits the fastest 6.92% CAGR to 2031.
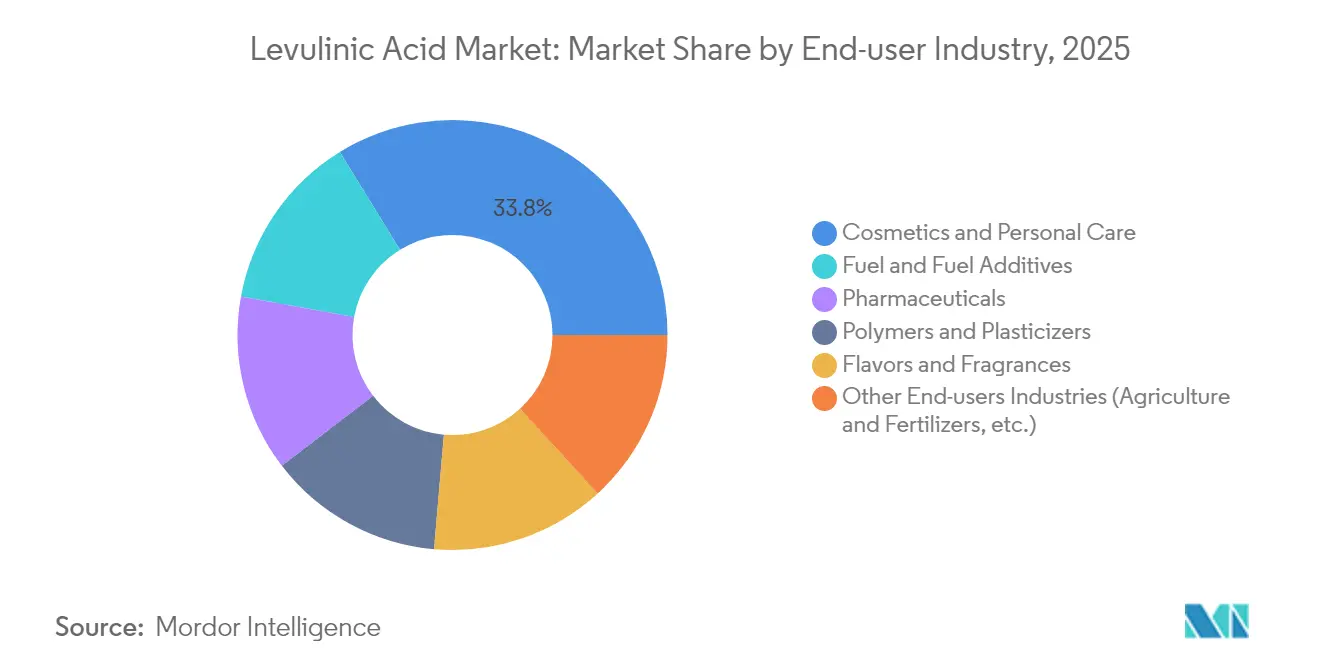
- By end-user industry, cosmetics and personal care led with a 33.78% revenue share in 2025; fuel and fuel additives post the highest projected 6.98% CAGR through 2031.
- By geography, Asia-Pacific accounted for 40.74% of global volume in 2025 and is on track for the quickest 6.49% CAGR during the forecast horizon.
Note: Market size and forecast figures in this report are generated using Mordor Intelligence’s proprietary estimation framework, updated with the latest available data and insights as of 2026.
Global Levulinic Acid Market Trends and Insights
Drivers Impact Analysis*
| Driver | (~) % Impact on CAGR Forecast | Geographic Relevance | Impact Timeline |
|---|---|---|---|
| Rising demand for bio-based solvents and plasticizers | +1.5% | EU, North America, Global spill-over | Medium term (2-4 years) |
| Growing use of levulinic acid derivatives as low-carbon fuel additives | +0.8% | Asia-Pacific core, North America spill-over | Long term (≥ 4 years) |
| Increasing adoption in cosmetics and personal care as natural preservative | +1.2% | North America and EU lead, Global reach | Short term (≤ 2 years) |
| Increasing usage as a substitute in traditional fertilizers | +0.9% | Asia-Pacific and South America | Medium term (2-4 years) |
| Circular-economy partnerships with pulp and paper mills | +0.6% | North America, EU, Asia-Pacific | Long term (≥ 4 years) |
| Source: Mordor Intelligence | |||
Rising Demand for Bio-Based Solvents and Plasticizers
Regulatory pressure to replace phthalate plasticizers is propelling levulinic acid esters into polymer films and rigid packaging. Recent trials achieved 546% elongation at break in polylactic acid when 20 wt% levulinic acid ester replaced traditional citrate plasticizers, matching performance while raising bio-conetent[1]Wenxiang Xuan et al., “Bio-based Plasticizers for PLA,” sciencedirect.com[. The EU Chemicals Strategy frames bio-based plasticizers as preferred under essential-use criteria, encouraging brand owners to specify levulinic acid derivatives. Established catalyst suppliers have lowered esterification energy demand by almost 20%, narrowing the price gap with petro-routes. Consumer packaged goods firms aim to lift bio-sourced inputs to at least 25% by 2030, creating forward purchasing commitments that anchor new capacity agreements across the levulinic acid market.
Growing Use of Levulinic Acid Derivatives as Low-Carbon Fuel Additives
Conversion of levulinic acid into gamma-valerolactone provides an intermediate for sustainable aviation fuel (SAF) that can reach breakeven production costs near USD 3.15 per gasoline-equivalent gallon in integrated biorefineries. Catalysts developed in 2024 delivered 87.6% yield of 2-methyltetrahydrofuran, a blending component that upgrades octane and lowers lifecycle carbon intensity. Global biofuel consumption rose to 107 Mtoe in 2023 and investments topped USD 13 billion, while aviation stakeholders pledge 35% SAF penetration by 2070, sharpening long-term offtake agreements for levulinic acid derivatives. Pilot enzymatic routes now claim a tenfold increase in precursor yield from identical biomass inputs, signalling further cost reduction potential.
Increasing Adoption in Cosmetics and Personal Care as Natural Preservative
Levulinic acid meets clean-beauty criteria because it originates from plant biomass and shows broad antimicrobial coverage at concentrations below 0.6 wt%. Safety reviews by the Research Institute for Fragrance Materials found no genotoxicity and affirmed consumer safety at current usage volumes. Global brands seeking paraben-free labels switched to levulinic acid blends that simultaneously act as pH stabilizers, streamlining formulation. Improved purification processes now deliver colorless, low-odor grades that integrate into premium serums without impacting sensory profiles. Rising demand for organic cosmetics in Asia-Pacific expands the customer base, reinforcing the leading position of the levulinic acid market in personal care.
Increasing Usage as a Substitute in Traditional Fertilizers
Farmers face higher input costs and tighter nutrient runoff rules, prompting trials of levulinic acid complexes that function as plant growth regulators and soil conditioners. Field data from China and Brazil show nitrogen-use efficiency gains of up to 12%, enabling fertilizer rate cuts while preserving yield. Production from agricultural residues such as sugarcane bagasse delivers a circular model that lowers disposal fees and monetizes waste biomass. Levulinic acid decomposes rapidly in soil, avoiding persistence concerns tied to synthetic fertilizers. National subsidy programs that reward low-carbon agro-inputs further reinforce uptake across the Asia-Pacific levulinic acid market.
Restraints Impact Analysis*
| Restraint | (~) % Impact on CAGR Forecast | Geographic Relevance | Impact Timeline |
|---|---|---|---|
| High production cost versus petro-substitutes | -0.7% | Global, acute in cost-sensitive markets | Short term (≤ 2 years) |
| Limited commercial-scale manufacturing capacity | -0.4% | Global, particularly emerging markets | Medium term (2-4 years) |
| Catalyst deactivation from humin build-up in continuous reactors | -0.5% | Global, affects all production technologies | Medium term (2-4 years) |
| Source: Mordor Intelligence | |||
High Production Cost versus Petro-Substitutes
Levulinic acid remains pricier than incumbent petrochemical intermediates because biomass yields are modest and downstream purification is capital intensive. Weak chemical sector recovery—US output grew only 1.5% in 2024—limits the capacity of buyers to pay bio-premiums[2]American Chemistry Council, “Mid-Year Chemical Industry Outlook 2024,” americanchemistry.com. In polymers and solvents the levulinic acid market competes with raw materials produced at megascale crackers that long ago depreciated assets, widening the cost gap. Catalyst fouling in acid hydrolysis plants adds maintenance expense and downtime that erode margins. As a result, some bulk users defer substitution plans until second-generation processes deliver lower variable costs.
Limited Commercial-Scale Manufacturing Capacity
Only a handful of facilities exceed 5,000 t/a, leaving buyers exposed to supply-chain risk when outages occur. GFBiochemicals opened a 10,000 t/a plant in Caserta, Italy, the world’s largest to date, yet overall effective capacity still trails projected demand for fuel additives and cosmetics. Capital intensity above USD 6,000 per installed ton discourages new entrants, especially where technology performance guarantees remain unproven. Regional imbalances persist; Asia-Pacific, home to the fastest-growing customer base, relies on imports for roughly one-third of its consumption, heightening logistics costs and lead-time uncertainty across the levulinic acid market.
*Our forecasts treat driver/restraint impacts as directional, not additive. The impact forecasts reflect baseline growth, mix effects, and variable interactions.
Segment Analysis
By Production Technology: Acid Hydrolysis Dominates Despite Biotech Advances
Acid hydrolysis retained 54.03% share of the levulinic acid market in 2025 by leveraging decades of commercial experience and the Biofine process that attains 70-80% theoretical yield. Most current plants use dilute sulfuric acid to convert cellulose into intermediate sugars and then levulinic acid, a route viewed as low risk by investors. However, catalyst decay and humin disposal impose recurring costs that pressure margins, especially when feedstock moisture fluctuates. Emerging enzymatic and microbial methods post a 6.69% CAGR as developers showcase tenfold higher precursor yields per unit biomass and reduced utility demand. Start-ups in the Netherlands and Canada secured Series B funding in 2025 to scale demo units that bolt onto pulp-mill side streams, signaling confidence in biotechnological cost-down potential for the levulinic acid market.
Acid hydrolysis players are investing in continuous-flow reactors equipped with inline separation to cut residence time and limit humin buildup. Meanwhile, catalytic hydrogenation units next door upgrade in-house levulinic acid to gamma-valerolactone or 2-methyltetrahydrofuran, capturing margin in drop-in fuel additives. Enzymatic routes still face enzyme cost and stability hurdles, yet platform suppliers report double-digit reductions in enzyme loading after protein-engineering breakthroughs. The technology mix reflects a transition era where established processes secure present volumes while biotech innovation charts the next productivity leap for the levulinic acid market.


By Grade: Industrial Applications Drive Volume Growth
Industrial grade products represented 59.35% of levulinic acid market share in 2025 because polymer, plasticizer, and fuel customers tolerate broader impurity ranges. Producers utilize simplified crystallization and filtration trains, trimming capex and processing time. Demand from PLA compounders and low-carbon fuel blenders keeps order books full, making industrial grade the price leader. Pharmaceutical grade grows at 6.92% CAGR through 2031 as purity standards tight-en for active pharmaceutical ingredient precursors and excipients. Investments in multi-column chromatography and simulated moving-bed systems push batch purities above 99.5 wt%, unlocking supply for high-value oncology and antiviral syntheses.
Food grade remains a niche but lucrative pocket because levulinic acid doubles as a flavor enhancer and preservative in sauces and meat analogs. Compliance with food-additive monographs elevates quality-assurance costs, yet suppliers capture premium spreads. Continuous decolorization with activated carbon cuts color units below 50 APHA, satisfying beverage manufacturers. As processing know-how diffuses, cross-grade flexibility emerges; some plants can swing between industrial and food-grade campaigns, raising utilization and supporting a more resilient levulinic acid market.
By End-user Industry: Cosmetics Lead While Fuel Additives Accelerate
Cosmetics and personal care retained 33.78% share in 2025 because levulinic acid provides antimicrobial action and pH control that fit clean-label narratives. Global skin-care launches containing “bio-based preservative” claims climbed 18% year on year, and levulinic acid featured in toners, serums, and scalp treatments. Brands highlight low skin-irritation scores validated in patch tests, reinforcing consumer trust. Research institutes perfected deodorized grades, eliminating off-notes that previously restricted use in fragrance-centric products.
Fuel and fuel-additive users mark the fastest 6.98% CAGR as airlines and refiners trial gamma-valerolactone blends to meet emerging SAF mandates. National blending quotas in the EU and the US, coupled with tax credits under the Inflation Reduction Act, drive offtake contracts that span five years or longer. Pharmaceutical manufacturers adopt levulinic acid to synthesize paclitaxel side chains and other oncology intermediates, capitalizing on its bifunctional ketone and carboxyl chemistry that streamlines reaction steps. In polymers, levulinic acid esters displace phthalates in flexible PVC and PLA, meeting upcoming REACH restrictions while delivering equal tensile strength. Agricultural trials scale as levulinic acid complexes enhance micronutrient uptake in horticulture, rounding out a diverse customer portfolio that anchors future growth across the levulinic acid market.
Geography Analysis
Asia-Pacific constitutes the demand epicenter at 40.74% volume share in 2025 and a projected 6.49% CAGR to 2031, supported by China’s biomass surpluses and national carbon-neutrality targets. Provincial grants cover up to 30% of capital expenditure for bio-chemical projects, spurring new plants in Shandong and Guangxi. Japan’s commercial woody-ethanol scheme underpins co-production of levulinic acid, while India’s specialty-chemicals capacity expansion—notably in Gujarat—creates fresh downstream pull. Regional supply tightness keeps pricing firm, encouraging local investors to shorten import routes.
North America holds a mature yet opportunity-rich base where federal tax credits and loan guarantees spur biorefinery retrofits. Canada’s Clean Fuel Standard compels refiners to adopt low-carbon feedstock, boosting contracts for gamma-valerolactone derived from levulinic acid. Mexican chemical clusters in Veracruz eye corn stover as an affordable feedstock, though logistics and agronomic residue management still limit scale. The market exhibits mid-single-digit growth as producers enhance process efficiency and secure long-term biomass offtake.
Europe preserves a strong foothold owing to rigorous sustainable-chemistry legislation. Italy hosts the world’s largest single levulinic acid unit at 10,000 t/a, demonstrating industrial feasibility, while German and French firms pilot enzyme-enabled variants. The EU Fit-for-55 package accelerates demand in transport fuels and plastics, and Horizon Europe grants finance catalyst research that aims to outpace Asia on cost. South America and the Middle-East and Africa remain emerging pockets; Brazil’s sugarcane bagasse and South Africa’s forest residues present ample feedstock, yet investment decisions hinge on political stability and infrastructure to tap these reserves for the levulinic acid market.

Competitive Landscape
The global levulinic acid market is moderately fragmented, with no supplier exceeding 15% individual share. First movers such as GFBiochemicals leverage integrated production and derivative facilities to gain negotiating power with large FMCG brands. Medium-size players, including AVA Biochem and GF Panto, focus on niche high-purity grades for pharmaceutical and food applications. Multinationals like Merck KGaA and Thermo Fisher Scientific act mainly as distributors, bundling levulinic acid into broader laboratory supply catalogues.
Technology differentiation remains the core strategic lever. Producers with proprietary heterogeneous catalysts promise longer cycle times and lower humin formation, while enzyme-route pioneers court venture funding to scale pilot lines. Vertical integration into downstream gamma-valerolactone or plasticizer esters secures incremental margin and shields suppliers from commodity swings. Recent years saw joint ventures between pulp mills and biotech start-ups to co-locate levulinic acid units, capitalizing on captive lignocellulosic streams.
M&A appetite is rising as investors pursue platform chemicals that satisfy ESG screens. Private-equity funds took minority stakes in two European firms during 2025, anticipating demand upside from SAF mandates. Yet capacity lags demand; signed off-take agreements exceed global nameplate supply by an estimated 12%, suggesting a tightening balance that could trigger further consolidation. Suppliers able to prove reliable volumes at competitive cost are poised to expand share in the levulinic acid market.
Levulinic Acid Industry Leaders
GFBiochemicals
Zibo Changlin Chemical
Hebei Yanuo Bioscience
Biofine Technology LLC
NXTLEVVEL Biochem
- *Disclaimer: Major Players sorted in no particular order

Recent Industry Developments
- February 2025: Biofine Technology, LLC received U.S. Patent No. 12,227,486 for systems and methods to produce levulinic acid, furfural, and formic acid. The patent focuses on improving biorefinery process efficiency and scalability, which may enhance the commercial viability of levulinic acid production.
- December 2024: Godavari Biorefineries Limited has announced an INR 130 crore (USD 15.6 million) investment to set up a new 200 KLPD corn/grain distillery. This project aims to increase ethanol production while expanding the potential output of levulinic acid.


Global Levulinic Acid Market Report Scope
Levulinic acid is a white crystalline solid soluble in water and organic solvents. It is an organic compound and is derived from cellulose degradation.
The levulinic acid market is segmented by end-user industry (Cosmetics and Personal Care, Pharmaceuticals, Agrochemicals, Polymers and Plasticizers, Fuel and Fuel Additives, Flavors and Fragrances, and Other End-user Industries) and geography (Asia-Pacific, North America, Europe, South America, and Middle-East and Africa). The report offers market size and forecasts for the market in terms of volume (Tons) for all the above segments.
| Acid Hydrolysis |
| Biofine Process |
| Catalytic Hydrogenation Route |
| Emerging Biotechnological Routes |
| Industrial Grade |
| Pharma Grade |
| Food Grade |
| Cosmetics and Personal Care |
| Pharmaceuticals |
| Polymers and Plasticizers |
| Fuel and Fuel Additives |
| Flavors and Fragrances |
| Other End-users Industries (Agriculture and Fertilizers, etc.) |
| Asia-Pacific | China |
| Japan | |
| India | |
| South Korea | |
| ASEAN Countries | |
| Rest of Asia-Pacific | |
| North America | United States |
| Canada | |
| Mexico | |
| Europe | Germany |
| United Kingdom | |
| France | |
| Italy | |
| Spain | |
| Russia | |
| NORDIC Countries | |
| Rest of Europe | |
| South America | Brazil |
| Argentina | |
| Rest of South America | |
| Middle-East and Africa | Saudi Arabia |
| South Africa | |
| Rest of Middle-East and Africa |
| By Production Technology | Acid Hydrolysis | |
| Biofine Process | ||
| Catalytic Hydrogenation Route | ||
| Emerging Biotechnological Routes | ||
| By Grade | Industrial Grade | |
| Pharma Grade | ||
| Food Grade | ||
| By End-user Industry | Cosmetics and Personal Care | |
| Pharmaceuticals | ||
| Polymers and Plasticizers | ||
| Fuel and Fuel Additives | ||
| Flavors and Fragrances | ||
| Other End-users Industries (Agriculture and Fertilizers, etc.) | ||
| By Geography | Asia-Pacific | China |
| Japan | ||
| India | ||
| South Korea | ||
| ASEAN Countries | ||
| Rest of Asia-Pacific | ||
| North America | United States | |
| Canada | ||
| Mexico | ||
| Europe | Germany | |
| United Kingdom | ||
| France | ||
| Italy | ||
| Spain | ||
| Russia | ||
| NORDIC Countries | ||
| Rest of Europe | ||
| South America | Brazil | |
| Argentina | ||
| Rest of South America | ||
| Middle-East and Africa | Saudi Arabia | |
| South Africa | ||
| Rest of Middle-East and Africa | ||


Key Questions Answered in the Report
What is the current size of the levulinic acid market?
The levulinic acid market size is 23.57 kilotons in 2026 and is projected to reach 31.17 kilotons by 2031.
Which application segment dominates demand?
Cosmetics and personal care lead with a 33.78% share because levulinic acid offers clean-label preservation and pH control.
Which production technology holds the largest share?
Acid hydrolysis accounts for 54.03% of the market thanks to mature processes and reliable yields.
Why is Asia-Pacific the fastest-growing region?
Abundant biomass, supportive policy, and expanding chemical infrastructure lift Asia-Pacific to a 6.49% CAGR through 2031.
What restrains faster adoption of levulinic acid?
Higher production costs versus petro-substitutes and limited commercial capacity remain the chief barriers.
Page last updated on:


