LED Phosphors Market Size and Share
Market Overview
| Study Period | 2020 - 2031 |
|---|---|
| Market Size (2026) | USD 0.61 Billion |
| Market Size (2031) | USD 1.02 Billion |
| Growth Rate (2026 - 2031) | 10.83% CAGR |
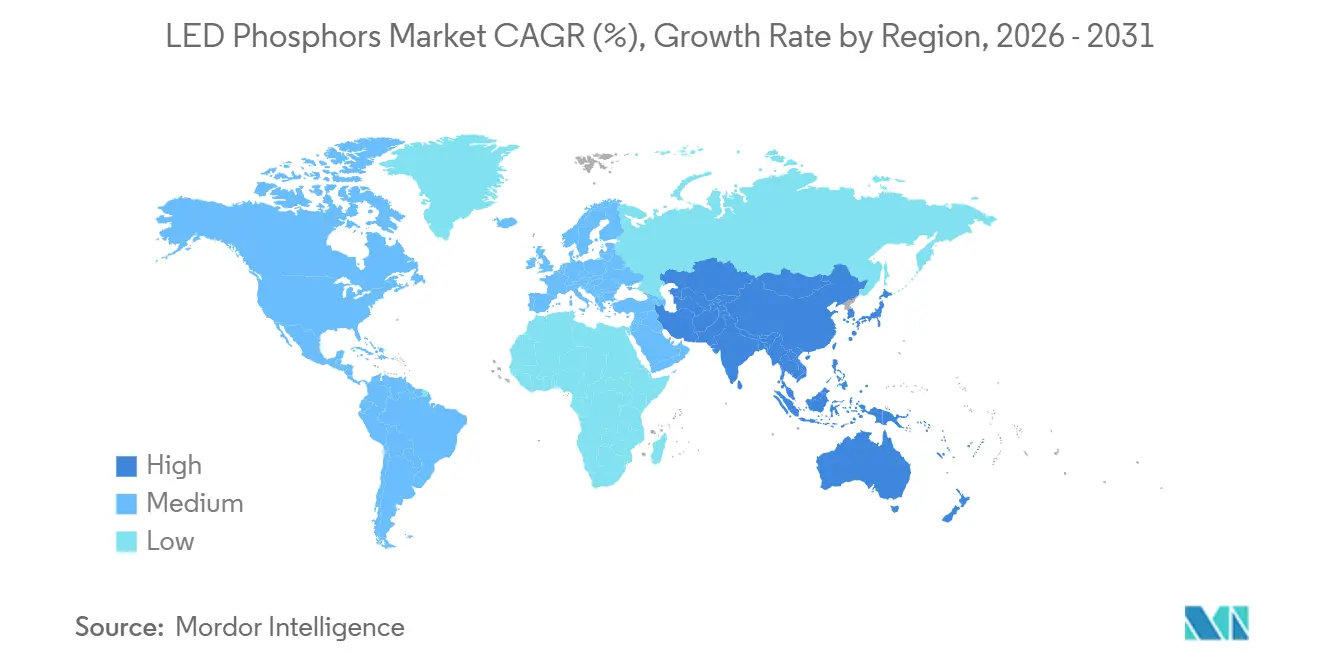
| Fastest Growing Market | Asia Pacific |
| Largest Market | Asia-Pacific |
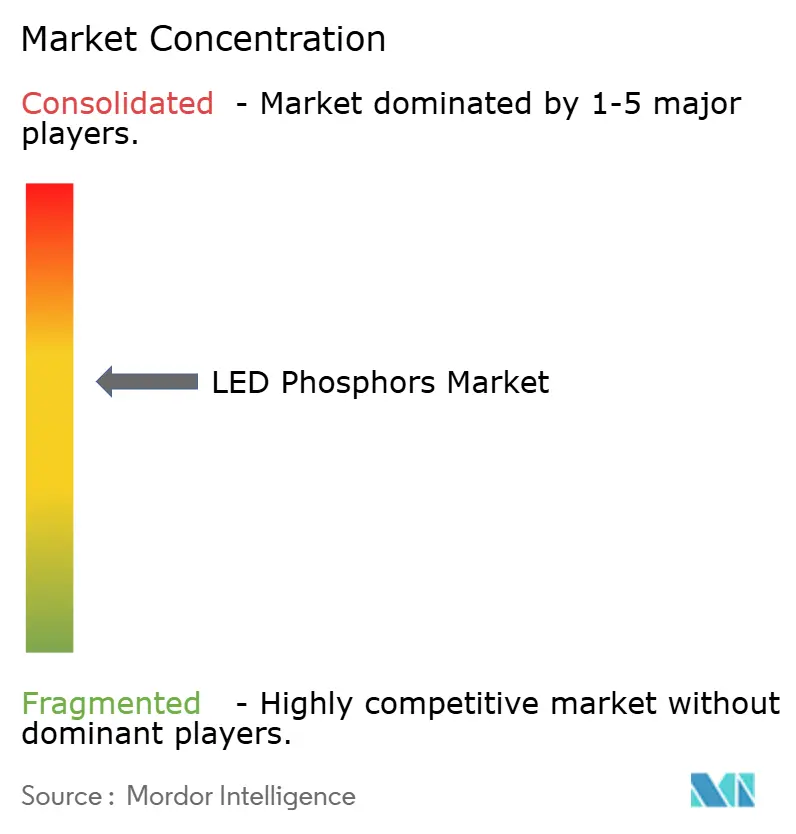
| Market Concentration | Medium |
Major Players *Disclaimer: Major Players sorted in no particular order Image © Mordor Intelligence. Reuse requires attribution under CC BY 4.0. | |
LED Phosphors Market Analysis by Mordor Intelligence
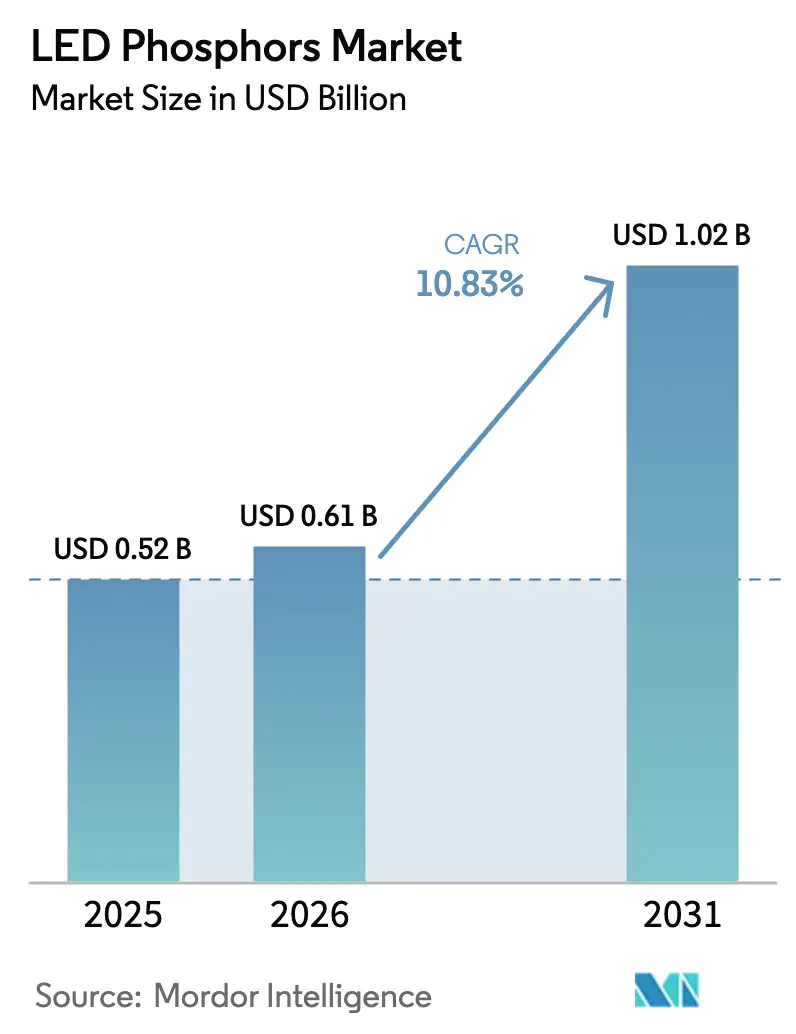
The LED Phosphors Market size is expected to grow from USD 0.52 billion in 2025 to USD 0.61 billion in 2026 and reach USD 1.02 billion by 2031, at a CAGR of 10.83% during the forecast period (2026-2031). Tighter global energy-efficiency regulations, accelerating smart-city rollouts, and the migration of display makers toward mini-LED and micro-LED backlighting continue to enlarge the total addressable demand. Nitride formulations, prized for their thermal stability, are displacing legacy chemistries in high-flux automotive and premium general-lighting packages, while red-emitting blends are gaining traction in horticulture and medical luminaires that require narrow spectral bands. Rare-earth supply risk remains a structural wildcard, yet vertically integrated suppliers in Asia maintain cost advantages by co-locating refining and phosphor synthesis. Across end uses, the LED phosphors market is entering a value-over-volume phase in mature regions as OEMs prioritize color quality, tunability, and smart-control compatibility.
Key Report Takeaways
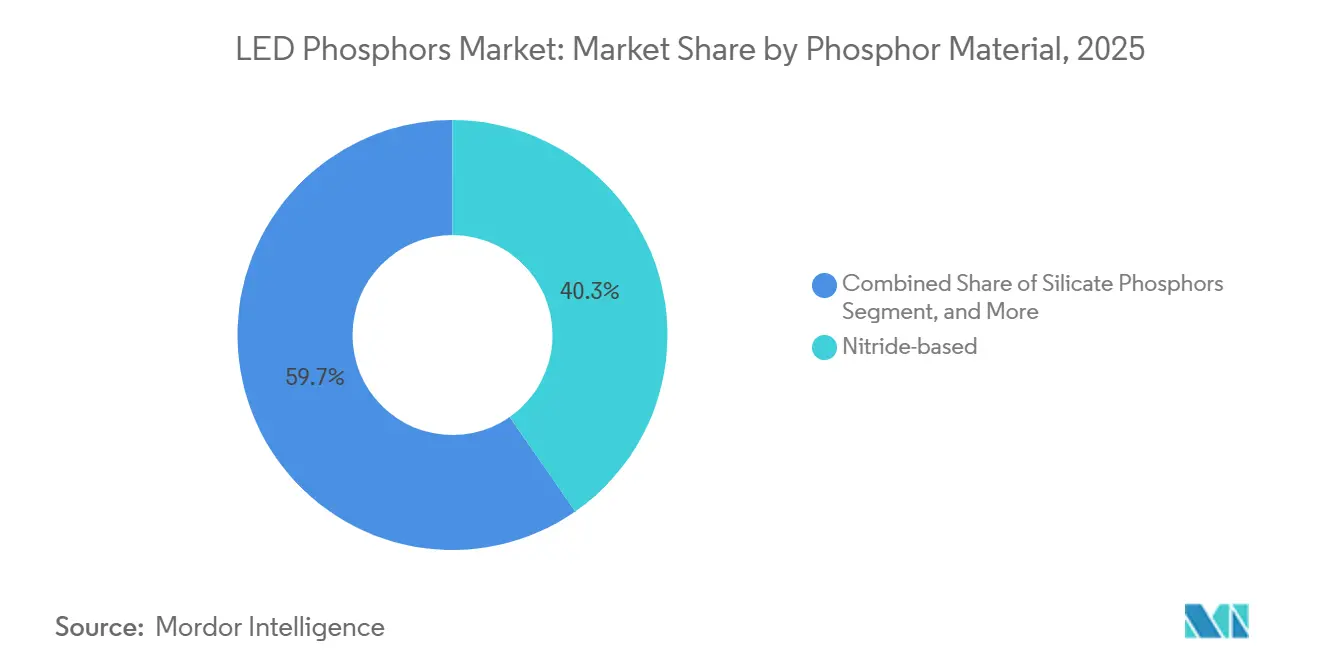
- By phosphor material, nitride chemistries led with 40.32% of LED phosphors market share in 2025, while nitride chemistries are advancing at an 11.01% CAGR through 2031.
- By emission color, warm white commanded 36.81% of LED phosphors market size in 2025, while red phosphors are advancing at an 11.92% CAGR through 2031.
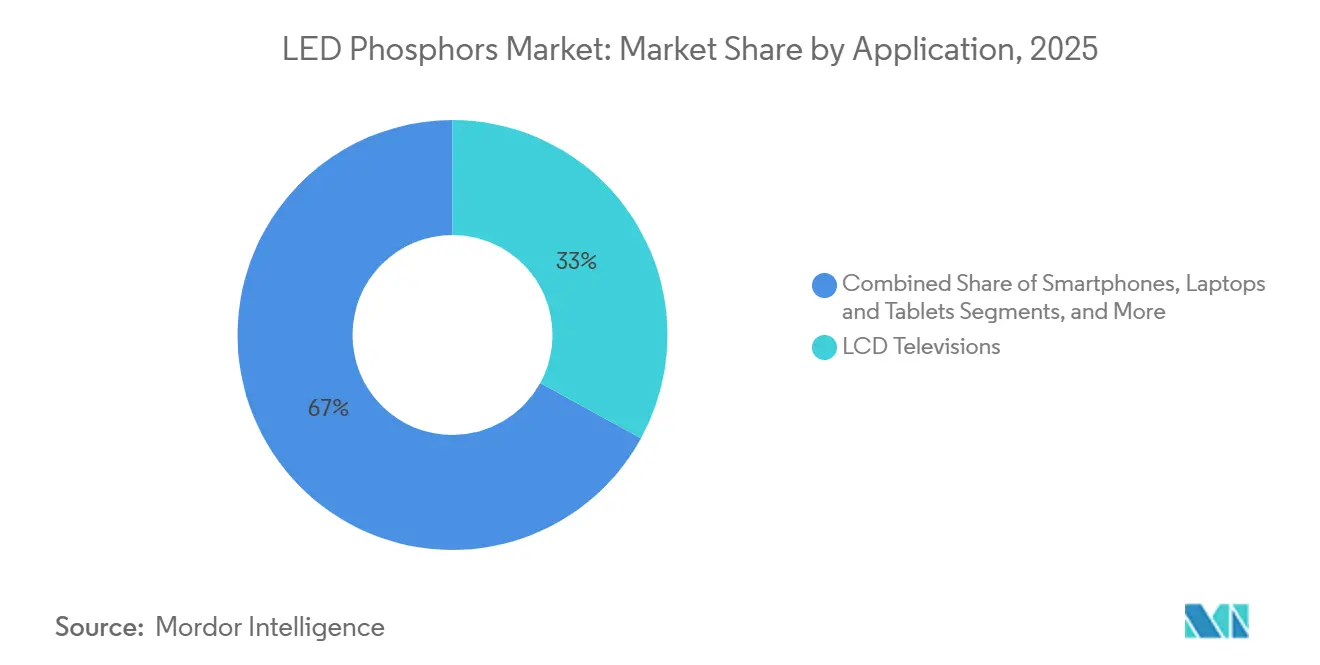
- By application, LCD televisions led with 32.98% of LED phosphors market in 2025, horticulture and medical lighting are increasing at a 12.52% CAGR between 2026-2031.
- By end-use industry, consumer electronics OEMs accounted for 43.44% of LED phosphors market size in 2025, while specialty and medical device manufacturers are advancing at a 12.01% CAGR through 2031.
- By geography, Asia Pacific captured 51.07% of LED phosphors market share in 2025 and is forecast to expand at a 13.09% CAGR through 2031.
Note: Market size and forecast figures in this report are generated using Mordor Intelligence’s proprietary estimation framework, updated with the latest available data and insights as of January 2026.
Global LED Phosphors Market Trends and Insights
Drivers Impact Analysis*
| Driver | (~)% Impact on CAGR Forecast | Geographic Relevance | Impact Timeline |
|---|---|---|---|
| Surge in global smart-lighting deployments | +2.3% | North America, Europe, Asia Pacific urban corridors | Medium term (2-4 years) |
| Government energy-efficiency mandates for solid-state lighting | +2.1% | Global | Short term (≤ 2 years) |
| Rapid cost reduction in high-lumen LED packages | +1.8% | Asia Pacific hubs, spill-over to North America and Europe | Medium term (2-4 years) |
| Expanding display-panel production capacities in Asia | +1.9% | China, South Korea, Taiwan | Medium term (2-4 years) |
| OEM demand for circadian-tunable phosphor blends | +1.4% | North America and Europe | Long term (≥ 4 years) |
| Quantum-dot/LED phosphor hybrid solutions gaining traction | +1.6% | Global | Long term (≥ 4 years) |
| Source: Mordor Intelligence | |||


Surge in Global Smart-Lighting Deployments
Municipal retrofits from high-pressure sodium to connected LED arrays are amplifying orders for multi-phosphor blends capable of delivering correlated color temperatures spanning 2 700 K-6 500 K while supporting dim-to-warm control algorithms. North American cities installed more than 8.5 million smart streetlight nodes in 2024, a 34% year-over-year increase, and similar initiatives are scaling across Europe and Asia Pacific. These projects elevate demand for phosphors with low thermal drift and tight binning tolerances, attributes now embedded into most public tender specifications. Smart-building upgrades add further pull, with intelligent lighting controls expected to cut global lighting electricity use 19% by 2030.[1]International Energy Agency, “Energy Efficiency 2025,” iea.org As ultraviolet disinfection modules become standard in healthcare and hospitality fixtures, inventories of UV-capable phosphors have tightened, reinforcing a favorable price trend for niche suppliers.
Government Energy-Efficiency Mandates for Solid-State Lighting
Standards adopted in the United States, Europe, and China since 2024 require efficacy levels that only high-conversion phosphor systems can deliver. The U.S. floor for commercial luminaires moved to 150 lm/W in January 2025, pushing OEMs toward YAG:Ce and nitride red blends that minimize Stokes losses. Europe’s updated Ecodesign rules added color-quality metrics, effectively sidelining low-CRI phosphor mixes, while China linked subsidies to 180 lm/W thresholds, accelerating demand for narrow-band green and red emitters. Collectively, these mandates compress the addressable space for low-performance chemistries and accelerate the LED phosphors market shift toward premium formulations.
Expanding Display-Panel Production Capacities in Asia
New Gen 8-plus fabs in China and South Korea are ramping mini-LED backlight output, each premium television incorporating up to 20,000 LED chips and adjacent phosphor or quantum-dot films. LG Display earmarked KRW 3.2 trillion (USD 2.4 billion) to scale mini-LED and micro-LED lines by 2027, creating long-term anchor contracts for phosphor suppliers able to guarantee sub-1 nm wavelength variation and superior thermal stability. These capacity additions underpin double-digit volume growth for the LED phosphors market despite maturing handset sales elsewhere.
Quantum-Dot/LED Phosphor Hybrid Solutions Gaining Traction
Indium-phosphide quantum dots layered over conventional phosphor films now deliver ≥100% DCI-P3 color gamut with improved heat tolerance. Automotive head-up displays and professional monitors are early beneficiaries, while reductions in blue-light hazard of nearly 18% compared with pure phosphor systems strengthen the technology’s safety proposition. Module suppliers shipped more than 2 million hybrid units to European automakers in 2024, a trend that signals durable long-cycle pull for specialty red and green phosphors tailored to partner with quantum-dot spectra.
Restraint Impact Analysis*
| Restraint | (~)% Impact on CAGR Forecast | Geographic Relevance | Impact Timeline |
|---|---|---|---|
| Volatility in rare-earth oxide supply and pricing | -1.7% | Global, acute in North America and Europe | Short term (≤ 2 years) |
| High cost of high-CRI narrow-band red phosphors | -1.3% | Global | Medium term (2-4 years) |
| Thermal-quenching limits at high drive currents | -0.9% | Global | Long term (≥ 4 years) |
| Stricter RoHS directives curbing legacy chemistries | -0.8% | Europe and North America | Short term (≤ 2 years) |
| Source: Mordor Intelligence | |||
Volatility in Rare-Earth Oxide Supply and Pricing
China supplied 70% of global rare-earth output and more than 90% of refining volume in 2024, a concentration that enabled export quotas to lift europium oxide spot prices 22% in early 2025. Phosphor makers outside Asia absorbed raw-material cost spikes that narrowed margins or forced reformulations with inferior CRI. Although new Australian and U.S. refining projects are scheduled for full capacity by late 2026, combined output covers less than 8% of forecast demand, leaving the LED phosphors market exposed to geopolitical shocks.
High Cost of High-CRI Narrow-Band Red Phosphors
Nitride-based red phosphors such as (Ca,Sr)AlSiN₃:Eu²⁺ cost roughly USD 180 per kg, quadruple broad-band garnet alternatives, due to high-temperature, high-pressure synthesis and lower quantum efficiencies. Manufacturers therefore load more material to reach target lumens, inflating bill-of-materials costs and restraining penetration in budget lighting lines.[2]Illuminating Engineering Society, “TM-30-24: Color Quality Metrics,” ies.org Manganese-activated fluoride candidates promise lower synthesis temperatures but require hermetic packaging that re-introduces cost penalties, keeping the affordability gap wide at least through mid-forecast.
*Our forecasts treat driver/restraint impacts as directional, not additive. The impact forecasts reflect baseline growth, mix effects, and variable interactions.
Segment Analysis
By Phosphor Material: Nitride Chemistries Anchor High-Performance Tiers
Nitride materials controlled 40.32% of LED phosphors market share in 2025 and are projected to register an 11.01% CAGR through 2031. The LED phosphors market size for nitride blends is expanding on the back of adaptive-driving-beam headlamps and premium indoor fixtures that demand tight wavelength stability at junction temperatures above 150 °C. Garnet YAG:Ce remains dominant in cost-sensitive lamps thanks to mature high-yield processes and quantum efficiencies exceeding 85%.
Process innovations that shrink particle-size distributions and integrate phosphor-on-chip deposition enable brighter, thinner mini-LED packages, widening the application envelope. RoHS cadmium caps enacted in Europe during 2024 pushed OEMs to migrate from older silicate reds toward cadmium-free nitride equivalents despite higher costs, reinforcing nitride leadership across cross-border product lines.


By Emission Color: Red Phosphors Outpace Warm White in Growth
Warm white blends held 36.81% of 2025 shipments, mirroring their ubiquity in residential and office lighting. However, red phosphors are forecast to expand at an 11.92% CAGR as controlled-environment agriculture and medical phototherapy specify narrow-band emissions between 600 nm and 700 nm to boost biological efficacy. The LED phosphors market size linked to red products is therefore set to grow faster than any other color segment.
Indoor farms, which added 28% more square footage between 2020 and 2024, are shifting toward spectra-optimized fixtures that elevate photosynthetic photon flux density per watt.[3]U.S. Department of Agriculture, “Census of Horticulture Specialties 2024,” nass.usda.gov In human-centric lighting, tunable white engines blend warm and cool packages alongside red boosts to emulate daylight rhythms; CRI levels above 95 across a 2 700 K–6 500 K range are now commercial reality, underlining the revenue upside for specialty red suppliers.
By Application: Horticulture and Medical Lighting Surge Ahead
LCD TVs captured 32.98% of 2025 value, yet horticulture and medical installations represent the fastest-growing slice of the LED phosphors market at a 12.52% CAGR to 2031. Tailored red-and-blue arrays help vertical farms cut HVAC loads while maximizing yield, shifting demand from commodity warm white mixes toward higher-margin spectra-tuned formulations.
Medical device clearances for LED-based phototherapy climbed 37% between 2022 and 2024 (fda.gov), spurring purchases of precise blue phosphors that sustain 450 nm–470 nm peaks under thermal stress. Automotive adaptive-driving-beam systems add further upside by embedding dozens of high-flux phosphor-coated LEDs per module, locking in multiyear supply commitments at premium pricing.
By End-Use Industry: Specialty and Medical Device Makers Lead Growth
Consumer electronics OEMs absorbed 43.44% of LED phosphors market size in 2025, yet specialty and medical device manufacturers are tracking a 12.01% CAGR through 2031 as they chase high-margin, performance-critical niches. Surgical luminaires, endoscopy probes, and diagnostic systems now specify CRI no less than 95, pushing adoption of nitride reds and high-purity blues.
Automotive OEMs enlarge their per-vehicle spend by moving from dual-pixel to matrix headlamps with up to 100 addressable zones, each requiring rugged phosphor layers that withstand vibration and 150 °C junction temperatures. Lighting fixture brands facing rare-earth volatility are rationalizing supplier rosters, often awarding multi-year exclusivity to vendors offering integrated refining or recycling capabilities, a trend that cements share for entrenched players.
Geography Analysis
Asia Pacific accounted for 51.07% of 2025 revenues and will expand at a 13.09% CAGR, reinforcing its status as the epicenter of LED and display manufacturing. Cost advantages stem from co-locating rare-earth refining and phosphor synthesis, with Chinese producers paying USD 340 per kg for europium oxide versus USD 465 per kg for North American importers.[4]China Rare Earth Industry Association, “Market Report January 2025,” cre.net.cn The LED phosphors market size in South Korea is poised to double by 2028 as mini-LED backlight ramps at LG Display and Samsung Display absorb incremental tonnage.
Japan leverages longstanding materials science depth to supply ultra-narrow nitride reds for automotive and premium lighting niches, commanding price premiums but limited volume. North America and Europe show slower unit growth yet richer mix, driven by mandates that phase out sub-150 lm/W luminaires. Both regions champion recycling to mitigate supply risk; the European Critical Raw Materials Act targets recovering 25% of rare-earth content from discarded lamps by 2030.
Emerging markets in the Middle East and Africa, alongside pockets of South America, add incremental volume via large-scale street-lighting and infrastructure retrofits. The United Arab Emirates completed LED upgrades on 1.2 million streetlights in 2025, trimming municipal energy use by 42%. Import tariffs and logistics complexity still temper Latin American uptake, but incentive programs in Brazil and Argentina are narrowing the affordability gap.

Competitive Landscape
The five largest suppliers - Nichia, Intematix, Denka, Mitsubishi Chemical, and Lumileds - hold an estimated majority of global revenue, indicating moderate concentration. Vertically integrated Asian players encompass refining, phosphor synthesis, and LED packaging, dampening raw-material risk and preserving margin. Nichia alone holds more than 1,200 phosphor-related patents, erecting formidable intellectual property barriers.
Smaller specialists such as PhosphorTech and Luming Technology monetize agility in custom red and UV blends for horticulture and medical equipment, while quantum-dot leaders like Nanosys and Samsung’s QD division encroach on traditional phosphor share in premium displays. White-space opportunities are emerging in rare-earth recycling, such as Merck achieved a 78% europium recovery rate in a 2024 pilot, though collection logistics remain a challenge for commercial-scale operations.
R&D momentum centers on thermal-management coatings and phosphor-on-chip processes that curb thermal quenching, as evidenced by 142 U.S. patents granted in 2024, up 34% year on year. Automotive OEMs continue to pay 3-4x commodity pricing for proven high-reliability nitride reds, reinforcing a bifurcated market where commodity garnet trades on price and premium nitride sells on performance.
LED Phosphors Industry Leaders
Intematix Corporation
Denka Co. Ltd
Nichia Corporation
Mitsubishi Chemical Group Corporation
Lumileds Holding B.V.
- *Disclaimer: Major Players sorted in no particular order

Recent Industry Developments
- January 2025: Nichia Corporation completed a JPY 18 billion (USD 120 million) expansion at its Anan plant, lifting nitride output 35% and adding closed-loop europium recycling.
- December 2024: Lumileds signed a USD 200 million, five-year deal to supply BOE with phosphor-on-glass films for mini-LED TVs, with localized Chinese production set for Q3 2025.
- November 2024: Seoul Semiconductor launched SunLike 4, a four-phosphor platform achieving CRI 98 and a circadian action factor of 0.42 for tunable white.
- October 2024: Intematix and Nanosys began co-developing cadmium-free quantum-dot/phosphor hybrids for automotive head-up displays targeting 110% DCI-P3 coverage.


Global LED Phosphors Market Report Scope
The LED Phosphors Market Report is Segmented by Phosphor Material (Nitride-based, Garnet (YAG:Ce), Silicate, Aluminate, Others), Emission Color (Cool White, Warm White, Red, Green, Blue, Ultraviolet), Application (Smartphones, LCD Televisions, Laptops and Tablets, Automotive Lighting, General Lighting, Horticulture and Medical Lighting, Other Applications), End-Use Industry (Consumer Electronics OEMs, Automotive OEMs, Display Panel Manufacturers, Lighting Fixture Manufacturers, Specialty and Medical Device Manufacturers), and Geography (North America, South America, Europe, Asia-Pacific, Middle East, Africa). The Market Forecasts are Provided in Terms of Value (USD).
| Nitride-based Phosphors |
| Garnet (YAG:Ce) Phosphors |
| Silicate Phosphors |
| Aluminate Phosphors |
| Other Phosphor Materials |
| Cool White |
| Warm White |
| Red |
| Green |
| Blue |
| Ultraviolet |
| Smartphones |
| LCD Televisions |
| Laptops and Tablets |
| Automotive Lighting |
| General Lighting (Residential, Commercial, Industrial) |
| Horticulture and Medical Lighting |
| Other Applications |
| Consumer Electronics OEMs |
| Automotive OEMs |
| Display Panel Manufacturers |
| Lighting Fixture Manufacturers |
| Specialty and Medical Device Manufacturers |
| North America | United States |
| Canada | |
| Mexico | |
| South America | Brazil |
| Argentina | |
| Rest of South America | |
| Europe | Germany |
| United Kingdom | |
| France | |
| Italy | |
| Spain | |
| Rest of Europe | |
| Asia-Pacific | China |
| Japan | |
| India | |
| South Korea | |
| ASEAN | |
| Rest of Asia-Pacific | |
| Middle East | Saudi Arabia |
| United Arab Emirates | |
| Rest of Middle East | |
| Africa | South Africa |
| Nigeria | |
| Rest of Africa |
| By Phosphor Material | Nitride-based Phosphors | |
| Garnet (YAG:Ce) Phosphors | ||
| Silicate Phosphors | ||
| Aluminate Phosphors | ||
| Other Phosphor Materials | ||
| By Emission Color | Cool White | |
| Warm White | ||
| Red | ||
| Green | ||
| Blue | ||
| Ultraviolet | ||
| By Application | Smartphones | |
| LCD Televisions | ||
| Laptops and Tablets | ||
| Automotive Lighting | ||
| General Lighting (Residential, Commercial, Industrial) | ||
| Horticulture and Medical Lighting | ||
| Other Applications | ||
| By End-Use Industry | Consumer Electronics OEMs | |
| Automotive OEMs | ||
| Display Panel Manufacturers | ||
| Lighting Fixture Manufacturers | ||
| Specialty and Medical Device Manufacturers | ||
| By Geography | North America | United States |
| Canada | ||
| Mexico | ||
| South America | Brazil | |
| Argentina | ||
| Rest of South America | ||
| Europe | Germany | |
| United Kingdom | ||
| France | ||
| Italy | ||
| Spain | ||
| Rest of Europe | ||
| Asia-Pacific | China | |
| Japan | ||
| India | ||
| South Korea | ||
| ASEAN | ||
| Rest of Asia-Pacific | ||
| Middle East | Saudi Arabia | |
| United Arab Emirates | ||
| Rest of Middle East | ||
| Africa | South Africa | |
| Nigeria | ||
| Rest of Africa | ||


Key Questions Answered in the Report
What are the primary growth drivers for LED phosphors through 2031?
Stricter global energy-efficiency mandates, expanding smart-lighting projects, and rising mini-LED and micro-LED display output underpin demand.
What is the expected global LED phosphors market size by 2031?
The market is forecast to reach USD 1.02 billion in 2031.
What CAGR is forecast for horticulture and medical lighting applications?
These applications are projected to advance at a 12.52% CAGR from 2026 to 2031, the fastest among all use cases.
Which region will contribute most to incremental demand?
Asia Pacific, already at 51.07% share in 2025, will add the largest volume as display and LED fabs scale, expanding at a 13.09% CAGR.
Which phosphor material is expected to dominate shipments?
Nitride formulations remain in the lead, holding 40.32% share in 2025 and growing at an 11.01% CAGR through 2031.
How will rare-earth supply constraints affect pricing?
China’s export quotas already lifted europium oxide spot prices 22% in early 2025, and limited non-Chinese refining capacity will keep prices volatile until at least 2027.
Page last updated on:


