
Landfill Gas Market Size and Share
Market Overview
| Study Period | 2021 - 2031 |
|---|---|
| Market Size (2026) | USD 4.43 Billion |
| Market Size (2031) | USD 6.41 Billion |
| Growth Rate (2026 - 2031) | 7.67 % |
| Fastest Growing Market | Asia-Pacific |
| Largest Market | North America |
| Market Concentration | Low |
Major Players *Disclaimer: Major Players sorted in no particular order Image © Mordor Intelligence. Reuse requires attribution under CC BY 4.0. | |
Landfill Gas Market Analysis by Mordor Intelligence
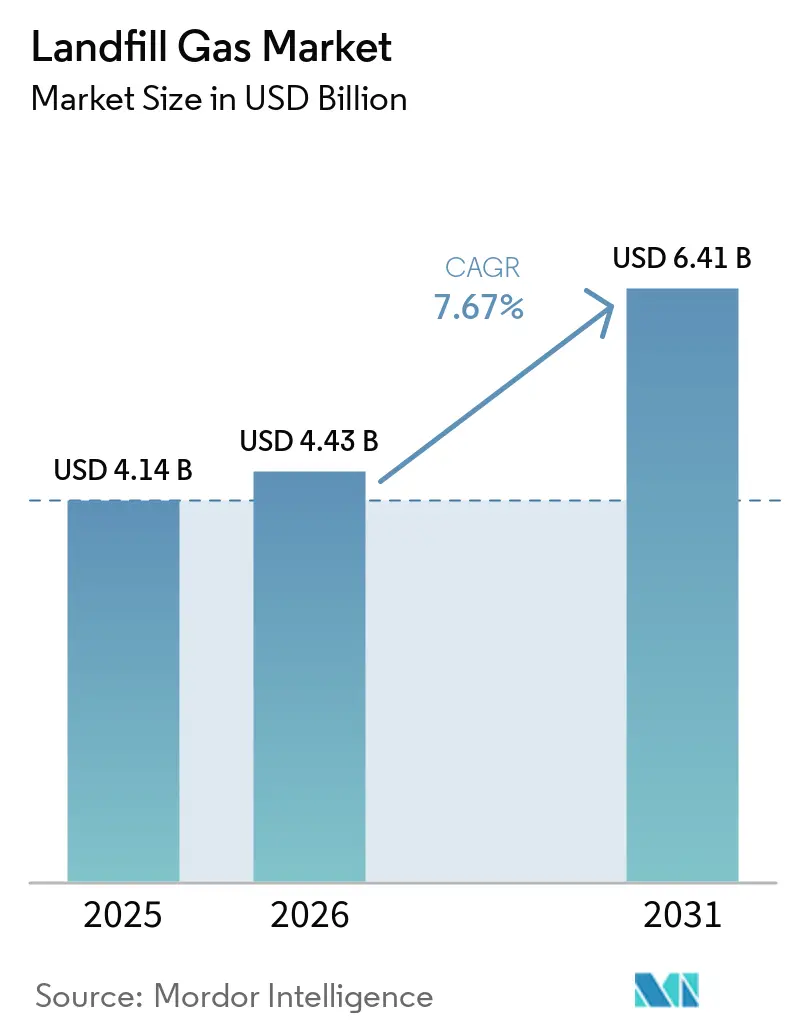
The landfill gas market size was valued at USD 4.14 billion in 2025 and is estimated to grow from USD 4.43 billion in 2026 to reach USD 6.41 billion by 2031, at a CAGR of 7.67% during the forecast period (2026-2031). Methane rules are making gas collection and control systems a required operating investment at regulated landfill sites. The landfill gas market also benefits from renewable natural gas contracts that give developers clearer revenue visibility than short-term energy sales. Digital wellfield controls and more capable upgrading systems are improving methane capture and gas quality at operating facilities. Pipeline access, connection costs, and permitting delays remain major constraints for projects that depend on pipeline injection. Organic waste diversion policies will reduce future gas yields at some mature sites, which will increase the value of sites with strong remaining waste volumes and well-managed collection systems.
Key Report Takeaways
- By technology, collection systems held 47.4% of revenue in 2025, while gas upgrading technologies are forecast to grow at a 9.1% CAGR through 2031.
- By landfill type, municipal solid waste landfills held 73.5% of revenue in 2025, while industrial landfills are forecast to grow at a 9.8% CAGR through 2031.
- By end use, electricity generation held 43.7% of revenue in 2025, while renewable natural gas is forecast to grow at a 10.7% CAGR through 2031.
- By geography, North America held 41.5% of revenue in 2025, while Asia-Pacific is forecast to grow at a 10.5% CAGR through 2031.
Note: Market size and forecast figures in this report are generated using Mordor Intelligence’s proprietary estimation framework, updated with the latest available data and insights as of January 2026.
Global Landfill Gas Market Trends and Insights
Drivers Impact Analysis*
| Driver | % Impact on CAGR Forecast | Geographic Relevance | Impact Timeline |
|---|---|---|---|
| Methane-Emission Compliance and Monitoring | +2.10% | Global; led by US, EU, California | Short term (≤ 2 years) |
| Renewable Natural Gas and Biomethane Offtake Demand | +1.80% | North America (primary), EU (emerging) | Medium term (2–4 years) |
| Government Incentives and Low-Carbon Fuel Credits | +1.40% | US, EU, Canada | Medium term (2–4 years) |
| Expansion of Landfill Gas-to-Energy Infrastructure | +0.90% | Global; APAC, South America | Long term (≥ 4 years) |
| Digital Wellfield Balancing and Remote Leak Detection | +0.70% | North America, EU | Medium term (2–4 years) |
| Increasing Demand for Local Baseload Renewable Energy | +0.60% | North America, APAC | Long term (≥ 4 years) |
| Source: Mordor Intelligence | |||
Methane-Emission Compliance and Monitoring
Municipal solid waste landfills were the third-largest source of methane emissions in the United States, keeping compliance spending high across the operating fleet. The landfill gas market is supported by Clean Air Act rules that require qualifying sites to install gas collection and control systems. Those rules also require quarterly surface monitoring and monthly wellhead checks for temperature, oxygen, nitrogen, and pressure[1]US Environmental Protection Agency, “Enforcement Alert: EPA Finds MSW Landfills Are Violating Monitoring and Maintenance Requirements,” US Environmental Protection Agency, epa.gov.. In October 2024, the EPA opened a docket on monitoring technologies and work practices for municipal solid waste landfills. The European Union methane regulation, which entered into force on August 4, 2024, established measurement, monitoring, reporting, and verification obligations in the energy sector. These rules create recurring demand for collection, monitoring, maintenance, and upgrade work even when energy prices are weak.
Renewable Natural Gas and Biomethane Offtake Demand
The landfill gas market is gaining support from long-term renewable natural gas offtake agreements. These agreements can give project owners a more stable basis for financing than short-term carbon credit sales. The American Biogas Council reported that 68 of 70 new United States biogas projects commissioned in 2025 were designed to produce renewable natural gas. Landfill-sourced gas supplied 64% of the United States renewable natural gas production reported in 2025. Industrial users in chemicals, food processing, and manufacturing are also considering renewable gas for process heat and internal emissions programs. This wider group of buyers can extend contract demand beyond transportation fuel applications.
Government Incentives and Low-Carbon Fuel Credits
The landfill gas market benefits from tax-credit frameworks that support renewable gas and qualifying low-emissions electricity projects. Proposed regulations issued in February 2026 state that producers delivering pipeline-quality renewable natural gas can qualify as eligible producers under Section 45Z[2]Federal Register, “Clean Fuel Production Credits Proposed Regulations,” Federal Register, govinfo.gov.. This clarification gives developers a firmer basis for assessing projects that inject upgraded gas into pipelines. European policy also supports biomethane expansion through the REPowerEU target for 35 billion cubic meters of sustainable biomethane by 2030[3]European Biogas Association, “Decoding Biogases 2026,” European Biogas Association, europeanbiogas.eu.. Credit values differ by feedstock and carbon intensity, so project owners must consider feedstock quality when comparing renewable gas and electricity options. The landfill gas market therefore rewards developers that can combine gas quality management, verified emissions performance, and durable offtake arrangements.
Digital Wellfield Balancing and Remote Leak Detection
Digital controls are changing how operators manage gas quality and capture at active landfill sites. At Mesa County Landfill, the Meerkat System tested hourly sampling of methane, carbon dioxide, oxygen, temperature, pressure, and flow beginning in October 2025. A January 2025 proposal submitted to the South Coast AQMD described a remote monitoring pilot at Chiquita Canyon Landfill using cellular devices and a cloud-based SCADA platform[4]South Coast Air Quality Management District, “Chiquita Canyon Landfill Automated Remote Monitoring Pilot Proposal,” South Coast Air Quality Management District, aqmd.gov.. The landfill gas market can benefit when continuous readings allow operators to respond to pressure, oxygen, or flow changes before collection efficiency falls. Better wellfield balancing can also reduce emissions-related compliance risks. These systems are becoming more relevant where operators need evidence of gas capture performance for contracts and regulators.
Restraints Impact Analysis*
| Restraint | % Impact on CAGR Forecast | Geographic Relevance | Impact Timeline |
|---|---|---|---|
| High Capital Cost and Interconnection Delays | -1.60% | North America, EU | Short term (≤ 2 years) |
| Declining Gas Yield at Mature Landfills | -0.90% | Global; particularly North America, EU | Medium term (2–4 years) |
| Nitrogen and Oxygen Removal Challenges in Landfill Gas Upgrading | -0.60% | Global | Medium term (2–4 years) |
| Organic-Waste Diversion Reducing Future Landfill Feedstock | -1.00% | EU, North America | Long term (≥ 4 years) |
| Source: Mordor Intelligence | |||
High Capital Cost and Interconnection Delays
Pipeline interconnection can absorb 30-45% of a renewable natural gas project budget and can require 24-36 months in some jurisdictions. The landfill gas market faces this constraint most directly when a project needs transmission or distribution pipeline access. A 2025 presentation for the Short Mountain project in Oregon showed potential interconnection costs from USD 7.46 million to USD 11.3 million, depending on the configuration and metering requirements. The European Biogas Association reported that cost-sharing practices differ across member states and between transmission and distribution connections. Uncertain costs and long approvals can delay debt commitments and prevent technically viable projects from reaching construction. Developers are therefore placing more value on sites with known connection rights, existing gas infrastructure, or viable local uses for the gas.
Organic-Waste Diversion Reducing Future Landfill Feedstock
Separate collection and diversion of organic waste reduces the biodegradable material delivered to landfill sites over time. The landfill gas market will feel this effect as lower organic input reduces methane generation and shortens the useful life of some collection investments. The EU Landfill Directive limits municipal waste sent to landfill to 10% by 2035, while member-state biowaste collection measures are changing incoming waste streams. EPA material states that expected organics reductions should be reflected in LandGEM forecasts used for system sizing, upgrading throughput, and offtake planning. A 2024 study found that high-diversion scenarios reduced greenhouse gas emissions by 40-72% against baseline cases, with corresponding implications for landfill gas yields. Operators will need to assess remaining waste composition carefully before committing to long-duration projects at mature landfills.
*Our forecasts treat driver/restraint impacts as directional, not additive. The impact forecasts reflect baseline growth, mix effects, and variable interactions.
Segment Analysis
By Technology: Collection Systems Maintain the Largest Revenue Base While Upgrading Expands
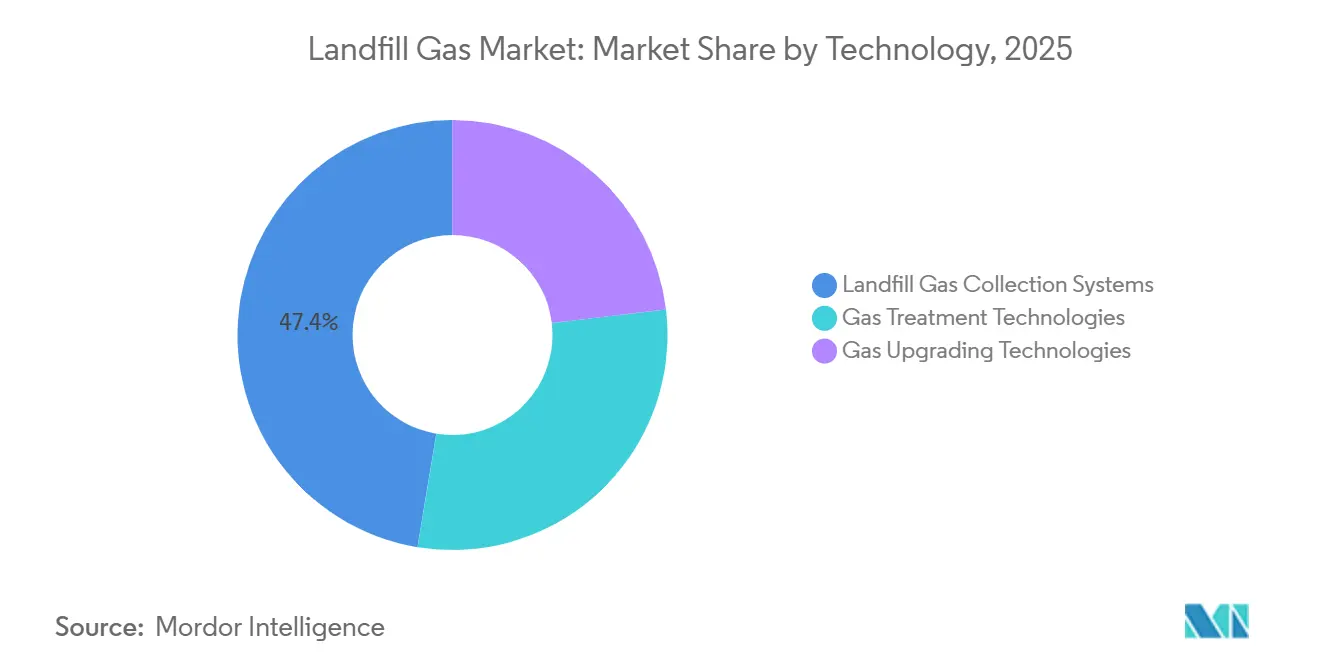
Collection systems held 47.4% of the landfill gas market revenue in 2025. This position reflects requirements for regulated municipal solid waste sites to capture and control landfill gas before it is flared or used. Active systems include extraction wells, high-density polyethylene piping, blower-flare stations, and condensate management equipment. Expansion work continues when landfill cells are added or operating sites need greater coverage. Gas upgrading technologies are forecast to grow at a 9.1% CAGR through 2031.
The landfill gas market size for gas upgrading is supported by renewable natural gas pipeline injection and carbon-intensity-based revenue opportunities. Greenlane Renewables filed a patent application in October 2025 for a Linear Nitrogen Rejection Unit that uses a stepwise pressure swing adsorption process. The company reported methane recovery of up to 99.5% during testing across varying nitrogen-to-methane ratios. A 2025 peer-reviewed study found that a hybrid membrane and vacuum pressure swing adsorption configuration could achieve methane purity of at least 96% and recovery of at least 99% in modeled optimization. These developments matter because landfill gas often presents more difficult nitrogen and oxygen removal conditions than other biogas feedstocks.



By Landfill Type: Municipal Solid Waste Leads Revenue While Industrial Landfills Grow Faster
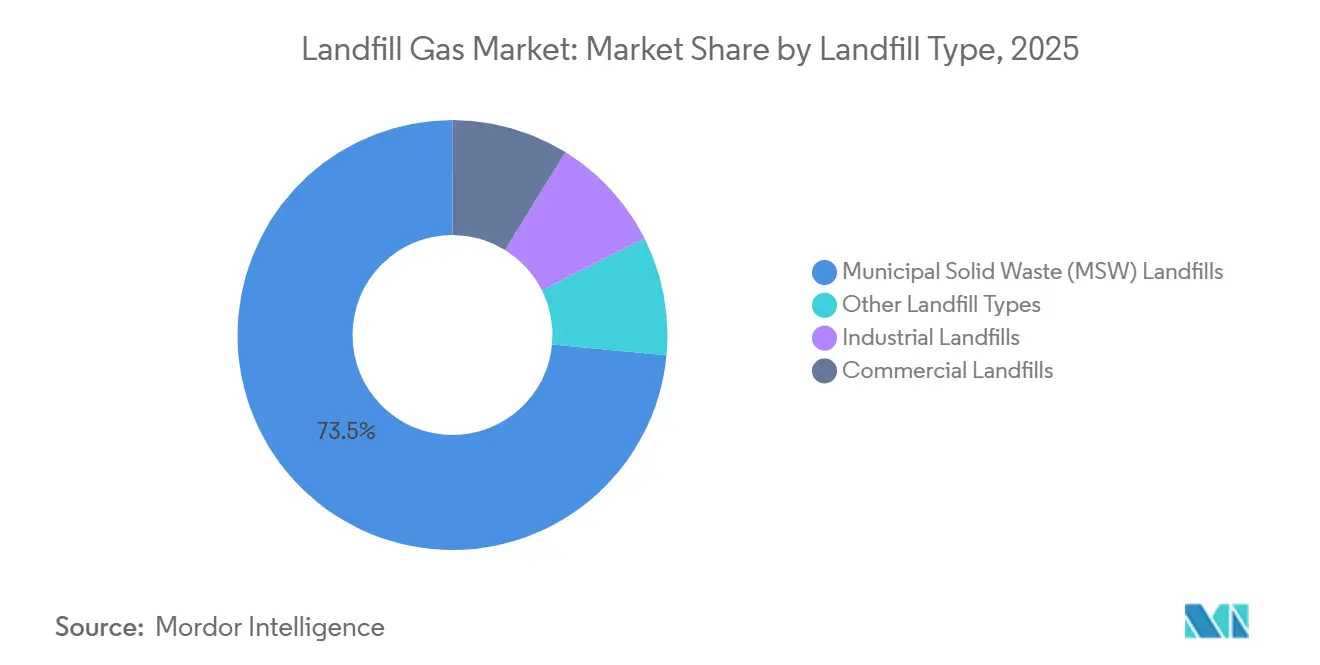
Municipal solid waste landfills accounted for 73.5% of landfill gas market revenue in 2025. Large waste volumes, established collection networks, and regulatory requirements support this position. The EPA Greenhouse Gas Reporting Program applies separate requirements to municipal solid waste landfills that cross defined methane thresholds. American Biogas Council data cited by Greenlane Renewables showed 598 landfill gas capture systems at United States sites in 2025. Industrial landfills are forecast to grow at a 9.8% CAGR through 2031.
The landfill gas market size for industrial landfills is influenced by manufacturing activity, sustainability programs, and expanding reporting obligations. Industrial waste streams differ by sector, so chemical, food-processing, and pulp-and-paper sites need individual gas characterization and collection design. The EPA identifies industrial waste landfills under Subpart TT of the Greenhouse Gas Reporting Program. This regulatory structure can create a compliance investment cycle similar to the earlier development of municipal solid waste systems. Food and beverage operators may also use captured gas as an on-site energy resource that reduces purchases of electricity and natural gas.
By End Use: Electricity Generation Retains Installed Capacity While Renewable Natural Gas Leads New Builds
Electricity generation held 43.7% of the landfill gas market revenue in 2025. The installed base remains significant in the United States, United Kingdom, Germany, and Australia because power generation was once the only widely available commercial pathway. The American Biogas Council reported that 75% of United States biogas projects still used captured gas for renewable electricity in 2025. Existing assets will continue to contribute revenue because generators have long operating lives. Renewable natural gas is forecast to grow at a 10.7% CAGR through 2031.
Renewable natural gas will likely reshape new project decisions because 68 of 70 United States biogas projects commissioned in 2025 targeted this end use. The landfill gas market share of electricity generation remains important, but new projects increasingly pursue pipeline-quality gas. Federal proposed regulations issued in 2026 confirm that qualifying pipeline-quality renewable natural gas producers can be eligible under Section 45Z. Vehicle fuel and pipeline injection are closely connected because renewable identification numbers can increase fuel value. Industrial and commercial buyers may also contract directly for gas when local pipeline access is unavailable or power systems are constrained.
Geography Analysis
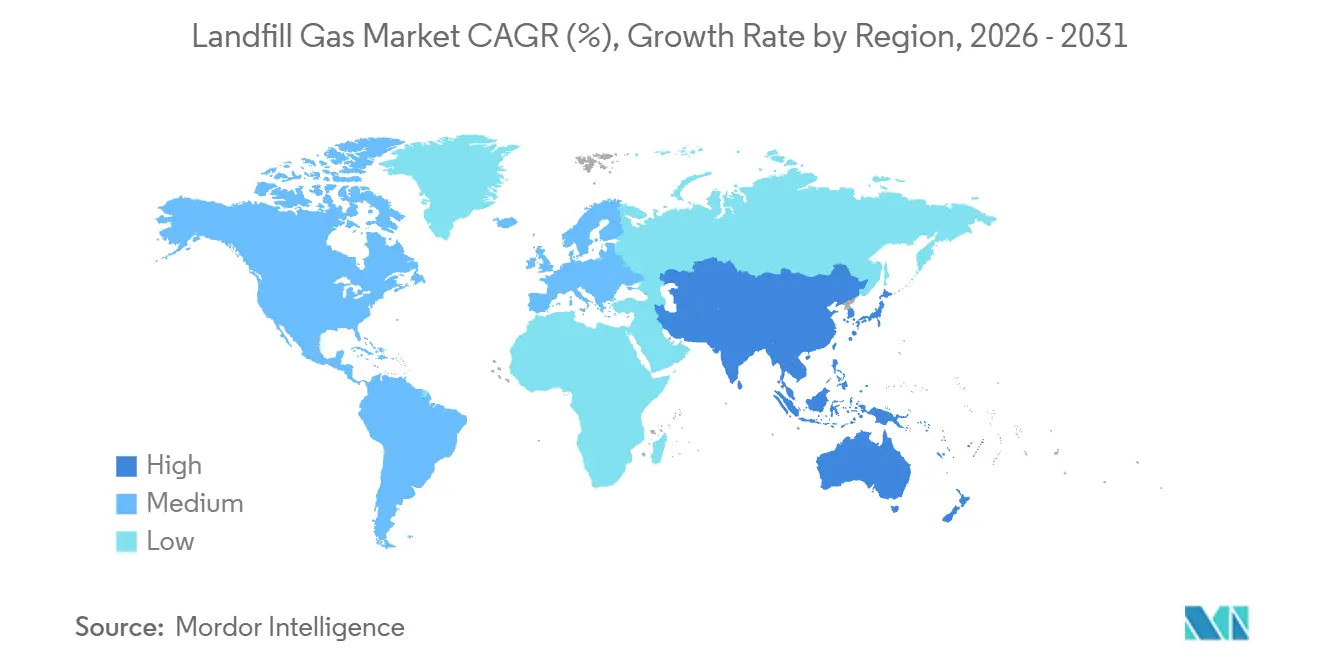
North America held 41.5% of the landfill gas market revenue in 2025. The United States supports this position through a mature collection-system fleet, federal landfill requirements, and active renewable natural gas development. The landfill gas market size in the region is also supported by a listed pipeline of 705 additional candidate United States landfills beyond 599 sites already equipped with capture systems. Canada has a growing opportunity where regulated sites retain suitable municipal solid waste volumes despite organic diversion measures. Europe is the second-largest geography, with Germany holding substantial installed capacity and the United Kingdom retaining an established landfill gas-to-electricity fleet.
Europe had 1,620 biomethane plants in the first quarter of 2025, and 86% were grid-connected. France had the highest plant count, with 760 facilities reported in the same source. Asia-Pacific is forecast to expand at a 10.5% CAGR through 2031. China and India have high-organic-content municipal waste streams that can support large collection systems. China combines waste-sector methane objectives with electricity purchase support and carbon-market mechanisms.
India is adding demand through urban growth, higher organic waste content, and pressure to modernize waste-management infrastructure. South Korea, Vietnam, Indonesia, and Thailand are at earlier stages of collection-system adoption, where electricity sales remain the principal route because pipeline networks are limited. The Middle East and Africa had the smallest share among major geographies, while urban waste growth is creating long-term project interest. Johannesburg began a biodigester pilot at Robinson Deep landfill in September 2026, designed to process 50 tonnes of biodegradable waste each day and scheduled for commissioning in March 2027.

Competitive Landscape
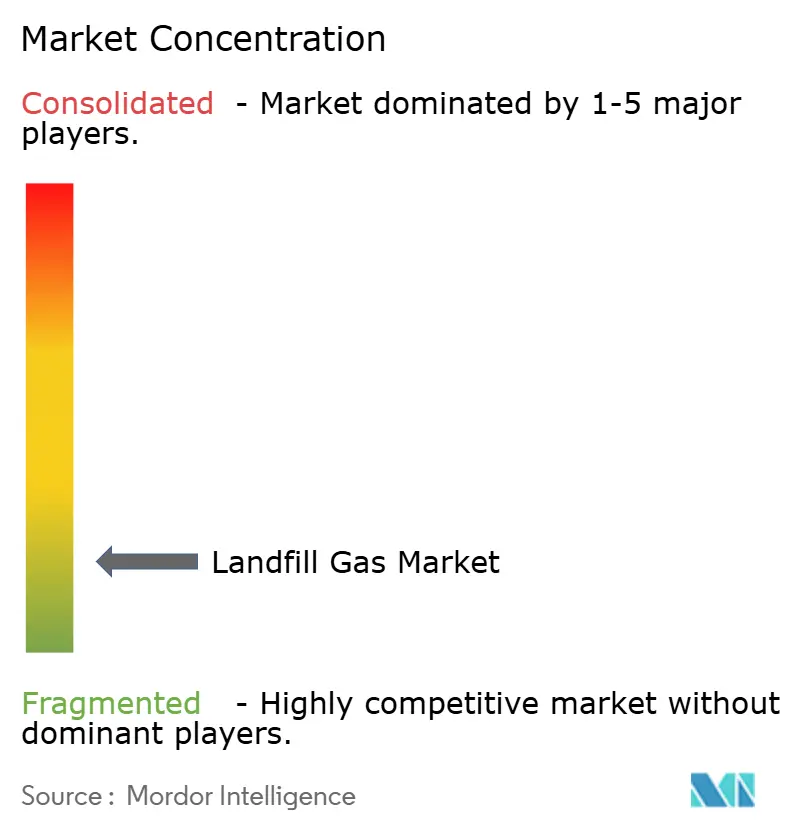
The landfill gas market is fragmented. Large integrated waste companies, including Waste Management, Republic Services, Veolia, and SUEZ, control access to landfill feedstock through their operating networks. Specialist developers and equipment suppliers compete through upgrading technology, modular designs, project financing, and operating capabilities. The landfill gas market has therefore favored partnerships that combine landfill access with technical and financial capacity. Republic Services and Archaea Energy operate the Lightning Renewables joint venture, which targets 40 renewable natural gas projects across Republic Services landfills.
Ameresco and HA Sustainable Infrastructure Capital formed Neogenyx Fuels in May 2026 as a USD 1.8 billion joint venture focused on landfill gas and agricultural renewable natural gas assets. Waga Energy uses a 20-year build-own-operate model based on its WAGABOX technology, which shifts capital and operating responsibilities away from municipal landfill hosts. The landfill gas market rewards this model where a host lacks project-finance expertise or wants to avoid operating a gas-upgrading facility. Greenlane Renewables is focusing on nitrogen and oxygen removal technologies that address a central obstacle to pipeline-quality landfill gas. Its 2025 Linear Nitrogen Rejection Unit filing reported up to 99.5% methane recovery in testing.
The landfill gas market still has opportunities at candidate landfills that lack collection or upgrading assets. Standardized equipment and modular construction can improve a developer’s ability to move from site assessment to gas production. Remote monitoring systems are also becoming relevant in gas purchase agreement bids because capture efficiency affects operating costs and contracted volumes. Smaller developers without proprietary technology face stronger competition from integrated platform operators.
Landfill Gas Industry Leaders
Waste Management, Inc.
Veolia Environnement S.A.
SUEZ
Ameresco, Inc.
Montauk Renewables, Inc.
- *Disclaimer: Major Players sorted in no particular order

Recent Industry Developments
- September 2026: Casella Waste Systems and Waga Energy commenced operations at the McKean Landfill renewable natural gas facility in Mount Jewett, Pennsylvania. The facility processes up to 2,000 scfm of landfill gas and has completed the 3-project program established under their 2023 partnership.
- August 2026: Casella Waste Systems and Waga Energy inaugurated the Hyland Landfill renewable natural gas facility in Angelica, New York. It has 3,000 scfm of installed processing capacity and can generate up to 610,000 MMBtu of renewable gas each year.
- July 2026: Randolph County, North Carolina, selected Waga Energy to build, own, and operate a renewable natural gas facility at Great Oak Landfill. The project will process up to 3,000 scfm under a long-term agreement.
- June 2026: Archaea Energy and Republic Services opened the first Lightning Renewables plant in Fort Wayne, Indiana. The facility can process up to 6,400 scfm with a modular skid-based design.


Global Landfill Gas Market Report Scope
Landfill gas (LFG) is a mixture of gases produced when organic waste decomposes under anaerobic (oxygen-free) conditions in landfills. It primarily consists of methane (CH₄) and carbon dioxide (CO₂), along with small amounts of nitrogen, oxygen, hydrogen sulfide, and other trace gases. Landfill gas can be captured and treated for electricity generation, heating, or upgrading into renewable natural gas (RNG). Its collection also helps reduce methane emissions and odors from landfills.
The Landfill Gas Market is segmented by technology, landfill type, end use, and geography. By technology, the market is segmented into collection systems, gas treatment, and gas upgrading. By landfill type, the market is segmented into municipal solid waste (MSW) landfills, industrial landfills, commercial landfills, and other landfill types. By end use, the market is segmented into electricity generation, direct thermal, renewable natural gas (RNG), vehicle fuel, pipeline injection, combined heat and power (CHP), and industrial/commercial applications. The report also covers the market size and forecasts for the global landfill gas market across 26 countries in major regions. For each segment, the market sizing and forecasts have been provided on the basis of value (USD).
| Landfill Gas Collection Systems |
| Gas Treatment Technologies |
| Gas Upgrading Technologies |
| Municipal Solid Waste (MSW) Landfills |
| Industrial Landfills |
| Commercial Landfills |
| Other Landfill Types |
| Electricity Generation |
| Direct Thermal/Medium-Btu Gas Use |
| Renewable Natural Gas (RNG) |
| Vehicle Fuel |
| Pipeline Injection |
| Combined Heat and Power |
| Industrial and Commercial Applications |
| North America | United States |
| Canada | |
| Mexico | |
| Europe | Germany |
| France | |
| Italy | |
| Spain | |
| United Kingdom | |
| Poland | |
| Russia | |
| Rest of Europe | |
| Asia-Pacific | China |
| India | |
| Japan | |
| South Korea | |
| Australia | |
| Indonesia | |
| Vietnam | |
| Thailand | |
| Rest of Asia-Pacific | |
| South America | Brazil |
| Argentina | |
| Chile | |
| Rest of South America | |
| Middle East and Africa | Saudi Arabia |
| United Arab Emirates | |
| Egypt | |
| South Africa | |
| Morocco | |
| Rest of Middle East and Africa |
| By Technology | Landfill Gas Collection Systems | |
| Gas Treatment Technologies | ||
| Gas Upgrading Technologies | ||
| By Landfill Type | Municipal Solid Waste (MSW) Landfills | |
| Industrial Landfills | ||
| Commercial Landfills | ||
| Other Landfill Types | ||
| By End Use | Electricity Generation | |
| Direct Thermal/Medium-Btu Gas Use | ||
| Renewable Natural Gas (RNG) | ||
| Vehicle Fuel | ||
| Pipeline Injection | ||
| Combined Heat and Power | ||
| Industrial and Commercial Applications | ||
| By Geography | North America | United States |
| Canada | ||
| Mexico | ||
| Europe | Germany | |
| France | ||
| Italy | ||
| Spain | ||
| United Kingdom | ||
| Poland | ||
| Russia | ||
| Rest of Europe | ||
| Asia-Pacific | China | |
| India | ||
| Japan | ||
| South Korea | ||
| Australia | ||
| Indonesia | ||
| Vietnam | ||
| Thailand | ||
| Rest of Asia-Pacific | ||
| South America | Brazil | |
| Argentina | ||
| Chile | ||
| Rest of South America | ||
| Middle East and Africa | Saudi Arabia | |
| United Arab Emirates | ||
| Egypt | ||
| South Africa | ||
| Morocco | ||
| Rest of Middle East and Africa | ||


Key Questions Answered in the Report
What is driving landfill gas project development through 2031?
Methane compliance rules, renewable natural gas offtake contracts, tax-credit frameworks, and digital wellfield controls are supporting development.
How large is the landfill gas market in 2026?
The landfill gas market was estimated at USD 4.43 billion in 2026 and is forecast to reach USD 6.41 billion by 2031.
Which technology is growing fastest in landfill gas projects?
Gas upgrading technologies are forecast to grow at a 9.1% CAGR through 2031 because developers are pursuing pipeline-quality renewable natural gas.
Why do pipeline connections delay renewable natural gas projects?
Pipeline interconnection can represent 30-45% of project costs and may require 24-36 months in some jurisdictions.
Which landfill type generates the largest revenue base?
Municipal solid waste landfills held 73.5% of revenue in 2025 because of their scale, established assets, and regulatory requirements.
Which region is growing fastest for landfill gas development?
Asia-Pacific is forecast to expand at a 10.5% CAGR through 2031, supported by high-organic-content municipal waste streams and developing waste-to-energy programs.
Page last updated on:


 Your data is secure and never sold or shared.


