K-12 Testing and Assessment Market Size and Share
Market Overview
| Study Period | 2020 - 2031 |
|---|---|
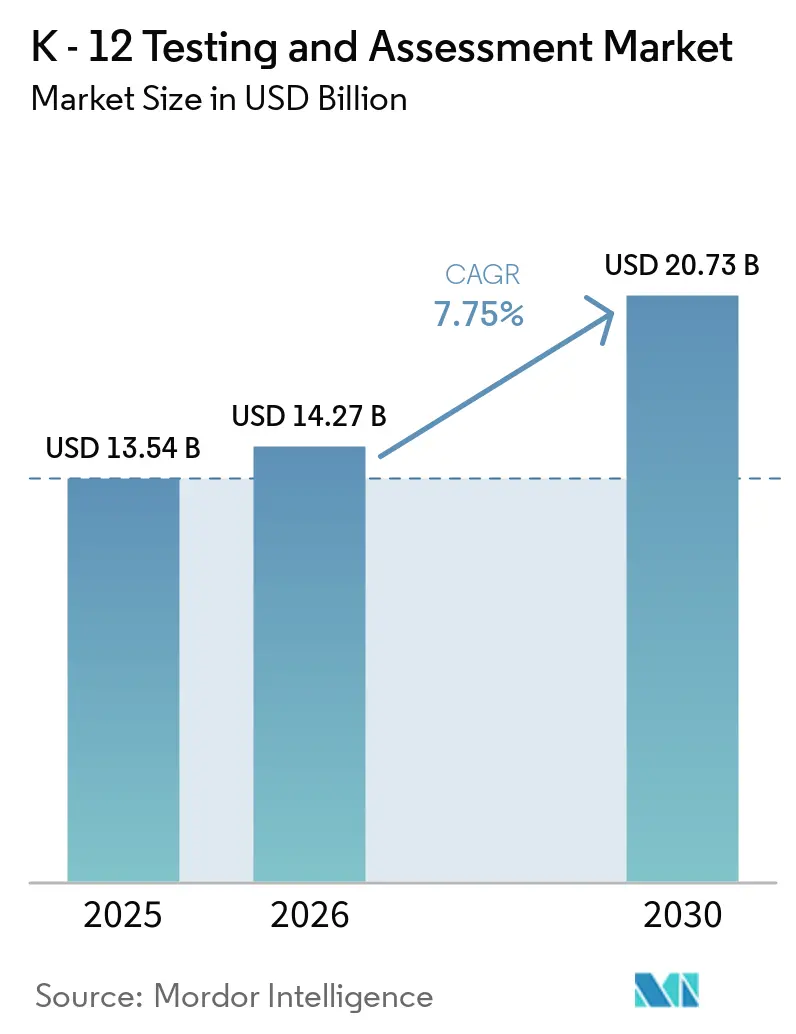
| Market Size (2026) | USD 14.27 Billion |
| Market Size (2030) | USD 20.73 Billion |
| Growth Rate (2026 - 2030) | 7.75% CAGR |
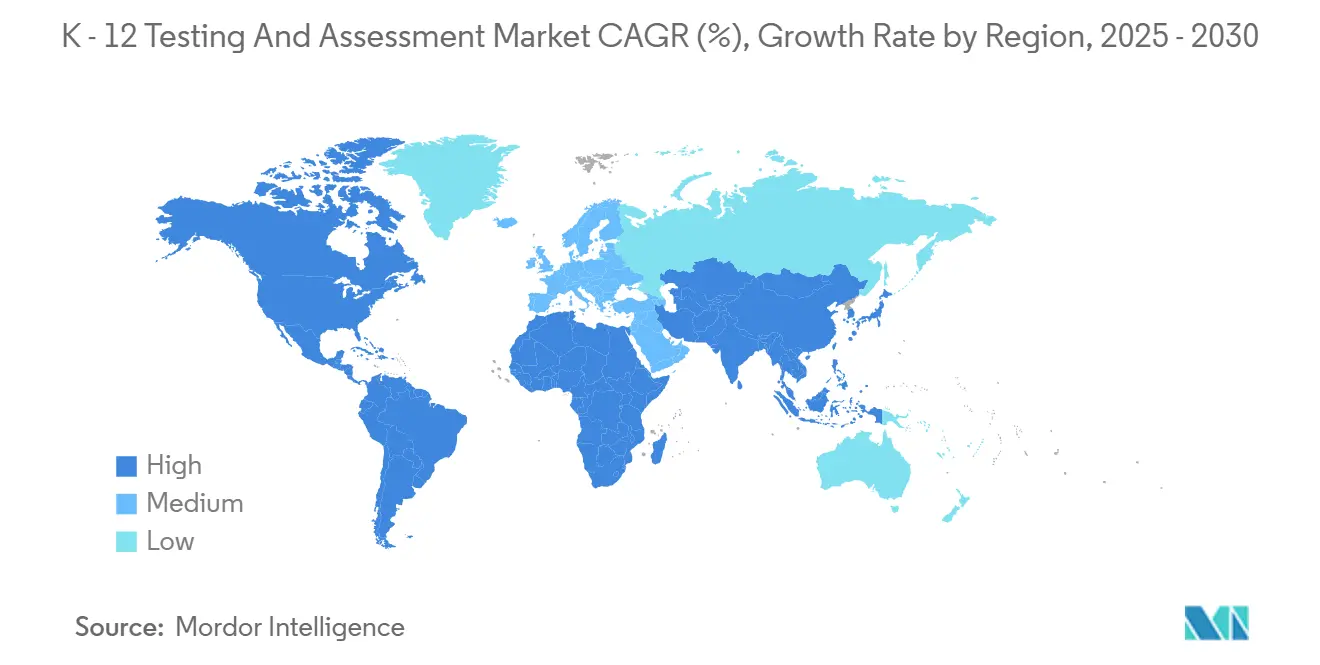
| Fastest Growing Market | Asia Pacific |
| Largest Market | North America |
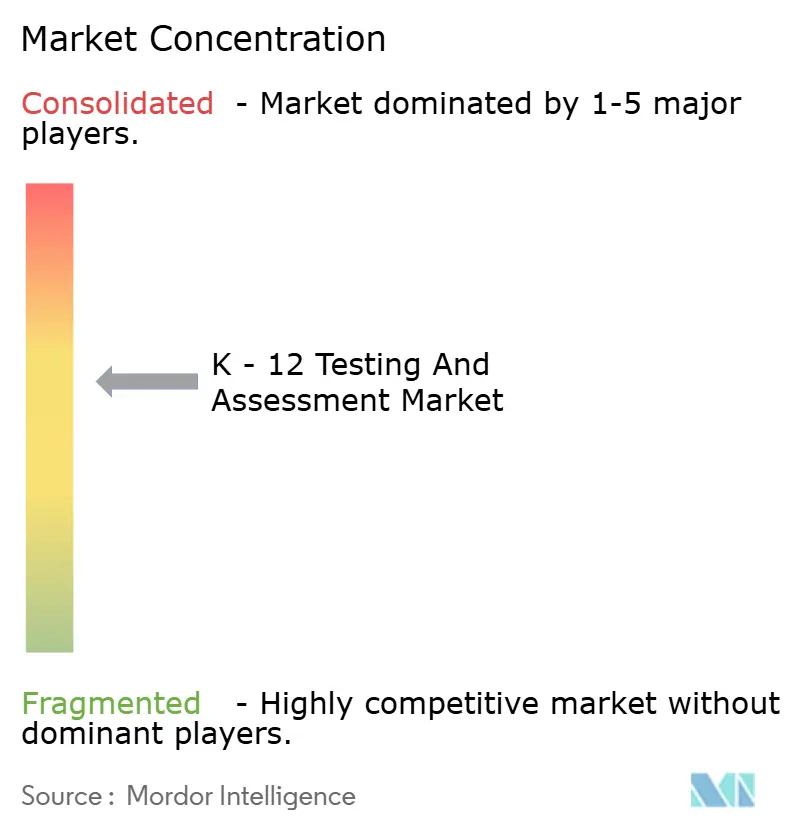
| Market Concentration | Medium |
Major Players *Disclaimer: Major Players sorted in no particular order Image © Mordor Intelligence. Reuse requires attribution under CC BY 4.0. | |
K-12 Testing and Assessment Market Analysis by Mordor Intelligence
The K-12 Testing and Assessment Market size is expected to grow from USD 13.54 billion in 2025 to USD 14.27 billion in 2026 and is forecast to reach USD 20.73 billion by 2030 at 7.75% CAGR over 2026-2030.
Momentum reflects a shift from one-shot summative exams toward through-year and adaptive models that compress testing time and improve precision, supported by credible pilots at the state level in the United States. Cloud-native delivery and universal design features are standardizing secure, accessible digital testing at scale for high-stakes programs like the SAT. At the same time, accommodations and WCAG-aligned tools are embedded as default. Interoperability standards such as OneRoster and EdFi are reducing integration friction with SIS/LMS platforms, thereby shortening implementations and enabling linked analytics across interim and summative assessments. Procurement cycles are lengthening as districts tighten privacy reviews after large-scale breaches, which raises the bar for security attestations, deletion workflows, and transparent data-use clauses. Vendors that combine validated predictive linking, rapid reporting, and curriculum-embedded next steps are best positioned to win as buyers favor solutions that translate scores into actionable instruction.
Key Report Takeaways
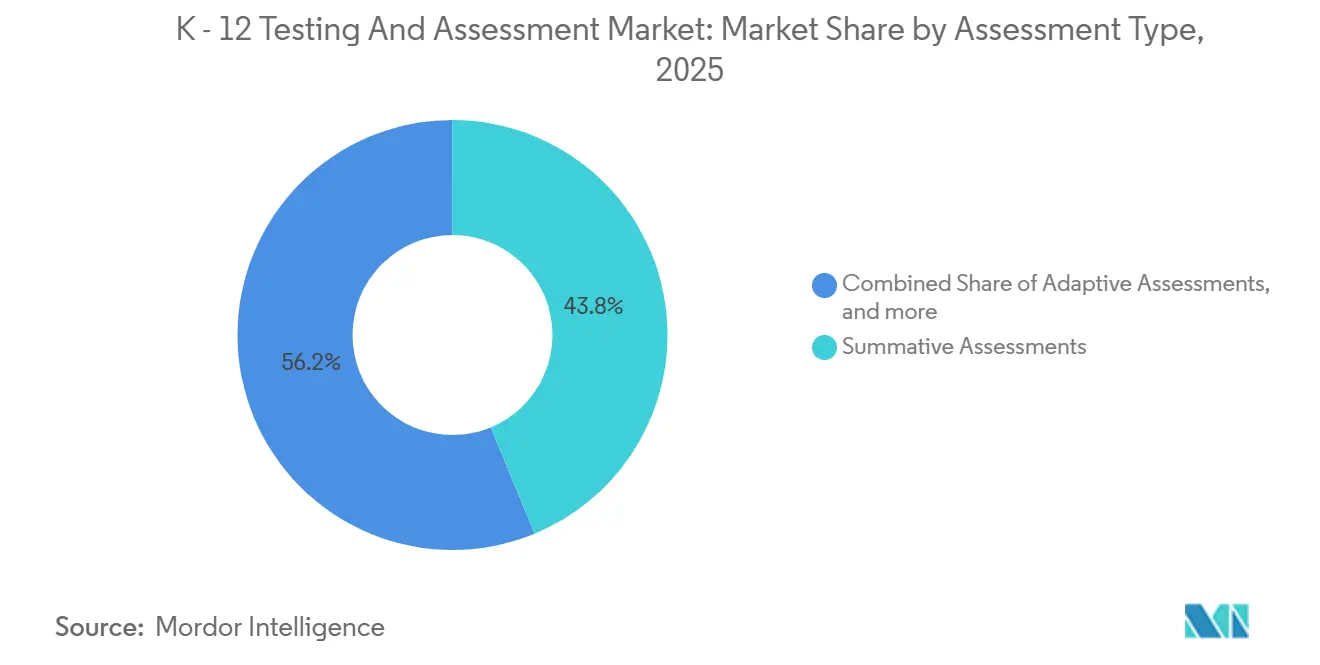
- By assessment type, summative assessments led with 43.76% revenue share in 2025, and adaptive assessments are forecast to expand at a 10.14% CAGR through 2031.
- By delivery mode, the online method led with 53.44% share in 2025, and cloud-based delivery is projected to grow at an 8.53% CAGR through 2031.
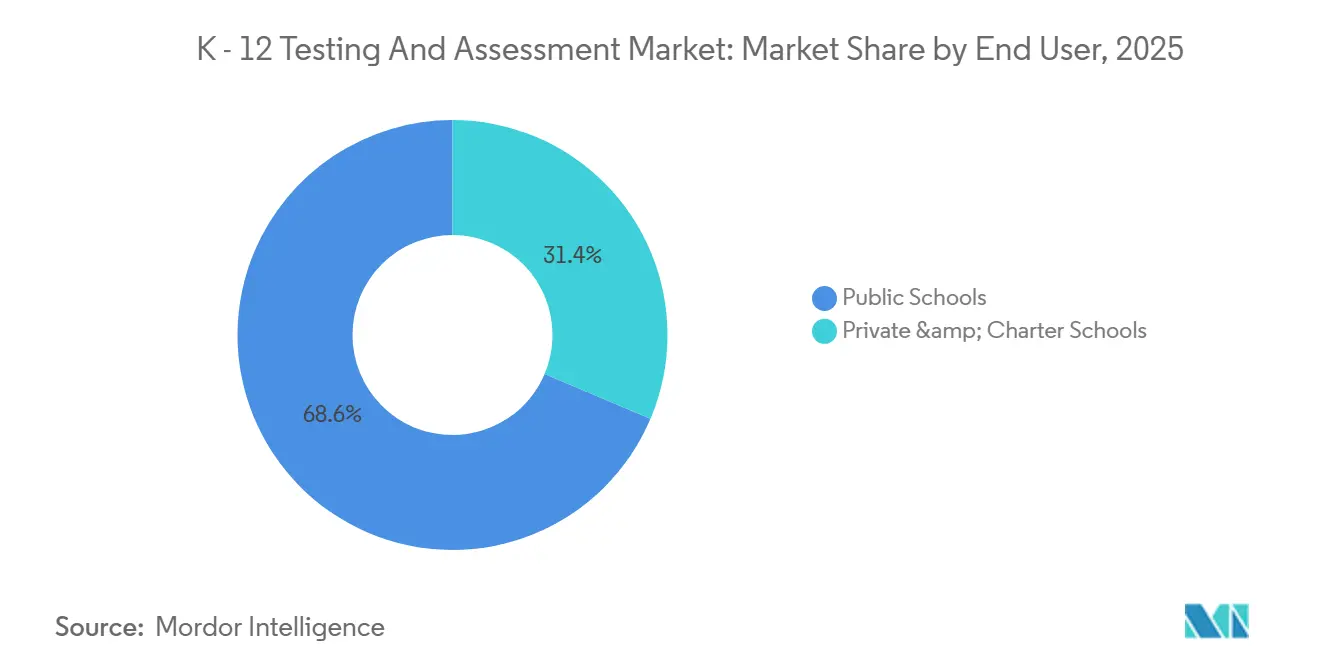
- By end user, public schools accounted for 68.63% of demand in 2025, and private & charter schools are projected to grow at an 8.33% CAGR through 2031.
- By geography, North America held 36.53% share in 2025, and Asia-Pacific is projected to grow at a 9.14% CAGR through 2031.
Note: Market size and forecast figures in this report are generated using Mordor Intelligence’s proprietary estimation framework, updated with the latest available data and insights as of January 2026.
Global K-12 Testing and Assessment Market Trends and Insights
Drivers Impact Analysis*
| Driver | (~) % Impact on CAGR Forecast | Geographic Relevance | Impact Timeline |
|---|---|---|---|
| Dyslexia screening mandates expand diagnostics | +1.2% | North America core; early adoption in select U.S. states | Medium term (2-4 years) |
| Through-year accountability models gain adoption | +1.8% | U.S. state-driven; limited international uptake | Medium term (2-4 years) |
| OneRoster/Ed-Fi interoperability reduces integration burden | +0.9% | North America and EU districts with mature SIS infrastructure | Short term (≤ 2 years) |
| Cloud-first delivery standardizes secure testing | +2.1% | Global, with rising penetration in select APAC systems | Short term (≤ 2 years) |
| Interim–summative linking accelerates adoption | +1.3% | U.S. districts; requires state-approved linking studies | Medium term (2-4 years) |
| Accessibility upgrades (WCAG 2.2) require refreshes | +0.4% | Global; compliance required for U.S. federally funded programs | Short term (≤ 2 years) |
| Source: Mordor Intelligence | |||
Dyslexia Screening Mandates Expand Diagnostics
Universal K-3 screening policies are reshaping early-literacy procurement and elevating demand for research-backed phonological-awareness tools in the K-12 testing and assessment market. Several states in the United States are codifying dyslexia risk screening into funding and accountability processes, moving screening from an optional add-on to core infrastructure. Vendors have aligned by expanding measures within established literacy suites, such as Amplify’s mCLASS with DIBELS 8th Edition, which includes Rapid Automatized Naming, vocabulary, spelling, and language comprehension to detect early reading risks. These adjustments support multi-tiered systems of support workflows that pair screening with progress monitoring and classroom interventions. Districts favor screeners that include Spanish-language options and that integrate with data platforms already used for instruction and intervention planning. Interoperability and alignment with state definitions are now decisive selection factors for this segment [1]Amplify, “mCLASS with DIBELS 8th Edition for Colorado,” Amplify, amplify.com .
Through-Year Accountability Models Gain Adoption
States are piloting through-year architectures that split accountability across fall, winter, and spring opportunities, which is a practical on-ramp to adaptive precision in the K-12 testing and assessment market. Texas’s STAAR Through-Year Assessment Pilot documented multi-stage adaptive delivery with test lengths that were 25-50% shorter than traditional forms, while maintaining strong reliability across administrations. The pilot assessed over 53,000 students across 93 districts and produced correlations and ROC AUC values that support its predictive relationship to annual summative results. These designs aim to reduce instructional time lost to testing and to deliver actionable mid-year indicators. The operational model depends on tight item-pool management, timely reporting, and careful scoring approaches that preserve growth sensitivity. Early pilot results provide a strong reference case for other state-led implementations that are exploring similar accountability shifts [2]Texas Education Agency, “2024–2025 STAAR Through-Year Assessment Pilot Technical Report,” Texas Education Agency, tea.texas.gov .
OneRoster/Ed Fi Interoperability Reduces Integration Burden
Districts are standardizing data exchange via OneRoster and Ed-Fi to simplify rostering, reduce manual file handling, and connect assessment platforms to SIS and LMS systems across the K-12 testing and assessment market. OneRoster 1.2 covers roster synchronization, gradebook exchange, and assessment results profiles that support linking out-of-class tests to courses. State and district projects are using Ed-Fi APIs for nightly demographic updates and for guardrails that lock SIS-originated fields while allowing educators to manage accommodations and test-status codes during administration. This approach reduces the start-of-year onboarding time and improves data quality for reporting and intervention groups. Standardized rostering also reinforces role-based access controls and single sign-on patterns across large-scale implementations. Procurement teams increasingly call out standards compliance in RFPs, which rewards vendors that have invested in certification and reference integrations in live district contexts.
Cloud First Delivery Standardizes Secure Testing
Cloud-native platforms now underpin the K-12 testing and assessment market, with secure browsers and browser-based applications enabling adaptive modules, faster test times, and unique test forms per student. The College Board’s Bluebook platform demonstrates how universal design tools such as magnification, integrated calculators, and color contrast can be delivered as standard, along with digital accommodations that align with WCAG requirements. Centralized delivery supports encryption, credential controls, and rapid session disablement when irregular activity is detected. Accessibility features reduce the need for pre-approved accommodations and lower the administrative burden on schools. Where connectivity is variable, vendors have released progressive web apps and local caching to keep sessions stable and upload results when networks return. These platform patterns are becoming the default for high-stakes tests and are setting the bar for district and state procurements that require operational resilience and accessibility by design.
Restraints Impact Analysis*
| Restraint | (~) % Impact on CAGR Forecast | Geographic Relevance | Impact Timeline |
|---|---|---|---|
| ESSER funding cliff constrains adoption | -1.4% | U.S. only; districts adjust after pandemic-relief funding period | Short term (≤ 2 years) |
| Cheating and content leakage undermine trust | -0.8% | Global; acute in high-stakes contexts | Long term (≥ 4 years) |
| AI item validity vetting delays rollouts | -0.6% | Global; greatest in jurisdictions with strict psychometrics | Medium term (2-4 years) |
| District privacy reviews stall procurements | -1.1% | North America and EU; heightened post-breach scrutiny | Medium term (2-4 years) |
| Source: Mordor Intelligence | |||
ESSER Funding Cliff Constrains Adoption
As pandemic-relief programs sunset, districts are rebalancing budgets toward tools with clear instructional value, slowing new deployments in the K-12 testing and assessment market. Buyers now emphasize interim assessments that provide validated links to state outcomes to guide mid-year supports. Districts remain interested in practical solutions that help teachers plan and differentiate during limited instructional time. Research spotlights sustained summer learning and targeted use of interim data as viable approaches in tighter funding cycles. Vendors that publish efficacy evidence and provide prescriptive follow-ups are likely to hold share as discretionary budgets compress. Guidance from national research organizations encourages investments that combine measurement with clear actionability.
Cheating and Content Leakage Undermine Trust
Security events have pushed programs to digital delivery with stronger encryption, unique test forms, and integrated forensics across the K-12 testing and assessment market. The College Board’s move to Bluebook introduced adaptive modules, randomized item presentation, and secure testing features that deter coordinated content exposure. The platform’s design also supports faster test completion, which reduces opportunities for content sharing across sittings. Data forensics firms have documented detection of coordinated answer patterns using statistical models, even when physical evidence is limited. These capabilities are now included in RFP checklists and inform state selection committees. Programs that demonstrate incident response discipline and transparent forensic reporting have a procurement advantage [3]College Board, “SAT Suite Accommodations and Supports Handbook,” College Board, collegeboard.org .
*Our forecasts treat driver/restraint impacts as directional, not additive. The impact forecasts reflect baseline growth, mix effects, and variable interactions.
Segment Analysis
By Assessment Type: Adaptive Formats Capture Next Generation Demand
Summative assessments held the largest share at 43.76% in 2025, while adaptive assessments are projected to record a 10.14% CAGR through 2031, reshaping the K-12 testing and assessment market share and highlighting how precision and shorter forms are moving to the center of district priorities. Computer-adaptive testing platforms adjust difficulty in real time to reduce test time and preserve reliability, and districts see value in faster reporting that supports instructional planning before term breaks. Interim and benchmark tools are gaining when they can link to state outcomes and align with priority curricula without burdensome setup. Educators also want formative checks that can plug into daily instruction and produce ready-to-teach resources for small-group work. Vendors that embed clear next steps into teacher workflows rather than stand-alone dashboards are more likely to drive usage. As states consider through-year models, item banks, and scoring that work across multiple windows, maintaining comparability and growth measures over the year will be more important.
Adaptive assessments are now paired with content and analytics that reduce teacher workload, which is a practical adoption lever in the K-12 testing and assessment market. Platforms that publish fresh linking studies and that update norms based on recent large samples help teams interpret results in context across years and cohorts. Teacher feedback indicates growing confidence when interim data are directly translated into aligned practice, which has driven product roadmaps that fuse assessment results with curated lessons and assignments. Diagnostic literacy tools are also expanding with measures that surface rapid-naming and language-comprehension needs, reflecting the new screening environment in early grades. The K-12 testing and assessment market for adaptive and diagnostic solutions is bolstered by use cases that tie screening to monthly progress checks within intervention blocks. Vendors that document psychometric rigor and content alignment while integrating with SIS/LMS data standards will be best placed to capture growth in this segment.


By Delivery Mode: Cloud Infrastructure Commands Acceleration
The online method captured 53.44% of deliveries in 2025, and cloud-based deployment is projected to grow at an 8.53% CAGR through 2031, positioning cloud as the default backbone for the K-12 testing and assessment market, where districts require device-agnostic access and continuous updates. High-stakes programs are already exemplifying the standard, with the College Board’s Bluebook delivering adaptive modules and universal tools as part of base delivery. These capabilities include integrated calculators, annotation, and text-to-speech, with digital accommodations aligned to WCAG criteria for federally funded programs. Security design choices, such as unique item sequences per student and real-time session control, are now best practices at scale. The net effect is shorter test times, modernized accessibility, and better session integrity in challenging environments. Districts increasingly expect these features to be built in rather than added on, raising the bar for vendor selection.
On-premise deployments persist where bandwidth is inconsistent or where districts want local caching during peak windows, and hybrid approaches are common in state programs with broad device mixes. Vendors have released secure kiosk and progressive web app options that sustain sessions during connectivity dips and upload responses when connections resume. State technology guides describe how local content caching and automated device health checks reduce testing-day traffic, providing a practical complement to cloud back ends. Privacy and data-protection expectations are shaping delivery decisions as buyers ask for standard agreements that define permitted uses, retention, and deletion timelines. Vendors that offer tested offline modes, clear security attestations, and standard data-privacy agreements move faster through procurement. This combination of resilience, privacy assurances, and standards alignment is becoming the minimum requirement for district-scale implementations.
By End User: Charter/Private Segments Pursue Data Driven Differentiation
Public schools accounted for 68.63% of adoption in 2025, while private and charter schools are projected to expand at an 8.33% CAGR, reflecting distinct needs around curriculum alignment, college readiness, and flexible scheduling across the K-12 testing and assessment market. Public systems continue to anchor multi-year state contracts for summative exams and leverage interim tools when they offer clear forecasts of proficiency and growth. Data dashboards that translate test scores into student groups and lesson assignments are seen as an immediate relief from teachers' workload. In private schools, readiness and admissions alignment are salient, with ERB’s assessments built for vertical comparability and scheduled checkpoints. Private operators tend to seek continuity of scale and flexible seasonal testing windows that align with school calendars. Demand in charter networks centers on growth trajectories and subgroup analysis that compare campuses within a network over multiple seasons.
Procurement expectations differ by governance model, yet both public and private buyers want solutions that can show valid links to instructional decisions in the classroom. Public districts are accelerating the use of predictive linking and season-on-season insights to target support year-round and guide resource allocation. Private and charter operators look for analytics that support differentiation and student-parent conferences. Across all settings, leaders value solutions that close the loop from assessment to next steps by surfacing aligned materials from trusted publishers within existing teacher routines. Standardized data-privacy agreements and clear data-deletion workflows are now included in both public and private reviews to reduce risk and to protect student information. As the K-12 testing and assessment industry aligns solutions to these distinct requirements, growth pockets are strongest where efficacy and teacher usability are most evident.
Geography Analysis
North America held a 36.53% share in 2025, supported by large state accountability programs, significant interim adoption in districts, and a mature vendor ecosystem that services state and district contracts in the K-12 testing and assessment market. High-visibility pilots of through-year models in Texas show that multi-stage adaptive forms can shorten administration time while maintaining strong reliability and predictive relationships to summative outcomes. College admissions testing modernized digital delivery for the SAT and related programs, embedding accessibility tools that align with WCAG, resetting expectations for secure and inclusive testing at scale. Large-scale state programs supported by ETS and other providers continue to operate at meaningful volume across major states, which underpins steady demand for summative delivery and scoring. Privacy has taken on greater urgency as regulators in Canada have called for stronger safeguards and procurement frameworks for children’s data following high-profile breaches, which is influencing school board expectations in both provincial and district contexts. State technology updates demonstrate the role of offline modes, secure browsing, and local caching to ensure stable delivery during peak windows, thereby adding resilience across diverse infrastructure conditions. The region’s K-12 testing and assessment market benefits from coherent procurement frameworks and standards-aligned integrations that reduce friction across SIS, LMS, and assessment platforms.
Asia-Pacific is projected to grow at a 9.14% CAGR through 2031, propelled by large student populations and policy momentum around digital content delivery, teacher support, and assessment modernization across the K-12 testing and assessment market. India’s national platforms continue to expand access to digital learning infrastructure for teachers and students, including content repositories and training tools that can support ongoing adoption of digital assessments in K-8 settings. Mixed connectivity across parts of the region sustains demand for progressive web apps, local caching, and resilient test clients that protect student sessions under bandwidth constraints. State and provincial deployments that describe device readiness, session controls, and content caching provide useful templates for school systems managing bandwidth variability. Programs that embed multilingual support into test delivery are also favored, given the region's language diversity. As digital infrastructure improves and cloud capacity expands, buyers expect vendor platforms to demonstrate offline stability and clear student privacy controls, which mirrors North American trends. Vendors that offer scalable cloud back ends with flexible offline clients are well positioned to serve larger deployments in the region.
Europe shows steady adoption with a focus on qualifications frameworks, centralized exam integrity, and privacy protection for student data in the K-12 testing and assessment market. United Kingdom and international qualifications providers have continued to enhance digital supports for learners and educators, including practice and review tools that complement school-based assessments in upper grades. Adoption paths vary by country due to governance and language, which shape vendor investments in localization and data residency. Buyers emphasize continuity between school-based assessments and high-stakes national examinations, which favors platforms that can serve both. Accessibility and usability are recurring requirements as ministries and exam boards seek to ensure equitable access under digital delivery. Vendors that can transparently document their security practices, support multiple languages, and operate in accordance with national data guidelines are more likely to meet procurement criteria. As standards and expectations converge, cloud architectures with clear privacy controls and a strong track record in school-based deployments are gaining attention in tender processes. Over the forecast period, the K-12 testing and assessment market in Europe should benefit from steady infrastructure improvement and continued emphasis on quality assurance in assessment operations.

Competitive Landscape
The K-12 testing and assessment market features a core group of scaled providers alongside specialized firms that serve literacy, predictive analytics, and state summative needs. Curriculum Associates has expanded its i-Ready portfolio with middle school enhancements, a core Algebra expansion, and Spanish-language supports, underscoring a focus on diagnostic-to-instruction pathways across grade bands. NWEA introduced a national dashboard that provides real-time context on achievement and growth drawn from millions of interim administrations, and it supports states where linking studies allow proficiency projections. Renaissance has integrated assessment with major curriculum publishers using AI-driven recommendations that turn scores into teachable actions, a design that fits district priorities for workload relief and consistent interventions.
Cloud-native delivery is now a must-have, and high-stakes programs have accelerated adoption with secure testing applications that incorporate universal design features, digital accommodations, and randomized item sequences. The College Board’s Bluebook transition illustrates how major test sponsors are setting the operating standard for accessibility and security at scale, which flows down into district expectations for vendor platforms. State technology updates from DRC and partners capture the evolution of secure kiosk apps, content caching, and device readiness protocols that are now typical of large-scale online assessments. Amplify has expanded its mCLASS assessment suite with deeper dyslexia-risk measures and multilingual options, which align with early-literacy screening requirements and support ongoing progress monitoring in K-3.
Partnerships that connect assessment to readiness and career pathways continue to evolve, as seen in ACT’s collaborations that expand resources for instruction and student preparation in secondary grades. ACT has also released toolkits that help communities align education-to-workforce pipelines, which complement traditional assessment offerings with planning resources for local stakeholders. Across the landscape, buyers reward transparency in efficacy, crisp interoperability with SIS/LMS ecosystems, and privacy-first operations backed by standard DPAs and clear deletion commitments. As the K-12 testing and assessment market advances, vendors that convert measurement into a platform, next steps, offer stable and accessible digital delivery, and publish rigorous validation and linking evidence are best positioned to gain share.
K-12 Testing and Assessment Industry Leaders
Curriculum Associates
NWEA
Renaissance Learning
Cambium Assessment
Educational Testing Service (ETS)
- *Disclaimer: Major Players sorted in no particular order

Recent Industry Developments
- April 2026: ACT released its Pathways to Success Toolkit with community college partners to strengthen local education-to-workforce pipelines and document strategies for cross-sector collaboration.
- October 2025: NWEA launched the MAP Growth National Dashboard to provide seasonal views of achievement and growth and to support proficiency projections for states with approved linking.
- September 2025: Curriculum Associates unveiled new i-Ready features, including i-Ready Pro for Middle School, an Algebra 1 expansion, and enhanced supports for Spanish multilingual learners.
- March 2025: Pearson reported that 72% of K-12 leaders are using or considering AI to improve assessment, driven by time savings from data analysis and automated scoring of open-ended responses.


Global K-12 Testing and Assessment Market Report Scope
| Formative Assessments |
| Summative Assessments |
| Diagnostic Assessments |
| Interim / Benchmark Assessments |
| Adaptive Assessments |
| Cloud-based |
| On-premise |
| Hybrid |
| Public Schools |
| Private & Charter Schools |
| North America | United States |
| Canada | |
| Mexico | |
| South America | Brazil |
| Peru | |
| Chile | |
| Argentina | |
| Rest of South America | |
| Europe | United Kingdom |
| Germany | |
| France | |
| Spain | |
| Italy | |
| BENELUX | |
| NORDICS | |
| Rest of Europe | |
| Asia-Pacific | India |
| China | |
| Japan | |
| Australia | |
| South Korea | |
| South-East Asia | |
| Rest of Asia-Pacific | |
| Middle East & Africa | United Arab Emirates |
| Saudi Arabia | |
| South Africa | |
| Nigeria | |
| Rest of Middle East & Africa |
| By Assessment Type | Formative Assessments | |
| Summative Assessments | ||
| Diagnostic Assessments | ||
| Interim / Benchmark Assessments | ||
| Adaptive Assessments | ||
| By Delivery Mode | Cloud-based | |
| On-premise | ||
| Hybrid | ||
| By End-User | Public Schools | |
| Private & Charter Schools | ||
| By Geography | North America | United States |
| Canada | ||
| Mexico | ||
| South America | Brazil | |
| Peru | ||
| Chile | ||
| Argentina | ||
| Rest of South America | ||
| Europe | United Kingdom | |
| Germany | ||
| France | ||
| Spain | ||
| Italy | ||
| BENELUX | ||
| NORDICS | ||
| Rest of Europe | ||
| Asia-Pacific | India | |
| China | ||
| Japan | ||
| Australia | ||
| South Korea | ||
| South-East Asia | ||
| Rest of Asia-Pacific | ||
| Middle East & Africa | United Arab Emirates | |
| Saudi Arabia | ||
| South Africa | ||
| Nigeria | ||
| Rest of Middle East & Africa | ||


Key Questions Answered in the Report
What is the size and growth outlook for the K-12 testing and assessment market to 2031?
The K-12 testing and assessment market size was USD 13.54 billion in 2025 and is projected to reach USD 20.73 billion by 2031 at a 7.75% CAGR over 2026-2031.
Which assessment types lead and which are growing fastest?
Summative assessments led with a 43.76% share in 2025, while adaptive assessments are the fastest-growing, with a projected 10.14% CAGR through 2031 as districts prioritize precision and efficient testing.
Which delivery modes are outpacing others in adoption?
The online method held 53.44% share in 2025, and cloud-based deployment is projected to grow at 8.53% CAGR to 2031 as cloud-native platforms standardize secure, accessible testing at scale.
Which regions account for the largest demand and where is growth fastest?
North America held 36.53% of demand in 2025, supported by statewide accountability systems, and Asia-Pacific is projected to expand at a 9.14% CAGR through 2031 on ongoing digital transformation.
What are the main demand drivers between 2026 and 2031?
Key drivers include the shift to through-year accountability, cloud-first secure delivery, interoperability via OneRoster and Ed Fi, validation-backed interim-to-summative linking, and accessibility upgrades aligned to WCAG.
What procurement risks could slow implementations in the next few years?
The most cited risks are tighter district privacy reviews post-breach, added AI validity vetting for content and scoring, and constrained budgets after the pandemic-relief period, which extend evaluation timelines and favor vendors with evidence and privacy-by-default operations.
Page last updated on:


