K-12 Technology Training For Teachers Market Size and Share
Market Overview
| Study Period | 2020 - 2031 |
|---|---|
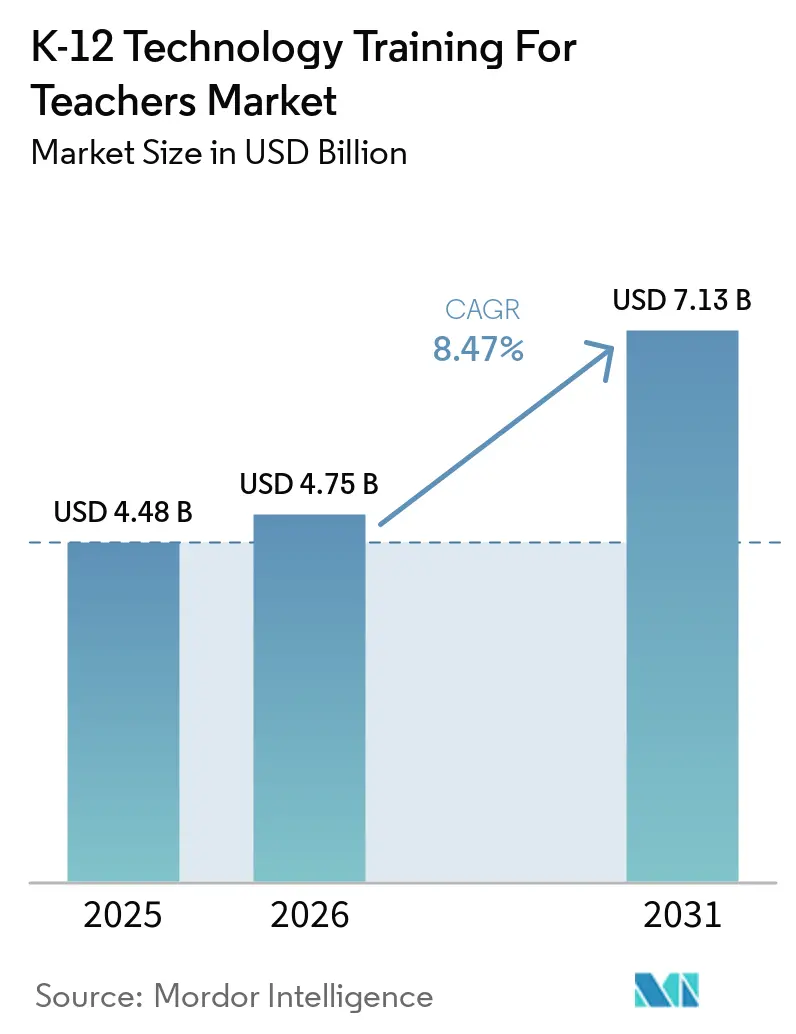
| Market Size (2026) | USD 4.75 Billion |
| Market Size (2031) | USD 7.13 Billion |
| Growth Rate (2026 - 2031) | 8.47% CAGR |
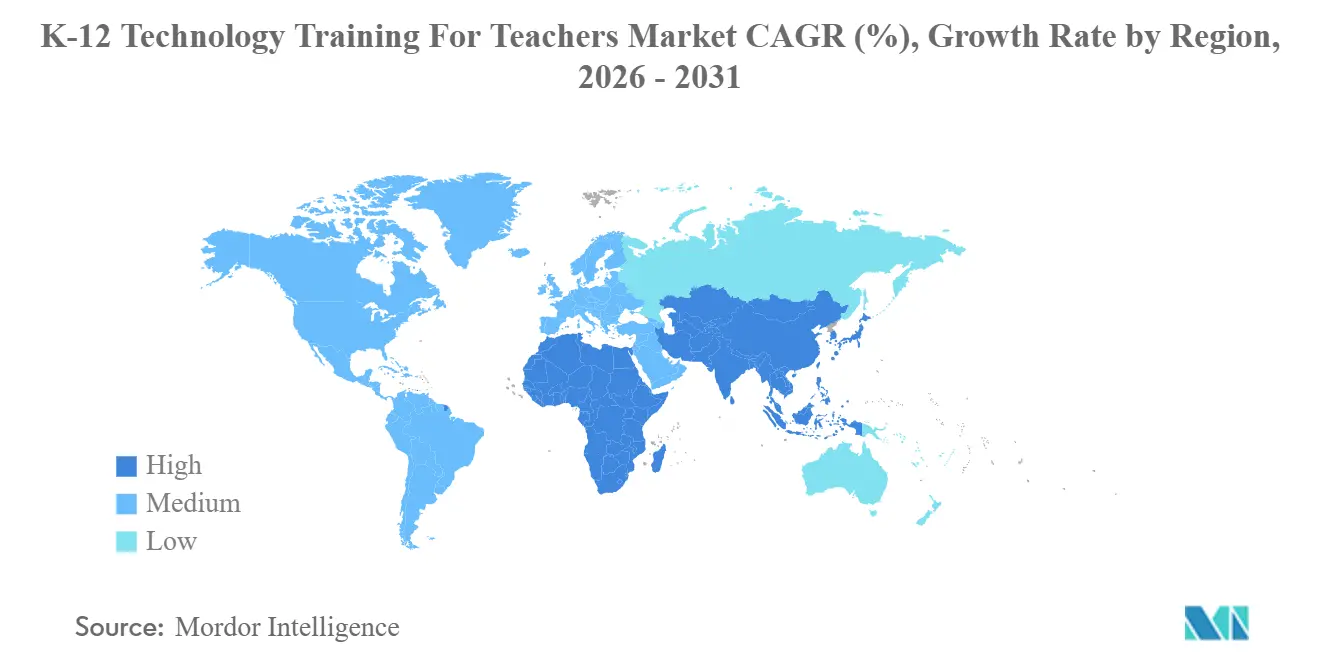
| Fastest Growing Market | Asia Pacific |
| Largest Market | North America |
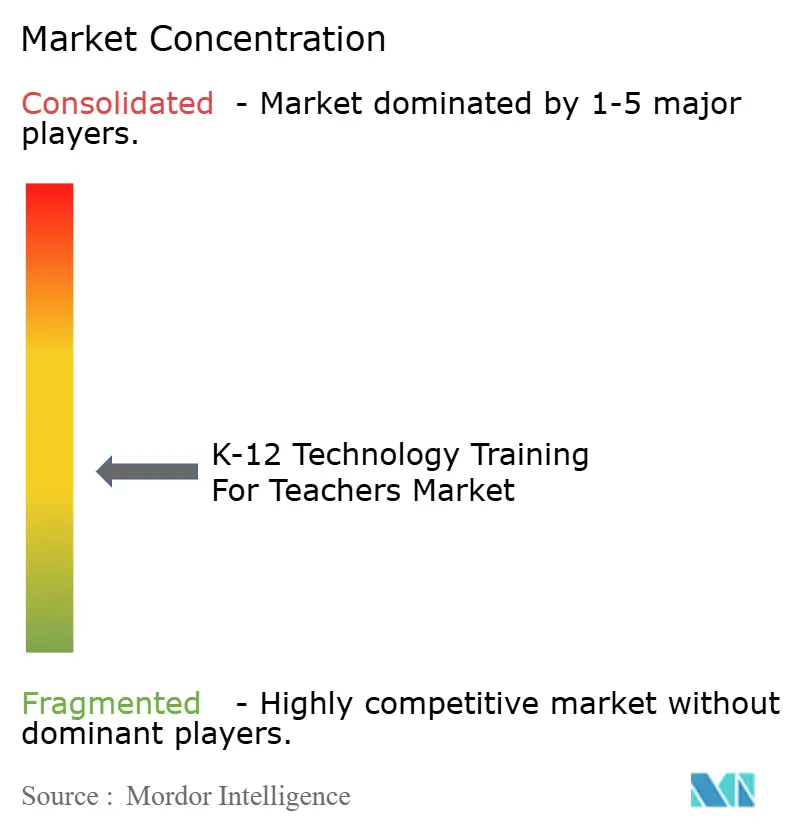
| Market Concentration | Medium |
Major Players *Disclaimer: Major Players sorted in no particular order Image © Mordor Intelligence. Reuse requires attribution under CC BY 4.0. | |
K-12 Technology Training For Teachers Market Analysis by Mordor Intelligence
The K-12 Technology Training For Teachers Market size is projected to expand from USD 4.48 billion in 2025 and USD 4.75 billion in 2026 to USD 7.13 billion by 2031, registering a CAGR of 8.47% between 2026 to 2031.
Districts are renewing professional development through multi-year ecosystem partnerships while absorbing the expiration of pandemic-era funding, a transition that is redefining spending plans for 2026. Platform incumbents integrate training into Student Information System (SIS) and Learning Management System (LMS) contracts, while subscription credentials gain momentum as teachers seek portable recognition that counts for endorsements and renewals. Demand for AI literacy and computer science credentials is rising as national and state policies formalize teacher competency requirements. Interoperability standards such as OneRoster and Ed-Fi are shaping credential portability and Professional Development (PD) rostering practices, reducing friction for district coordinators and improving adoption outcomes across the K-12 technology training for teachers market.
Key Report Takeaways
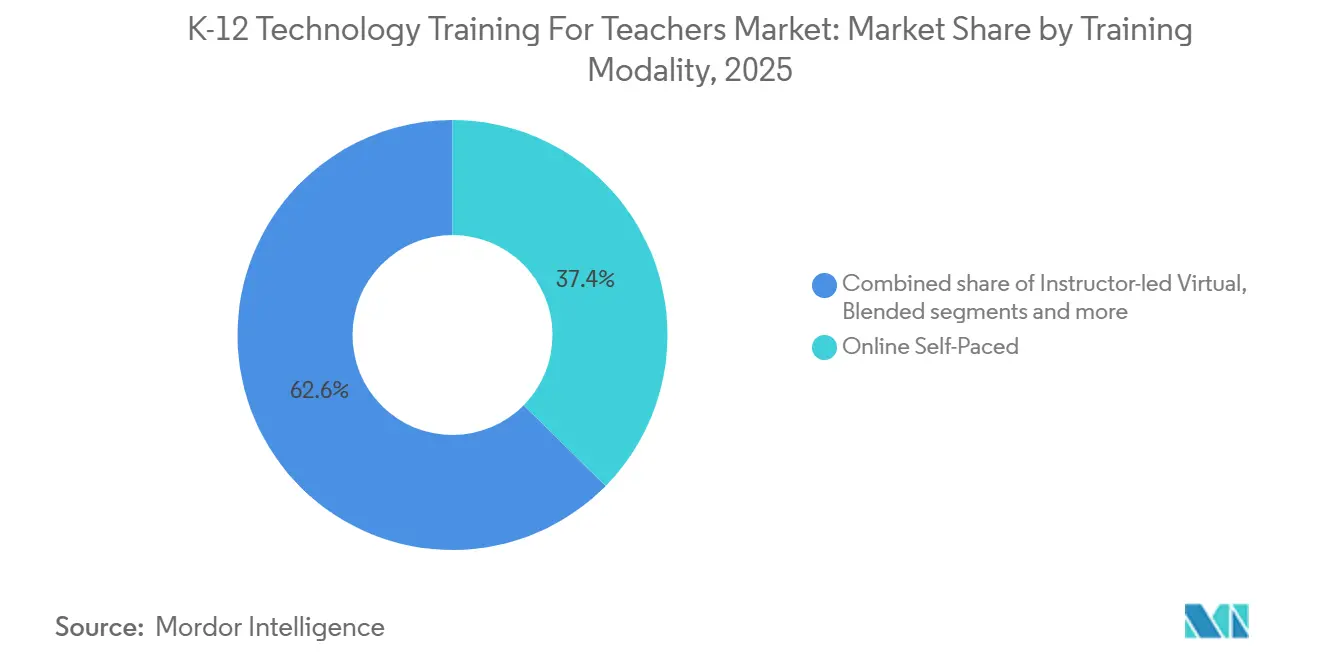
- By training modality, online self-paced formats accounted for 37.38% of the K-12 technology training for teachers market in 2025, while blended learning is projected to expand at a 14.36% CAGR through 2031.
- By delivery mode, district-wide contracts held 39.87% share of the K-12 technology training for teachers market in 2025, while subscription and certification platforms are forecast to grow at 15.44% CAGR through 2031.
- By geography, North America commanded 37.35% of the K-12 technology training for teachers market share in 2025, while Asia-Pacific is projected to advance at a 13.38% CAGR through 2031.
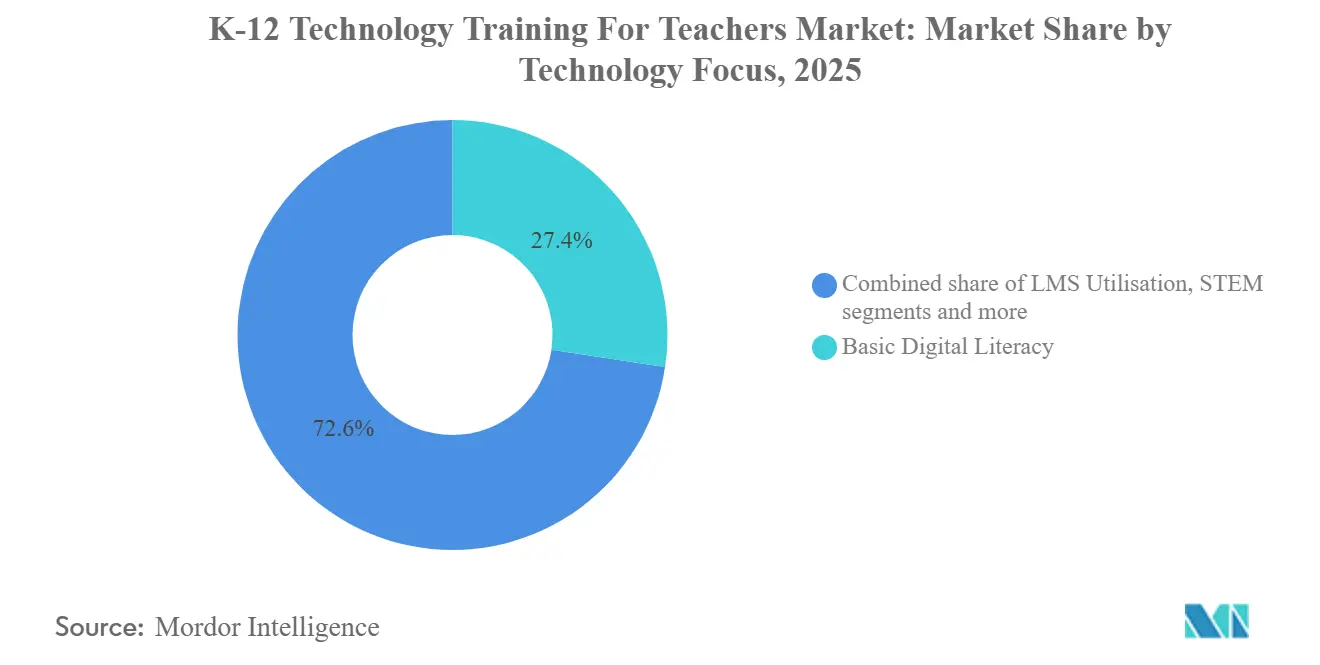
- By technology focus, basic digital literacy captured 27.37% of the K-12 technology training for teachers market in 2025, while emerging tech, spanning AI, AR, VR, data privacy, and cybersecurity, is set to grow at a 17.44% CAGR through 2031.
- By end user, elementary teachers accounted for 31.38% of the K-12 technology training for teachers market in 2025, and high school teachers are projected to post the fastest growth at an 11.35% CAGR through 2031.
Note: Market size and forecast figures in this report are generated using Mordor Intelligence’s proprietary estimation framework, updated with the latest available data and insights as of January 2026.
Global K-12 Technology Training For Teachers Market Trends and Insights
Drivers Impact Analysis*
| Driver | (~) % Impact on CAGR Forecast | Geographic Relevance | Impact Timeline |
|---|---|---|---|
| Hybrid PD Adoption Accelerates Globally | +1.8% | Global, with early gains in North America, Europe, and APAC urban centers | Medium Term (2–4 Years) |
| Generative AI Classroom PD Demand | +2.2% | North America and the EU lead, APAC core with spill-over to MEA | Short Term (≤2 Years) |
| CS Mandates Expand Teacher PD | +1.5% | National, with concentrated impact in the United States, India, and China | Medium Term (2–4 Years) |
| Rapid LMS Upgrades Require Retraining | +1.2% | Global | Short Term (≤2 Years) |
| Micro-Credential Incentives Spur Upskilling | +1.4% | North America, Europe, Southeast Asia | Long Term (≥4 Years) |
| Interoperability, Rostering Standards Demand Training | +0.8% | Global, driven by OneRoster and Ed-Fi adoption | Medium Term (2–4 Years) |
| Source: Mordor Intelligence | |||
Hybrid PD Adoption Accelerates Globally
Blended professional development that merges live cohort sessions with asynchronous micro-lessons is scaling as districts seek better completion and classroom transfer without increasing after-hours demands. LAUSD’s micro-credentialing structure uses a clear split between face-to-face time, online modules, and applied homework, leading to high completion and salary point eligibility, which reinforces teacher participation[1]Los Angeles Unified School District, “Micro-Credentialing Program Overview,” LAUSD, lausd.org. District teams cite real-time interaction for modeling and Q&A, flexible pacing for busy schedules, and embedded check-ins that surface misconceptions before classroom use, which fit practical needs in 2026. PowerSchool University’s open labs and embedded micro-trainings around product updates complement hybrid pathways by addressing time-sensitive workflow changes within the tools teachers already use[2]PowerSchool University, “PSU Chicago 2026,” PowerSchool University, psu.powerschool.com. These practices reduce churn during LMS or content updates and encourage sustained use of new features inside the K-12 technology training for teachers market. As hybrid formats align with contract time and recognized credits, they become a default choice for districts upgrading technology fluency at scale.
Generative AI Classroom PD Demand
Districts are moving to close the proficiency gap between student familiarity with AI and teacher use of AI-aligned tools by prioritizing AI literacy and responsible-use frameworks in PD catalogs. Google introduced the Gemini Certified Educator exam in April 2026, offering a six-month free window, positioning verified AI credentials as a scalable signal of competency for K-12 educators worldwide. Microsoft’s Elevate for Educators program created no-cost credentials, AI communities, and a Teach in Microsoft 365 Copilot app that aligns lesson planning and assessments with safe practice in 2026[3]Microsoft Education Team, “Introducing Microsoft Innovations and Programs to Support AI-Powered Teaching and Learning,” Microsoft Education Blog, microsoft.com. Discovery Education’s connected ecosystem integrates IBM SkillsBuild PD and AI TeacherTools, so educators receive contextual nudges tied to classroom resources and student data. Policy is also a catalyst, with China’s April 2026 AI Plus Education plan embedding AI competencies into teacher qualification exams by 2030, which expands AI-focused PD demand system-wide. These developments raise the floor for AI literacy and safe practice in the K-12 technology training for teachers market in 2026.
CS Mandates Expand Teacher PD
States are tightening computer science credential rules, which lifts enrollment in structured PD sequences linked to authorization and renewal credits in 2026. New York removed credentialing gaps and established explicit pathways for CS teachers that districts translate into targeted cohorts and course approvals. Associations such as Code.org continue to anchor hybrid workshops and summer intensives that align with CS Discoveries, CS Principles, and CSA, which meet state requirements for secondary instruction. California’s legislative updates extended authorization timelines and revealed alignment issues with stipends that districts consider when designing cohorts and matching funds for teachers. These shifts push districts toward credential-bearing PD with verified assessments that count toward endorsements and advancement within the K-12 technology training for teachers market. Rostering and data standards also help administrators track instructor eligibility and align PD seats with staffing needs across schools.
Rapid LMS Upgrades Require Retraining
Frequent LMS upgrades and new AI assistants change teacher workflows for grading, rubrics, and content curation, creating steady demand for timely retraining within district portals. Ownership changes at major providers in 2024 preceded visible product evolution, including AI co-pilots and interface updates that require quick on-the-job learning. District strategies feature short micro-trainings embedded near help menus and open labs where teachers troubleshoot real changes with vendor engineers, which lowers the adoption curve. Educators value role-specific guidance and “only what you need now” content so they can implement changes without overload during grading windows or testing seasons. Interoperability commitments such as OneRoster 1.2 and Ed-Fi stabilize data handoffs and reduce the number of unique workflows teachers must relearn during migrations. This cadence strengthens recurring retraining needs inside the K-12 technology training for teachers market as AI-driven updates reshape everyday tasks.
Restraints Impact Analysis*
| Restraint | (~) % Impact on CAGR Forecast | Geographic Relevance | Impact Timeline |
|---|---|---|---|
| Post-ESSER PD Budgets Compress | -1.9% | United States, concentrated in high-poverty districts | Short Term (≤2 Years) |
| Teacher Burnout Limits PD Time | -1.3% | Global, acute in North America and Europe | Medium Term (2–4 Years) |
| Fragmented Credential Recognition Slows Uptake | -0.9% | North America, Europe, and the emerging markets in APAC | Long Term (≥4 Years) |
| Procurement, Privacy Reviews Delay Pilots | -0.6% | Global, with regulatory concentration in the EU and California | Medium Term (2–4 Years) |
| Source: Mordor Intelligence | |||
Post-ESSER PD Budgets Compress
Late-liquidation limits in 2025 created uncertainty for obligated funds and paused payments to providers, which disrupted multi-year PD planning in many districts[4]Association of Educational Service Agencies, “ESSER Liquidation Update,” AESA, aesa.us. Districts with strong evidence systems can better defend renewals by linking PD completions to student outcomes and verified credentials in 2026. Title II-A funding remains a baseline, but administrators now prioritize offers with clear pathways to endorsements and salary credits that are recognized across schools. Providers have adapted with evidence portfolios and compliance-ready modules that help districts retain training lines within slimmer budgets. This favors solutions that demonstrate impact and credential portability across employers in the K-12 technology training for teachers market. The shift reduces one-off workshops and elevates multi-session sequences with verified assessments and transparent rostering.
Teacher Burnout Limits PD Time
Workload and after-hours expectations suppress voluntary participation, so districts are embedding PD during contract time or relying on short modules that fit prep blocks. LAUSD’s micro-credential structure awards salary points upon verified completion, which increases persistence among certificated staff who can earn incremental pay for documented learning. AI-focused micro-modules embedded in daily workflows have reached scale by solving small but frequent tasks teachers face in planning and feedback. International initiatives emphasize flexible pacing and blended delivery to reach educators in rural and lower-connectivity regions who need consistent support. Districts also consolidate PD with routine staff meetings and PLC time, which helps manage participation within capped PD days and avoids scheduling in the evenings. These approaches increase throughput without expanding duty hours in the K-12 technology training for teachers market.
*Our forecasts treat driver/restraint impacts as directional, not additive. The impact forecasts reflect baseline growth, mix effects, and variable interactions.
Segment Analysis
By Training Modality: Blended Architectures Displace Legacy Self-Paced
Online self-paced and virtual formats held 37.38% share in 2025, while blended learning is projected to grow at 14.36% CAGR through 2031 as teachers seek live cohort interaction with flexible pacing. The K-12 technology training for teachers market is shifting toward hybrid pathways that pair synchronous modeling with asynchronous practice, aligning with contract time and reducing burnout from extended evening sessions. Districts improve completion when portfolios and classroom application are required for credit and compensation, which encourages deeper transfer of new skills. Embedded micro-training on platform updates within LMS portals provides timely support at points of use, which strengthens day-to-day adoption. Content ecosystems that surface targeted PD nudges inside dashboards are helping educators link training to real student needs. The K-12 technology training for teachers market benefits when providers align a hybrid design to assessment-backed credentials recognized by districts.
Completion and persistence are stronger when blended courses include feedback on evidence and coaching on classroom implementation for curricula such as CS Principles and CSA. The K-12 technology training for teachers market size for blended modality is projected to grow as districts standardize cohort models with live touchpoints and asynchronous practice. Live virtual workshops remain an option when travel is limited, yet time zones and coverage still constrain participation in large districts. Providers add bite-sized refreshers so teachers can relearn workflows after updates without repeating full modules, which supports continuous change cycles in 2026. Alignment to recognized credentials and district salary lanes increases teacher motivation to complete blended pathways that include evidence and applied tasks. This modality is positioned to outpace legacy self-paced models inside the K-12 technology training for teachers market.


By Delivery Mode: Subscription Platforms Disrupt Legacy District Contracts
District-wide contracts and institutional programs accounted for 39.87% in 2025, as platform providers embedded PD into SIS and LMS agreements that renew on multi-year cycles. Certification-based and subscription platforms are forecast to grow at 15.44% CAGR as educators seek stackable recognition and evidence-based credentials that travel between schools. The K-12 technology training for teachers market reflects this mix as districts maintain large ecosystem agreements while adding subscription cohorts to address emerging competencies between contract refreshes. Google introduced a six-month free window for Gemini educator certification in 2026 to seed AI literacy at scale across languages and contexts. Microsoft’s Elevate for Educators adds no-cost credentials and AI communities that districts can deploy within school-based networks to support peers and maintain continuity. These shifts increase credential portability and reduce reliance on one-off workshops across the K-12 technology training for teachers market.
Despite district-wide contracts accounting for the largest share of the K-12 technology training for teachers market in 2025, subscription and certification models now expand faster due to clear crosswalks into salary lanes and renewals. Associations and nonprofits scale competency-based assessment by validating classroom evidence rather than seat time, which appeals to self-directed educators and secondary teachers pursuing endorsements. State stipend programs influence completion rates based on coverage levels and cohort structure, factors that districts consider when choosing delivery partners for high-priority endorsements. Interoperability for roster sync and completion records is an adoption driver, since it lowers administrative overhead and simplifies audits for PD coordinators. As recognition clarity improves, subscription and certification cohorts become a regular complement to district-wide agreements inside the K-12 technology training for teachers market.
By Technology Focus: Emerging Tech Surges on AI Anxiety
Basic digital literacy accounted for 27.37% in 2025. Still, emerging tech spanning AI, AR, VR, data privacy, and cybersecurity is projected to grow at a 17.44% CAGR through 2031 as districts align PD to responsible use and safe practices. Google’s Gemini educator certifications and Microsoft’s Elevate credentials anchor AI literacy and classroom integration within verified pathways that districts can fund at scale. Discovery Education connects future-ready skills through IBM SkillsBuild PD and in-workflow AI TeacherTools that place guidance near instruction. China’s 2026 plan requires AI competencies in teacher qualification exams by 2030, which sets a system requirement for AI-focused PD scaffolded across teacher careers. Cybersecurity and privacy modules gain time on agendas due to incidents and policy attention, which elevates the category in district PD plans in 2026. These trends reallocate hours toward AI ethics, privacy, and applied workflows inside the K-12 technology training for teachers market.
STEM, coding, and robotics remain steady across middle and high school as endorsement rules spread, which maintains demand for facilitator-led workshops and hybrid intensives. LMS utilization is maturing as vendors embed onboarding into licenses and release incremental AI features that require targeted refreshers rather than long courses in 2026. Within emerging tech, AI is the anchor, while AR and VR are deployed in curated ways that align with course goals and budgets. Ecosystems that route PD recommendations into teacher dashboards and unified profiles, such as the Otus and Discovery Education partnership, improve relevancy and actionability. Credible, credential-bearing AI courses explain why the emerging tech cluster holds the fastest outlook in the K-12 technology training for teachers market to 2031.
By End-User Level: High School Teachers Chase Advanced CS Pathways
Elementary and primary teachers held 31.38% share in 2025, while high school teachers are projected to grow at 11.35% CAGR as advanced CS pathways, AP-level courses, and AI-rich subject integration expand across schedules. The K-12 technology training for teachers market leans into secondary credentials and curriculum workshops that satisfy endorsement rules while improving classroom practice in higher-level math, science, and ELA with AI-aligned planning tools. Districts are pairing AI literacy with discipline-specific tasks so high school educators can adapt rubrics and projects with safe-use principles embedded in daily routines. Associations deliver facilitator-led PD that aligns with entry- and advanced-level CS courses, strengthening the bench for secondary staffing. Elementary PD focuses on foundational fluency through interactive displays, classroom platforms, early coding aligned with age-appropriate standards, and simple robotics kits. Special education teams are receiving more focused PD on accessible materials and AI-informed documentation for personalization and parent communication in 2026.
High school demand tracks the rise in CS endorsements and AI-infused subject planning, while elementary teachers sustain a baseline of broad technology fluency for daily classroom tools. States continue to refine endorsement language and standards, and districts translate those updates into targeted secondary cohorts with verified assessments and course approvals. Vendor-led PD on data privacy and cybersecurity is spreading across general and special education contexts as districts embed safe-use and compliance readiness into standard practice. Providers now customize evidence portfolios by grade band and subject, helping teachers complete PD sequences faster without redundant tasks in the K-12 technology training for teachers market.
Geography Analysis
North America accounted for 37.35% of the K-12 technology training for teachers market share in 2025 as districts aligned PD with multi-year ecosystem contracts and managed post-ESSER transitions that affected provider payments and renewals. State-level CS endorsement policies strengthened demand for structured cohorts that document competencies and satisfy staffing plans across middle and high school. Interoperability standards such as OneRoster and Ed-Fi continued to shape credential portability and rostering practices, simplifying district audits and compliance. Vendor events and open-lab formats accelerated the adoption of new features as teachers received hands-on guidance from engineers on the exact tools they use every day. Ownership changes at major platforms in 2024 reinforced the role of bundled PD as a retention lever across large districts in 2026.
Asia-Pacific is projected to expand at a 13.38% CAGR through 2031 as national programs prioritize AI literacy and credential-aligned training for teachers. The K-12 technology training for teachers market in Asia-Pacific is set to grow as ministries embed credentials into national platforms and build peer communities that sustain adoption. China’s AI Plus Education plan mandates AI competencies in teacher qualification exams by 2030, which anchors long-term PD demand. Regional exchanges such as Learning Impact Japan spread standards, work, and PD design practices that support interoperability and evidence tracking. SEAMEO-led initiatives and national projects continue to emphasize blended formats and competency frameworks that scale across diverse school systems.
Europe maintains steady adoption as member states align with DigCompEdu and expand hybrid PD that combines live cohorts and asynchronous modules anchored to national platforms. Device and display ecosystems recognize exemplary schools where ongoing PD and teacher communities drive sustained use and classroom innovation. Latin America advances CS and AI teacher training through public-private programs and regional partners that deliver facilitated workshops in secondary and middle grades. In the Middle East and Africa, recognition programs and platform partnerships encourage formal PD communities, while budgets and connectivity shape local pacing and scale. These regional patterns collectively support a diverse growth outlook for the K-12 technology training for teachers market in 2026.

Competitive Landscape
The K-12 technology training for teachers market features platform incumbents, association-led credentials, and content ecosystems competing for PD budgets with complementary strengths in 2026. Platform providers embed training into SIS and LMS contracts to drive adoption and renewals, a strategy reinforced by recent ownership transitions and AI feature rollouts. Content publishers extend into PD with AI-aligned modules and in-workflow supports that increase usage and address safe practice. District buyers now prioritize compliance readiness, interoperability, and credential portability as top selection criteria for 2026 contracts. These pressures reward partners that document impact and offer verifiable credentials across employers and states.
New entrants scale through short, embedded modules that fit contract time and address practical tasks, improving participation without expanding duty hours. Association credentials deliver widely recognized signals for classroom competence, which secondary teachers use for endorsement pathways and advancement. Facilitated CS workshops through regional networks remain a backbone for secondary upskilling and course approvals, which diversifies the vendor mix in district plans. Together, these formats balance ecosystem scale with targeted instructional support that districts value for specific needs inside the K-12 technology training for teachers market. The result is moderate fragmentation, with multiple credible routes to verified skills in 2026.
Ecosystem partnerships and M&A this year emphasize data integration and AI-driven insights as differentiators. Discovery Education’s connected ecosystem with Otus and IBM SkillsBuild ties PD directly to resources and student profile data, streamlining targeted supports. Coaching and district services firms are combining capabilities to support change management, leadership development, and AI-enabled tools for teacher growth. Analytics and curriculum providers are unifying student data for intervention workflows that teachers can manage without leaving core platforms. Interoperability support and privacy assurances remain contract-critical and also reduce retraining overhead for educators who face frequent LMS changes.
K-12 Technology Training For Teachers Industry Leaders
Google for Education
Microsoft Education
Apple Education
Discovery Education
Code.org (Teacher Professional Learning)
- *Disclaimer: Major Players sorted in no particular order

Recent Industry Developments
- April 2026: Otus and Discovery Education expanded integration to deliver AI-powered instructional recommendations using unified student profiles and standards-aligned content, enabling real-time, workflow-native personalized instruction without platform switching.
- April 2026: engage2learn acquired Education Elements, combining AI-enabled teacher development, leadership coaching, and data analytics with consultancy expertise to expand district-level instructional leadership capabilities.
- April 2026: China issued the “AI + Education Action Plan,” mandating nationwide AI integration in K-12 curriculum, teacher certification requirements, and structured AI literacy training with AI-enabled assessment systems by 2030.
- March 2026: Fullmind acquired Elevate K-12, forming the largest United States virtual K-12 provider serving 225+ districts with expanded live certified-teacher instruction and special education, summer, and homebound programs.


Global K-12 Technology Training For Teachers Market Report Scope
K-12 Technology Training for Teachers Market refers to the ecosystem of services, platforms, and programs that help school teachers in kindergarten through 12th grade learn how to effectively use digital tools, software, and educational technologies in classroom teaching and student learning.
The K-12 Technology Training For Teachers Market Report is Segmented by Training Modality (Online Self-paced, Instructor-led Virtual, Blended, On-site Workshops), Delivery Mode (Subscription-based PD Platforms, Pay-as-you-go Courses, District-wide Contracts, Certification Programs), Technology Focus (Basic Digital Literacy, STEM / Coding & Robotics, LMS Utilisation, Emerging Tech (AR/VR, AI), Cyber-security & Data Privacy), End-User Level (Elementary School Teachers, Middle School Teachers, High School Teachers, Special Education Teachers), and Geography (North America (Canada, United States, Mexico), South America (Brazil, Peru, Chile, Argentina, Rest of South America), Europe (United Kingdom, Germany, France, Spain, Italy, BENELUX, NORDICS, Rest of Europe), Asia-Pacific (India, China, Japan, Australia, South Korea, South-East Asia, Rest of Asia-Pacific), Middle East & Africa (United Arab Emirates, Saudi Arabia, South Africa, Nigeria, Rest of Middle East & Africa)). The Market Forecasts are Provided in Terms of Value (USD).
| Online Self-paced |
| Instructor-led Virtual |
| Blended |
| On-site Workshops |
| Subscription-based PD Platforms |
| Pay-as-you-go Courses |
| District-wide Contracts |
| Certification Programs |
| Basic Digital Literacy |
| STEM / Coding & Robotics |
| LMS Utilisation |
| Emerging Tech (AR/VR, AI) |
| Cyber-security & Data Privacy |
| Elementary School Teachers |
| Middle School Teachers |
| High School Teachers |
| Special Education Teachers |
| North America | Canada |
| United States | |
| Mexico | |
| South America | Brazil |
| Peru | |
| Chile | |
| Argentina | |
| Rest of South America | |
| Europe | United Kingdom |
| Germany | |
| France | |
| Spain | |
| Italy | |
| BENELUX | |
| NORDICS | |
| Rest of Europe | |
| Asia-Pacific | India |
| China | |
| Japan | |
| Australia | |
| South Korea | |
| South-East Asia | |
| Rest of Asia-Pacific | |
| Middle East & Africa | United Arab Emirates |
| Saudi Arabia | |
| South Africa | |
| Nigeria | |
| Rest of Middle East & Africa |
| By Training Modality | Online Self-paced | |
| Instructor-led Virtual | ||
| Blended | ||
| On-site Workshops | ||
| By Delivery Mode | Subscription-based PD Platforms | |
| Pay-as-you-go Courses | ||
| District-wide Contracts | ||
| Certification Programs | ||
| By Technology Focus | Basic Digital Literacy | |
| STEM / Coding & Robotics | ||
| LMS Utilisation | ||
| Emerging Tech (AR/VR, AI) | ||
| Cyber-security & Data Privacy | ||
| By End-User Level | Elementary School Teachers | |
| Middle School Teachers | ||
| High School Teachers | ||
| Special Education Teachers | ||
| By Geography | North America | Canada |
| United States | ||
| Mexico | ||
| South America | Brazil | |
| Peru | ||
| Chile | ||
| Argentina | ||
| Rest of South America | ||
| Europe | United Kingdom | |
| Germany | ||
| France | ||
| Spain | ||
| Italy | ||
| BENELUX | ||
| NORDICS | ||
| Rest of Europe | ||
| Asia-Pacific | India | |
| China | ||
| Japan | ||
| Australia | ||
| South Korea | ||
| South-East Asia | ||
| Rest of Asia-Pacific | ||
| Middle East & Africa | United Arab Emirates | |
| Saudi Arabia | ||
| South Africa | ||
| Nigeria | ||
| Rest of Middle East & Africa | ||


Key Questions Answered in the Report
What is the 2031 outlook for the K-12 technology training for teachers market?
It is forecast to reach USD 7.13 billion by 2031 from USD 4.75 billion in 2026 at an 8.47% CAGR over 2026-2031.
Which training modality is projected to grow fastest through 2031?
Blended learning holds the fastest projected rate at a 14.36% CAGR through 2031 as districts combine live cohorts with asynchronous practice.
Which delivery model is gaining momentum with districts in 2026?
Subscription and certification platforms are projected to grow at 15.44% CAGR, while district-wide contracts still hold the largest share from 2025.
Which region shows the strongest growth trajectory to 2031?
Asia-Pacific is projected to expand at a 13.38% CAGR supported by national AI literacy programs and credential-aligned training.
Which technology focus area is expanding the quickest in 2026?
Emerging tech that includes AI, AR, or VR, data privacy, and cybersecurity holds the fastest outlook with a 17.44% CAGR to 2031.
Page last updated on:


