Joint Replacement Market Size and Share
Market Overview
| Study Period | 2020 - 2031 |
|---|---|
| Market Size (2026) | USD 20.84 Billion |
| Market Size (2031) | USD 25.77 Billion |
| Growth Rate (2026 - 2031) | 4.30% CAGR |
| Fastest Growing Market | Asia Pacific |
| Largest Market | North America |
| Market Concentration | Medium |
Major Players *Disclaimer: Major Players sorted in no particular order Image © Mordor Intelligence. Reuse requires attribution under CC BY 4.0. | |
Joint Replacement Market Analysis by Mordor Intelligence
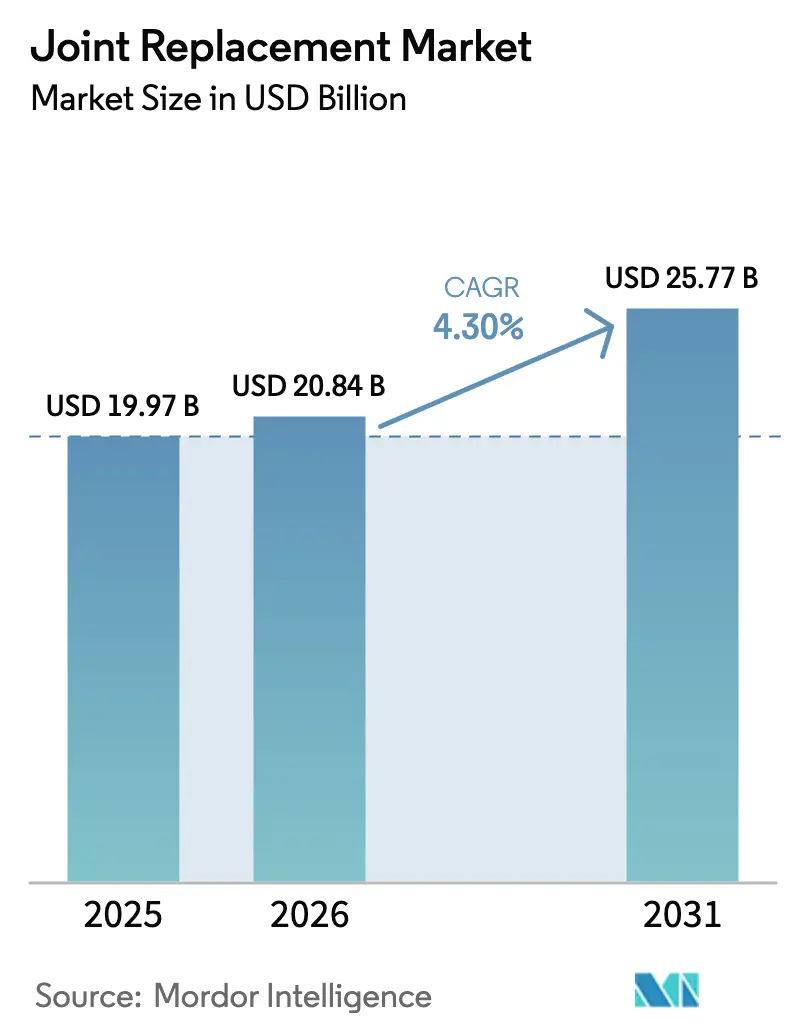
The Joint Replacement Market size is expected to grow from USD 19.97 billion in 2025 to USD 20.84 billion in 2026 and is forecast to reach USD 25.77 billion by 2031 at 4.30% CAGR over 2026-2031.
The joint replacement market is expanding as aging populations, rising obesity, and broadened insurance coverage drive procedure demand. Robotic-assisted platforms, 3D-printed implants, and fast-track rehabilitation protocols are improving operating efficiency and shortening hospital stays, which supports wider payer adoption. Integrated bundled-payment programs in the United States and Europe reward providers that reduce 90-day readmissions, prompting hospitals to invest in precision technologies that cut complications. Meanwhile, supply-chain reshoring to Costa Rica and Eastern Europe reduces tariff exposure and transport delays, ensuring steady implant availability. Competitive dynamics now revolve around ecosystem lock-in, where leading vendors bundle robots, implants, software, and analytics to secure surgeon loyalty, giving the joint replacement market sustained pricing power despite reimbursement pressure.
Key Report Takeaways
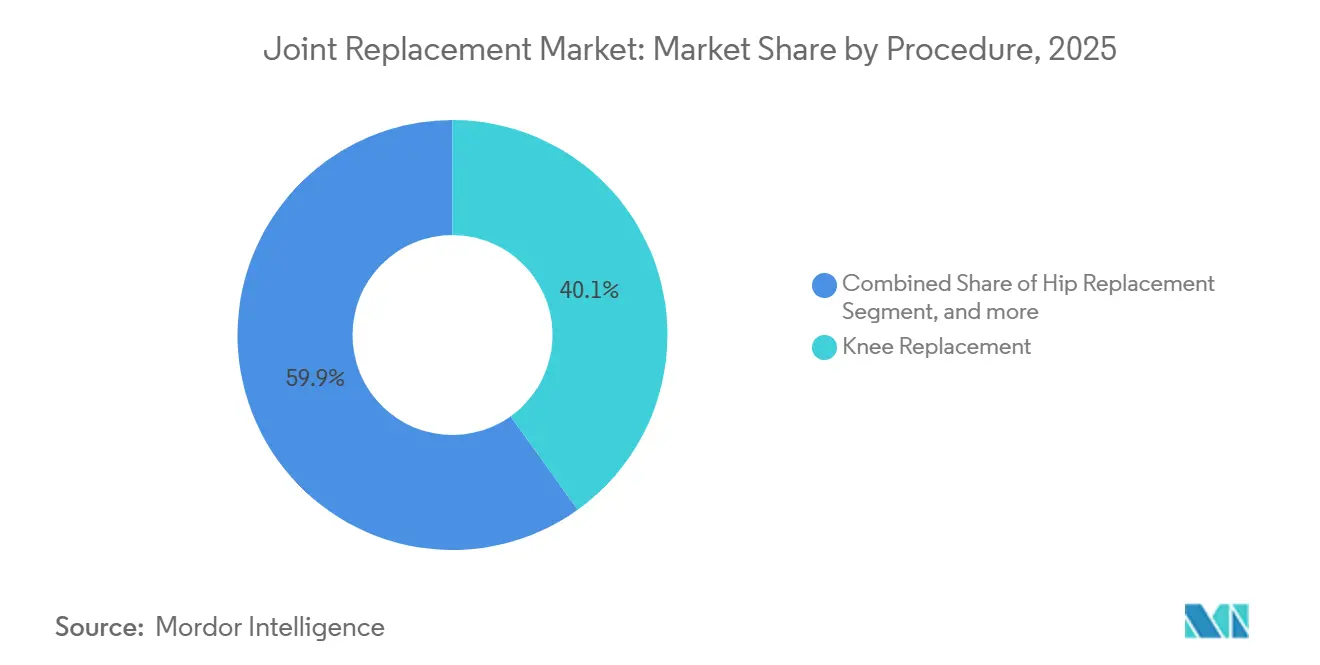
- By procedure, knee replacement captured a 40.1% joint replacement market share in 2025, while shoulder replacement recorded the fastest growth at a 5.1% CAGR through 2031.
- By product, implants accounted for 61% of the joint replacement market size in 2025; bone grafts and substitutes are advancing at a 4.9% CAGR to 2031.
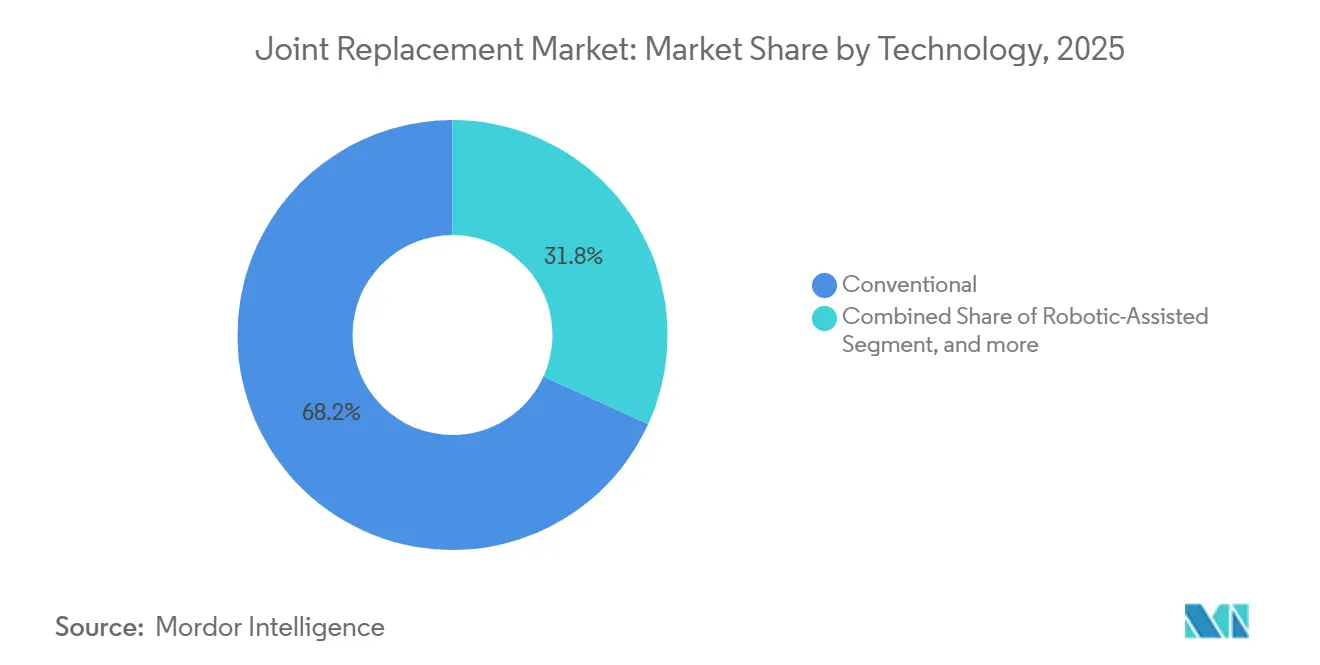
- By technology, conventional techniques held 68.2% of revenue in 2025, whereas robotic-assisted surgery is rising at a 4.7% CAGR to 2031.
- By end user, hospitals commanded 59.8% joint replacement market share in 2025, and ambulatory surgery centers are projected to grow at 5.2% through 2031.
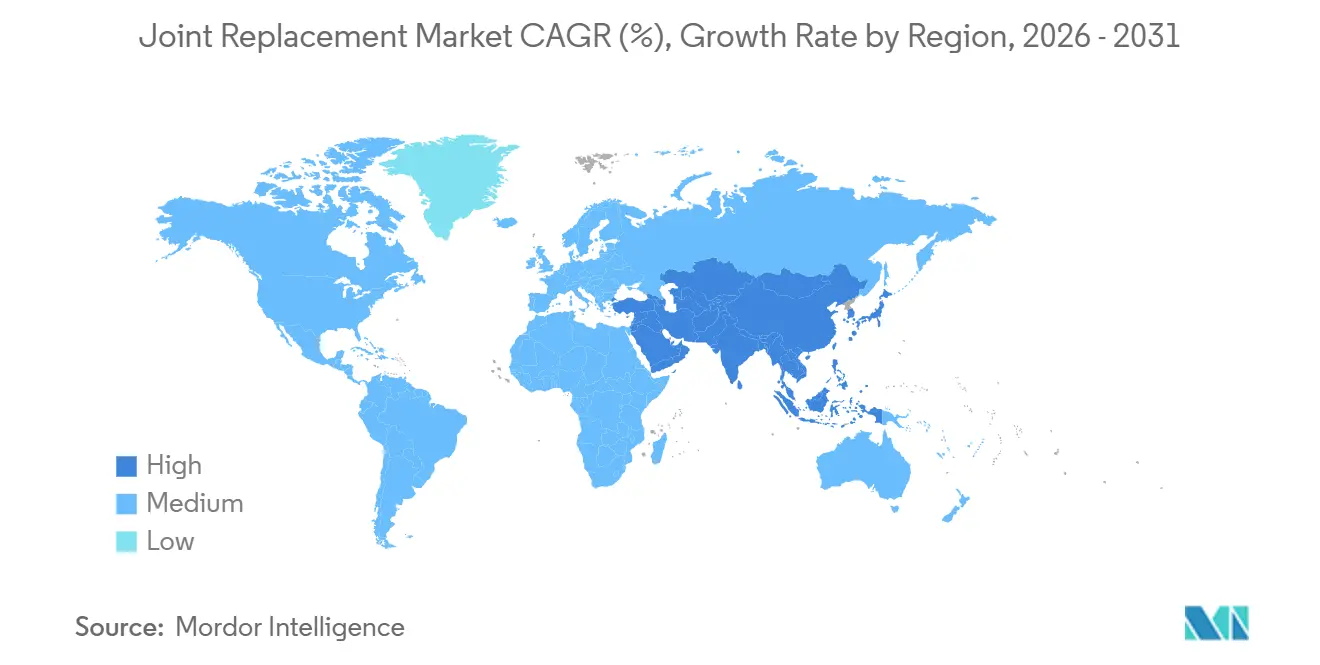
- By geography, North America led with 45.6% of global revenue in 2025; Asia-Pacific is expected to post a 4.5% CAGR to 2031, the highest among all regions.
Note: Market size and forecast figures in this report are generated using Mordor Intelligence’s proprietary estimation framework, updated with the latest available data and insights as of January 2026.
Global Joint Replacement Market Trends and Insights
Drivers Impact Analysis*
| Driver | (~) % Impact on CAGR Forecast | Geographic Relevance | Impact Timeline |
|---|---|---|---|
| High Osteoarthritis Prevalence | +0.9% | Global, with acute burden in high-income Asia-Pacific (Japan, South Korea, Singapore) and North America | Long term (≥ 4 years) |
| Rising Geriatric Population | +0.8% | Global, with peak intensity in Japan (29% aged 65+), Europe (21% aged 65+), and China (projected 402 million aged 70+ by 2050) | Long term (≥ 4 years) |
| Growing Preference for Minimally-Invasive and Robotic-Assisted TJA | +0.9% | North America and Europe core, expanding into APAC urban centers (Shanghai, Seoul, Tokyo) | Medium term (2-4 years) |
| Accelerated Post-Op Rehab Protocols Boosting Outpatient TJA Volumes | +0.7% | United States (Medicare ASC expansion), Australia, Germany, and Netherlands | Short term (≤ 2 years) |
| 3D-Printed Patient-Specific Implants Cutting Revision Risk | +0.4% | North America and Europe, with early adoption in Singapore and UAE | Medium term (2-4 years) |
| Strategic Reshoring of Titanium and Cobalt Alloy Supply Chains | +0.3% | North America (Costa Rica nearshoring), Europe (Eastern European hubs), reducing Asia-Pacific dependence | Medium term (2-4 years) |
| Source: Mordor Intelligence | |||
High Osteoarthritis Prevalence
The Global Burden of Disease study counted 607 million osteoarthritis cases in 2021, and forecasts a 75% increase in knee disease by 2050 as people live longer and body-mass-index levels rise. Furthermore, the prevalence of osteoarthritis increases with age. Japan already has 29% of its citizens aged 65 plus, while South Korea will be super-aged in 2025, producing steady joint replacement market demand. Obesity adds complexity and cost, because heavier patients need reinforced implants and face higher revision risk. China’s over-70 cohort is set to reach 402 million by 2050, yet procedure rates remain one-fifth of U.S. levels, creating latent joint replacement market upside once insurance reforms mature. The combined effects of aging, obesity, and broader coverage underpin long-run volume growth, although surgeon shortages and sterile processing capacity could slow uptake in some emerging economies.
Growing Preference for Minimally Invasive and Robotic-Assisted TJA
Robotic total knee arthroplasty reached economic break-even at only 24–50 cases annually in 2024, versus 100-plus in 2020, as platform costs fell and OR times shortened. Community hospitals and ASCs now adopt robots, while vendors bundle implants and software to lock in repeat business. Clinical data show better alignment and lower dislocation rates, pushing payers to reimburse robotic procedures that shorten stays and reduce 90-day readmissions. NICE guidance in 2025 endorsed robotic orthopedics, prompting NHS procurement plans [1]National Institute for Health and Care Excellence, “Robotic-assisted surgery for orthopedic procedures,” nice.org.uk. As evidence accumulates, hospitals without robotic capacity risk losing referrals, keeping the joint replacement market on a technology-upgrade cycle.
Accelerated Post-Op Rehab Protocols Boosting Outpatient TJA Volumes
CMS added total knee procedures to ASC coverage in 2018 and total hip in 2020; same-day discharge now reaches 30–60% at high-volume U.S. centers [2]Centers for Medicare & Medicaid Services, “Ambulatory Surgical Center Payment,” cms.gov. Enhanced recovery bundles have trimmed average stays from three days to under 24 hours and cut per-episode costs by up to 60%, making ASCs attractive for low-risk patients. Bundled payments penalize readmissions, so hospitals steer healthier candidates to outpatient facilities and reserve beds for complex cases. The ASC channel, therefore, expands faster than the overall joint replacement market, pressuring implant vendors to supply streamlined, lower-cost instrument sets.
3D-Printed Patient-Specific Implants Cutting Revision Risk
FDA clearances for restor3d’s total talus and 3D Systems’ ankle guides validated additive manufacturing for anatomically challenging joints. Ten-year survivorship for 3D-printed cementless knees hit 98.1% in 2024, beating conventional designs by three points. Because revisions cost up to USD 80,000, payers accept a 15–20% implant premium to avoid failures. Regulatory pathways still differ across regions, but lattice structures that improve bone ingrowth are moving toward ISO standardization, paving the way for broader uptake and sustaining growth in the joint replacement market.
Restraints Impact Analysis*
| Restraint | (~) % Impact on CAGR Forecast | Geographic Relevance | Impact Timeline |
|---|---|---|---|
| High Procedure and Implant Cost | -0.4% | Global, with acute impact in low- and middle-income countries (India, Brazil, South Africa, Indonesia) | Short term (≤ 2 years) |
| Availability of Pharmacological and Arthroscopic Alternatives | -0.3% | North America and Europe (mature markets with conservative treatment protocols), emerging in APAC | Short term (≤ 2 years) |
| Revision-Surgery Burden from Metal Hypersensitivity Claims | -0.3% | North America and Europe (legacy metal-on-metal cohorts), with spillover litigation risks globally | Medium term (2-4 years) |
| Capacity Bottlenecks in Sterilization and Clean-Room Machining | -0.2% | North America (ethylene oxide facility closures), APAC (infrastructure gaps in tier-2 cities) | Short term (≤ 2 years) |
| Source: Mordor Intelligence | |||
High Procedure & Implant Cost
U.S. total knee arthroplasty costs USD 30,000–50,000, while implants alone run USD 3,000–7,000, limiting access for under-insured groups. Many patients travel to India or Thailand, where procedures cost 70–90% less, diverting volumes from domestic providers. Spending on viscosupplementation and platelet-rich plasma hit USD 2 billion in 2024, even though evidence is inconsistent, causing patients to delay surgery. Payers promote conservative care to defer expense, tempering near-term joint replacement market growth.
Revision-Surgery Burden from Metal Hypersensitivity Claims
Metal-on-metal hips continue to fail, with hypersensitivity in up to 15% of recipients, forcing costly revisions. The FDA spotlighted a 31.8% ten-year failure rate for the Hintermann H3 ankle, heightening regulatory scrutiny. U.S. ethylene-oxide capacity fell 20% after Sterigenics closures, forcing costly freight to offshore sterilizers and delaying shipments. Cobalt price spikes and tight machining capacity expose supply-chain fragility, adding cost and dampening the joint replacement market outlook until redundancy improves.
*Our forecasts treat driver/restraint impacts as directional, not additive. The impact forecasts reflect baseline growth, mix effects, and variable interactions.
Segment Analysis
By Procedure: Shoulder Replacement Outpaces Mature Knee Segment
Shoulder procedures are growing at a 5.1% CAGR to 2031 as reverse designs address fractures and revisions once treated non-operatively. FDA clearance of Stryker’s Aequalis Perform+ and Zimmer’s glenoid reconstruction solutions widened indications. Ten-year survivorship reaches 95%, shifting surgeons from anatomic models for patients over 70. Knee replacement still held 40.1% joint replacement market share in 2025 due to consistent Medicare payment, yet its growth slows as U.S. penetration nears northern European saturation levels. Hip arthroplasty benefits from robotic adoption that cuts dislocations by 40%, while ankle and elbow remain niche but may expand as 3D-printed devices solve complex anatomies.


By Product: Bone Grafts Gain Share as Revision Volumes Climb
Synthetic and allograft substitutes are advancing at 4.9% CAGR as older implants reach end-of-life. FDA clearances for demineralized matrices and calcium phosphate ceramics bolster surgeon confidence [3]U.S. Food and Drug Administration, “510(k) Clearances – Bone Graft Substitutes,” fda.gov. Improved donor screening lowered infection risk, but tight supply gives tissue banks pricing power. Implants captured 61% of the joint replacement market size in 2025, though share may slip as graft content per case rises. Highly cross-linked polyethylene and ceramic heads halve wear, while single-use instrument kits cut ASC sterilization costs.
By Technology: Robotic Platforms Erode Conventional Share
Robotic systems grow at 4.7% CAGR as capital hurdles drop and reimbursement recognizes lower readmissions. NICE approval accelerates European uptake, and U.S. ASCs install robots to attract commercially insured patients. Conventional methods still control 68.2% revenue, but their share declines as hospitals look to shorten stays and align with bundled-payment incentives. Augmented-reality navigation offers a lower-cost alternative for mid-volume centers, yet outcome data remain mixed, limiting immediate impact on the joint replacement market.
By End User: ASCs Capture Share Under Bundled Payments
Ambulatory centers rise 5.2% annually, supported by protocols that discharge patients in under a day and cut costs by half. Roughly 60% of hip and knee candidates meet current ASC criteria, a ceiling likely to expand with better anesthesia. Hospitals keep complex revisions and high-BMI cases, preserving 59.8% revenue in 2025, but must differentiate with robotics and tertiary care to offset volume shifts. Specialty orthopedic centers offer a hybrid model of efficiency and critical-care backup, reinforcing a multi-channel joint replacement market.
Geography Analysis
North America held 45.6% of global revenue in 2025, supported by the United States’ high procedure rate of 7.2 total knee arthroplasties per 1,000 people and the sale of robotic consoles priced above USD 1 million each. After the Centers for Medicare & Medicaid Services removed total hip arthroplasty from the inpatient-only list in January 2024, more surgeries shifted to outpatient settings, tightening hospital margins and prompting distributor consolidation. Canada’s publicly funded system posted a 12-month median wait for hip replacement in 2024, steering patients to U.S. ambulatory surgery centers near the border. Mexico’s medical-tourism hubs in Tijuana and Monterrey treated 45,000 joint-replacement patients in 2024, offering ISO 13485-certified implants at half of U.S. prices. Regional growth faces a supply pinch because the FDA issued 23 warning letters for excess ethylene oxide residue in 2024, delaying new product launches by up to nine months.
Asia-Pacific is growing at a 4.5% CAGR, the fastest among all regions. Japan’s super-aged profile, with 29% of residents at least 65 in 2024, helped lift total knee procedures to 180,000 that year, a 12% rise since 2020, after reimbursement changes rewarded cementless porous implants. China expanded insurance to cover 95% of urban residents for joint replacement by 2025, adding further momentum. India drew 120,000 overseas patients to Chennai and Mumbai in 2024, thanks to JCI-accredited hospitals and implant prices 60% below Western levels. South Korea’s insurer began paying for reverse shoulder arthroplasty in 2025, opening access for rotator-cuff cases, while Australia cut approval times for robotic systems to nine months in 2024, letting firms launch locally in the same quarter as U.S. and EU clearances.
In Europe, Medical Device Regulation compliance now averages EUR 2 million per product family and extends CE-mark timelines to about two years, slowing growth. Germany and France still perform many hip revisions: the German registry logged 28,000 in 2024, 40% tied to cobalt-chromium debris from older metal-on-metal implants. The United Kingdom’s National Health Service negotiated a 15% price cut on knee implants for 2025, pushing manufacturers to rely on private-pay volumes to protect margins. The Middle East and Africa gain from government spending. Saudi Arabia’s Vision 2030 commits USD 10 billion to build orthopedic centers, aiming for 50,000 annual joint replacements by 2028. South America centers on Brazil, where private insurance covered 27% of citizens in 2024. Public hospitals face wait times longer than 18 months, so private facilities capture demand for premium implants.

Competitive Landscape
Zimmer Biomet, Stryker, and DePuy Synthes together control a majority of global revenue, reflecting a moderately concentrated joint replacement market. Their integrated robotic platforms create high switching costs and recurring software fees. Stryker’s Mako achieved 1,400 global installs by mid-2024, and robotic cases now make up 18% of its U.S. knee volumes. Smith & Nephew, Johnson & Johnson, and others are reshoring component machining to Costa Rica and Eastern Europe to cut transit time and tariff risk. Niche players such as Conformis and Medacta pursue patient-specific and augmented-reality niches, while new entrants like Globus aim to leverage existing spine robots for knee modules by 2026. Quality lapses, exemplified by Exactech’s recall of 150,000 polyethylene components, underscore reputational stakes in a safety-critical joint replacement market.
Joint Replacement Industry Leaders
Stryker Corporation
Zimmer Biomet Holdings, Inc.
Depuy Synthes (Johnson & Johnson)
Smith & Nephew
B. Braun SE
- *Disclaimer: Major Players sorted in no particular order

Recent Industry Developments
- October 2025: Zimmer Biomet received FDA Breakthrough Device Designation in October 2025 for an iodine-treated total hip replacement system aimed at addressing infection risks.
- October 2025: Johnson & Johnson MedTech announced its plan to spin off its orthopedics business into a new standalone company, DePuy Synthes.
- January 2025: Alkem MedTech and Exactech Inc. partnered to locally manufacture and market Exactech's joint replacement systems in India.


Research Methodology Framework and Report Scope
Market Definitions and Key Coverage
Our study defines the joint replacement market as all implants, grafts, and dedicated instruments used to fully or partially replace hip, knee, shoulder, ankle, elbow, or other synovial joints in elective or revision procedures. These devices restore mobility and relieve end-stage arthritic pain.
Scope exclusion: trauma fixation hardware that is not intended for arthroplasty is kept outside the model.
Segmentation Overview
- By Procedure
- Hip Replacement
- Knee Replacement
- Shoulder Replacement
- Ankle Replacement
- Elbow Replacement
- Others
- By Product
- Implants
- Metallic
- Ceramic
- Polymeric & Hybrid Biomaterials
- Bone Grafts & Substitutes
- Autograft
- Allograft
- Synthetic
- Fixation & Instrumentation
- Others
- Implants
- By Technology
- Conventional
- Robotic-Assisted
- Navigation / AR-Guided
- By End User
- Hospitals
- Specialty Orthopaedic Centres
- Ambulatory Surgery Centres
- By Geography
- North America
- United States
- Canada
- Mexico
- Europe
- Germany
- United Kingdom
- France
- Italy
- Spain
- Rest of Europe
- Asia-Pacific
- China
- Japan
- India
- Australia
- South Korea
- Rest of Asia-Pacific
- Middle East & Africa
- GCC
- South Africa
- Rest of Middle East & Africa
- South America
- Brazil
- Argentina
- Rest of South America
- North America
Detailed Research Methodology and Data Validation
Primary Research
Mordor analysts interview orthopedic surgeons, ASC administrators, procurement officers, and biomaterial engineers across North America, Europe, Asia-Pacific, and selected emerging markets. Discussions clarify registry blind spots, average selling prices, adoption of robotic systems, and likely reimbursement shifts, which are then mapped back into the model.
Desk Research
We first assemble a global evidence base that blends public health and trade statistics. Registries such as the American Joint Replacement Registry, Australia's AOANJRR, and the UK National Joint Registry supply verified procedure volumes, while WHO, OECD Health Stats, and CDC datasets anchor demographic and disease incidence figures. Cost and pricing cues come from CMS outpatient files, national tariff schedules, and import-export codes. Company filings screened through D&B Hoovers and headline trends gathered via Dow Jones Factiva round out supply-side intelligence. These examples illustrate, not exhaust, the range of secondary references consulted.
Market-Sizing & Forecasting
A blended top-down/bottom-up logic is applied. National procedure volumes are reconstructed from registry counts, discharge data, and import statistics; multiplying typical implant sets per procedure by consensus ASPs yields an initial value pool. Supplier roll-ups and channel checks provide a bottom-up sense check, and gaps are smoothed using weighted averages. Key variables tracked include osteoarthritis prevalence, 65+ population growth, revision-to-primary ratios, robotic penetration, ASC share, and metal price trends that influence ASP drift. Multivariate regression, supplemented by scenario analysis for reimbursement policy swings, generates the 2025-2030 outlook.
Data Validation & Update Cycle
Output passes three layers of review: automated variance flags, peer analyst cross-checks, and a senior sign-off. Models refresh annually; interim updates trigger when material events, such as major product recalls, tariff shifts, or regulatory approvals, alter baseline assumptions. A final walk-through before publication ensures clients receive the freshest view.
Why Mordor's Joint Replacement Baseline Commands Reliability
Published values often diverge because firms bundle different joints, apply distinct price curves, or freeze data for several years before revisiting it.
Key gap drivers include whether extremity implants are counted, if revision procedures are priced the same as primaries, how robotic-related ASP premiums are applied, and the cadence at which foreign-exchange swings are rebased.
Mordor's page scopes every joint category, refreshes annually, and aligns currency at the latest constant-dollar rates, which explains the spread seen below.
Benchmark comparison
| Market Size | Anonymized source | Primary gap driver |
|---|---|---|
| USD 19.98 B (2025) | Mordor Intelligence | - |
| USD 23.42 B (2024) | Global Consultancy A | Excludes shoulder, elbow; inflates value by applying single 15% ASP uplift to knee and hip only |
| USD 20.40 B (2024) | Trade Journal B | Counts hospital spend only; omits ASC volumes and uses older 2022 exchange rates |
The comparison shows that once scope creep and outdated price factors are removed, competing totals gravitate toward our disciplined baseline, making Mordor's figures the most transparent and reproducible starting point for planners.


Key Questions Answered in the Report
How large is the Joint Replacement market ?
The Joint Replacement market size is expected to reach USD 20.84 billion in 2026 and is projected to grow at a 4.30% CAGR to USD 25.77 billion by 2031.
Which procedure type is expanding fastest in Joint Replacement market?
Shoulder replacement is the fastest-growing segment, advancing at a 5.1% CAGR through 2031 as reverse designs address fractures and revisions.
Why are ambulatory surgery centers gaining share in joint replacement?
Bundled payments and fast-track rehab enable same-day discharge, cutting per-episode costs by up to 60% and driving a 5.2% CAGR for ASCs.
What role do robotic systems play in the Joint Replacement market?
Robots reduce alignment errors, shorten hospital stays, and now reach cost break-even at 24–50 cases annually, fueling a 4.7% CAGR for robotic procedures.
Which region offers the highest growth potential going forward?
Asia-Pacific, led by China and India, is forecast to grow at 4.5% through 2031 as aging populations, rising incomes, and medical tourism boost volumes.
How concentrated is competition among implant makers?
Zimmer Biomet, Stryker, and DePuy Synthes control a majority of revenue, giving the market moderate concentration but still room for niche innovators.
Page last updated on:


