Joint Reconstruction Devices Market Size and Share
Market Overview
| Study Period | 2019 - 2030 |
|---|---|
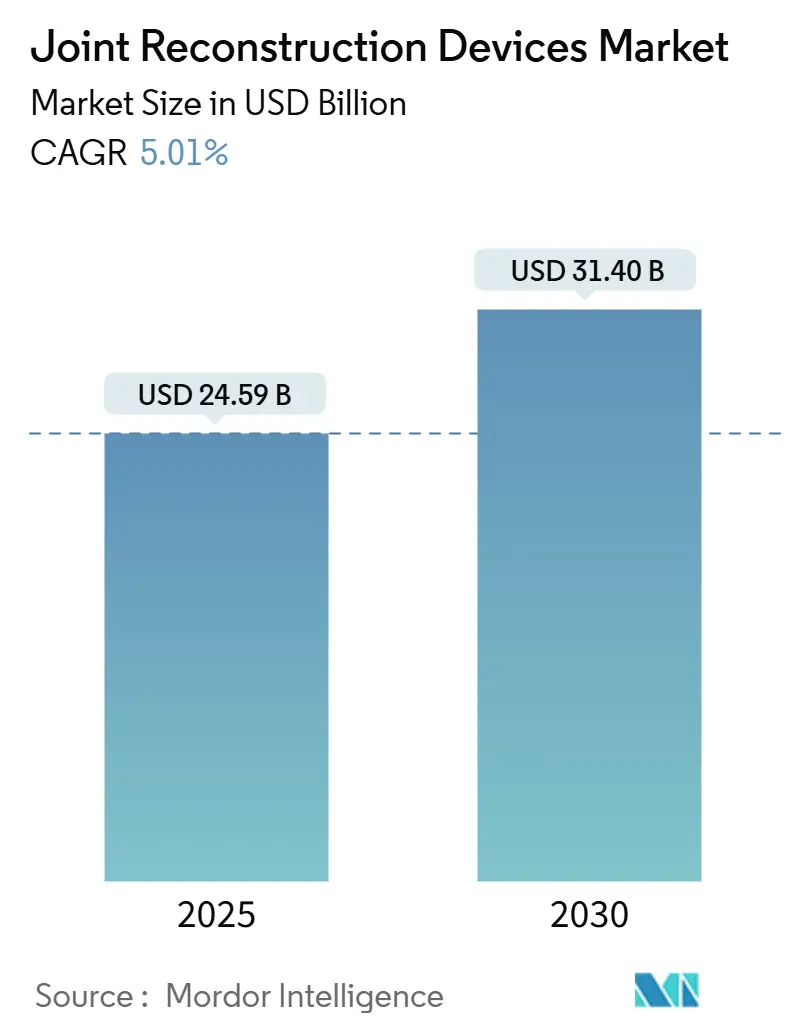
| Market Size (2025) | USD 24.59 Billion |
| Market Size (2030) | USD 31.40 Billion |
| Growth Rate (2025 - 2030) | 5.01% CAGR |
| Fastest Growing Market | Asia Pacific |
| Largest Market | North America |
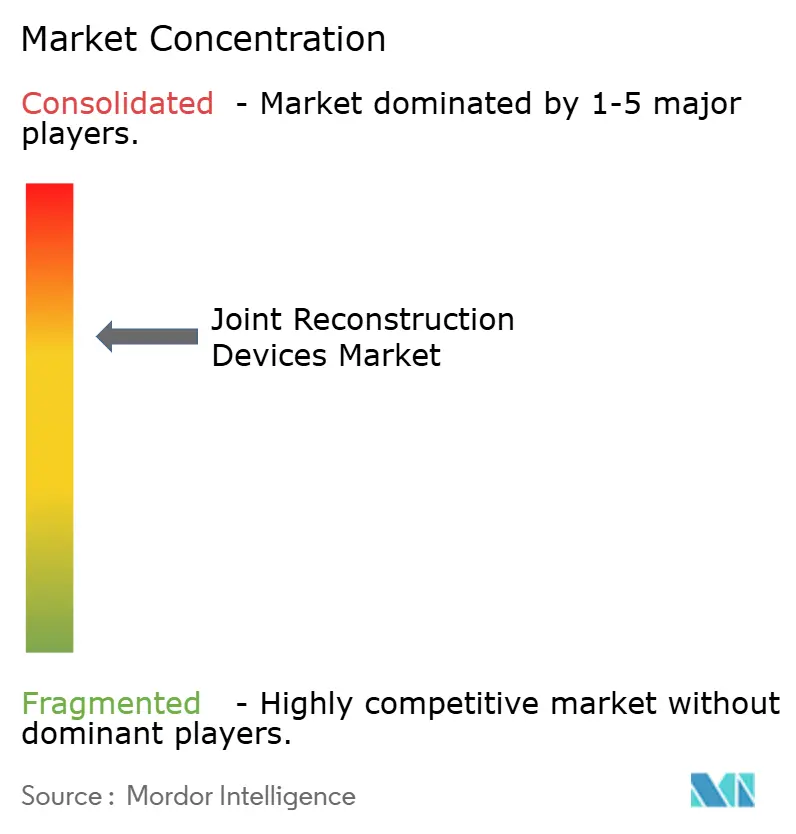
| Market Concentration | Medium |
Major Players *Disclaimer: Major Players sorted in no particular order Image © Mordor Intelligence. Reuse requires attribution under CC BY 4.0. | |
Joint Reconstruction Devices Market Analysis by Mordor Intelligence
The joint reconstruction devices market size reached USD 24.59 billion in 2025 and is forecast to advance to USD 31.40 billion by 2030, reflecting a steady 5.01% CAGR. This trajectory signals a shift from procedure-volume growth toward value-based differentiation, as manufacturers compete on technological depth and clinical evidence instead of unit counts. Wider life expectancy and a mounting global burden of osteoarthritis underpin reliable demand, yet tightening payer budgets require every new system to show measurable outcome gains that justify its price. Robotics‐assisted navigation, AI-guided planning, and patient-specific implants are no longer niche extras; they are becoming critical purchasing criteria as hospitals and ambulatory centers race to reduce length of stay, cut revision rates, and document faster rehabilitation. Parallel supply-chain localization efforts in titanium and cobalt alloys aim to stabilize raw-material risk, while cybersecurity safeguards move to the foreground as smart implants begin to collect and transmit patient data in real time. Competitive advantage therefore hinges on a harmonized hardware–software ecosystem that integrates imaging, surgical robotics, and postoperative analytics into one defensible platform.
Key Report Takeaways
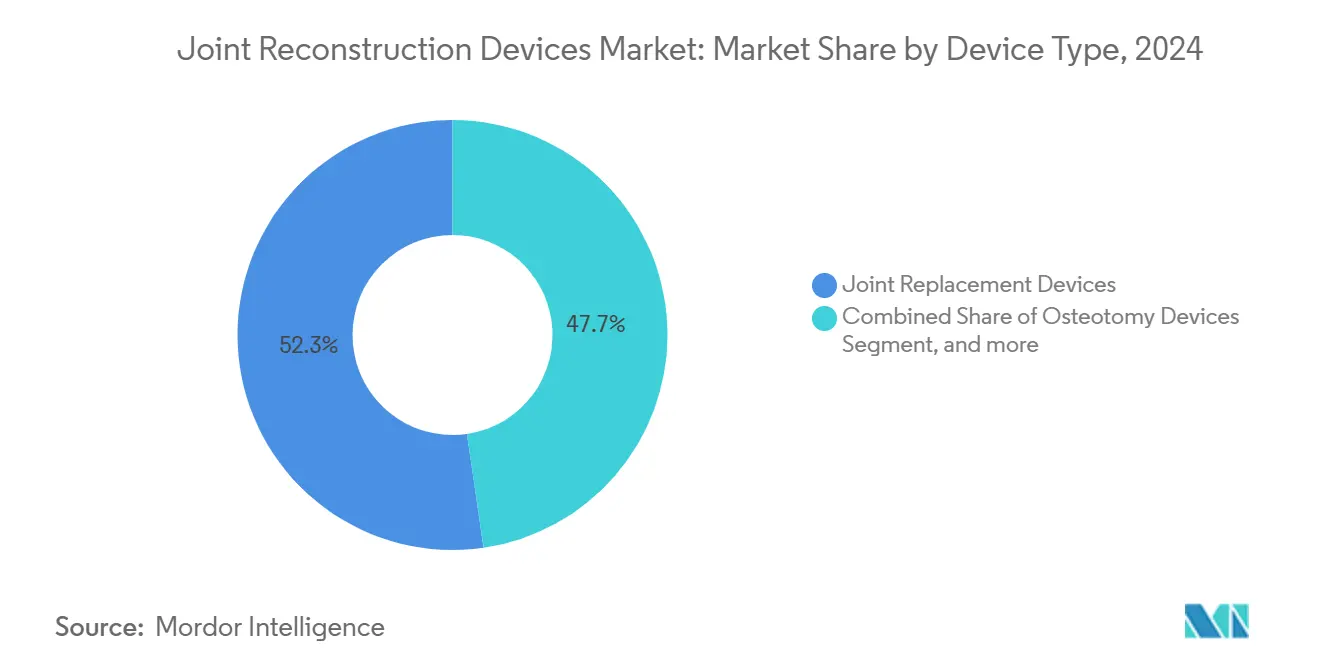
- By device type, joint replacement devices led with 52.34% of the joint reconstruction devices market share in 2024; Osteotomy Devices delivered the fastest expansion at a 7.65% CAGR to 2030.
- By joint type, knee reconstruction dominated with 45.45% revenue share in 2024, whereas shoulder devices are projected to grow at an 8.01% CAGR through 2030.
- By biomaterial, metallic alloys retained 52.34% share of the joint reconstruction devices market size in 2024, while biologic and composite materials are advancing at a 7.36% CAGR between 2025 and 2030.
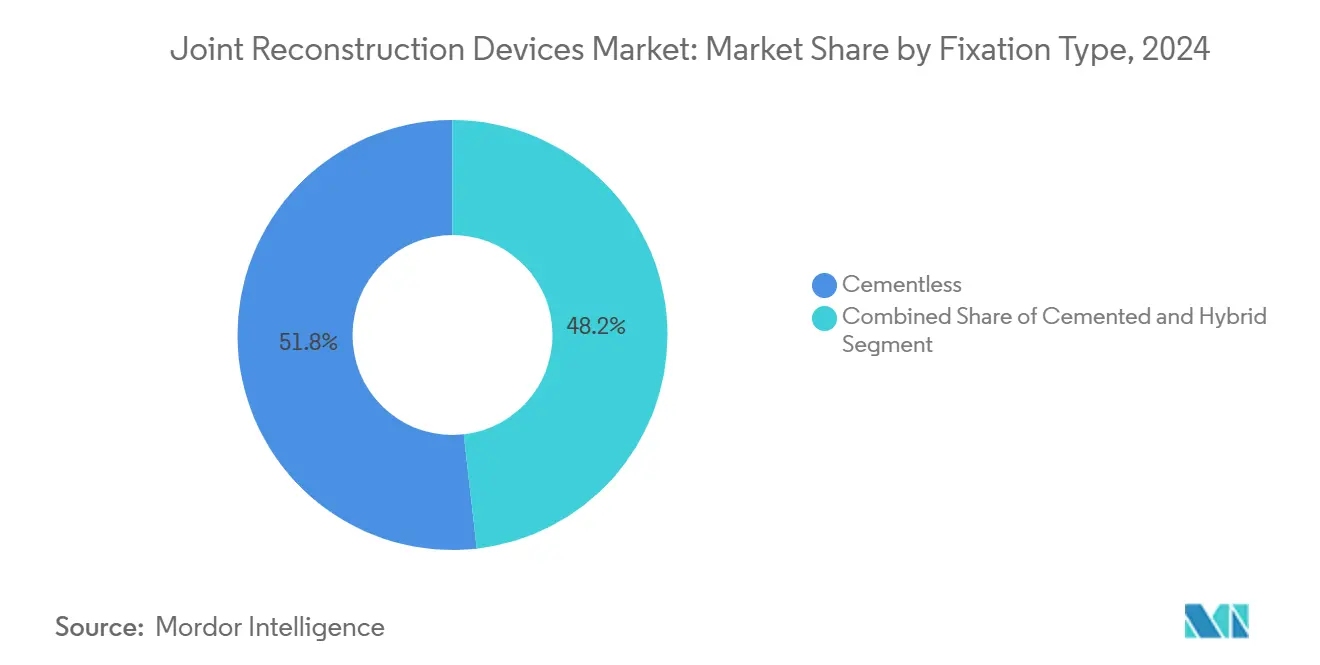
- By fixation method, cementless systems captured 51.87% share in 2024, and cemented techniques post the sharper 8.12% CAGR outlook to 2030.
- By end user, hospital settings controlled 55.87% of 2024 revenues; ambulatory surgical centers are forecast to climb at an 8.76% CAGR through 2030.
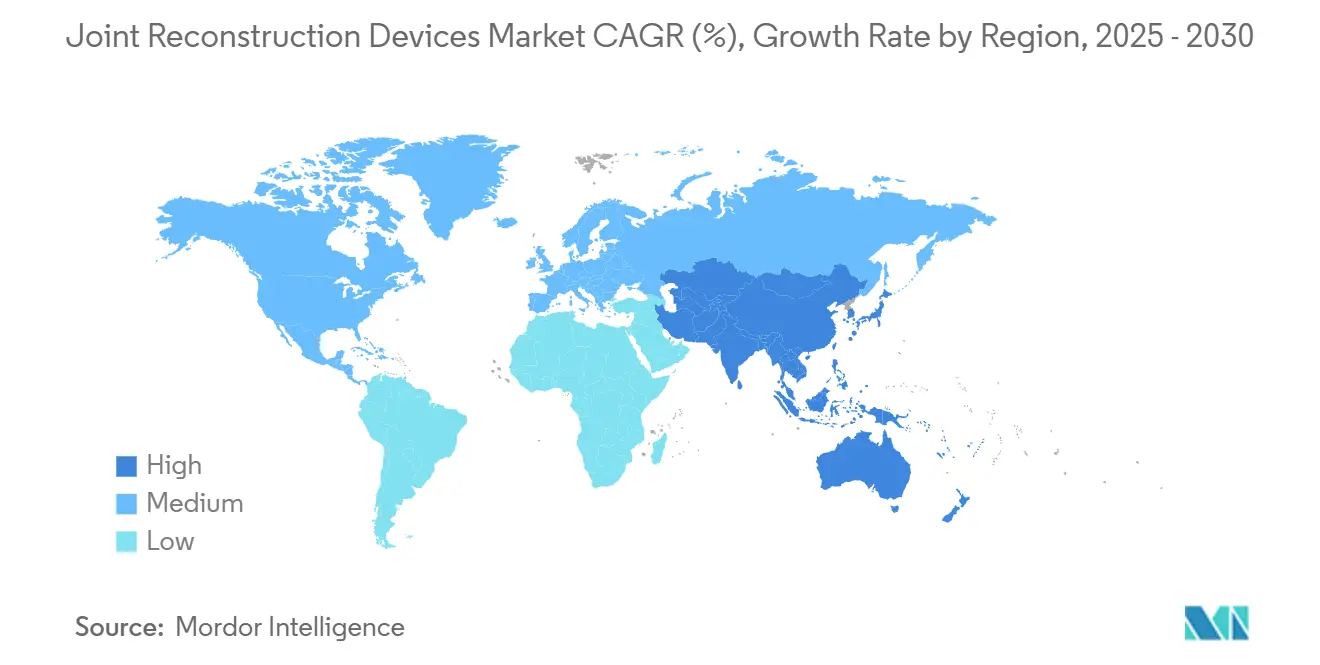
- Geographically, North America held 42.45% of global sales in 2024, but Asia-Pacific is poised for the swiftest 6.78% CAGR to 2030.
Global Joint Reconstruction Devices Market Trends and Insights
Drivers Impact Analysis*
| Driver | % Impact on CAGR Forecast | Geographic Relevance | Impact Timeline |
|---|---|---|---|
| Growing prevalence of orthopedic diseases | 1.20% | Global; highest in North America & Europe | Long term (≥ 4 years) |
| Increasing aging population | 1.10% | Global; concentrated in developed markets | Long term (≥ 4 years) |
| Rising adoption of minimally-invasive & robotic-assisted surgeries | 0.80% | North America & EU leading; APAC following | Medium term (2-4 years) |
| Emergence of outpatient & ASC joint-replacement programs | 0.70% | North America primary; expanding to EU | Short term (≤ 2 years) |
| 3-D printed, patient-specific implants gaining reimbursement traction | 0.40% | North America & EU early adoption | Medium term (2-4 years) |
| Supply-chain localization initiatives in titanium & cobalt alloys | 0.30% | Global; focus on US & EU manufacturing | Long term (≥ 4 years) |
| Source: Mordor Intelligence | |||
Growing Prevalence of Orthopedic Diseases
Osteoarthritis already affected 607 million people worldwide in 2021, and epidemiologists expect the curve to steepen well beyond 2050 as sedentary lifestyles and obesity accelerate cartilage wear[1]MedRxiv Preprint Authors, “Global, regional and national burden of osteoarthritis: 1990–2021,” medrxiv.org. The disease hits women harder than men and multiplies with age, turning joint degeneration into a looming public-health expense. Conventional conservative therapies can delay but seldom avert advanced deterioration, so surgeons are recommending earlier reconstruction to sustain mobility and lessen lifetime disability. As implant longevity improves, payers have started approving surgery at younger ages, signaling a pivot from reactive to proactive joint preservation.
Increasing Aging Population
In the United States alone, annual primary knee replacements could top 2.60 million by 2060, underscoring how demographic swell drives procedural demand[2]Arthritis Foundation, “Knee Replacement Surgery Statistics,” arthritis.org. More than half of hip and knee arthroplasties are forecast to be performed on patients under 65 within the next five years, a shift that forces designers to enhance fatigue strength for decades of post-operative activity. The trend creates a durable growth engine for the joint reconstruction devices market, as longevity converges with higher expectations for an active lifestyle.
Emergence of Outpatient & ASC Joint-Replacement Programs
Same-day discharge for total joint procedures climbed from under 1% in 2017 to beyond 30% by 2021, a transformation that endures as payers continue to steer cases away from costlier inpatient suites[3]ASC Focus, “The March Toward Same-Day Joint Arthroplasty,” ascfocus.org. Ambulatory centers lower infection risk to 2.4% versus 3.9% in hospitals and trim total costs by roughly 40%, prompting CMS to remove arthroplasty from the inpatient-only list. Providers therefore redesign peri-operative workflows, adopt multimodal pain regimens, and invest in digital follow-up tools that document value for bundled-payment contracts.
High Procedure & Implant Costs vs. Reimbursement Caps
Inflation-adjusted Medicare payments for total knees fell to USD 881.40 and for total hips to USD 839.17 between 2013 and 2021, even as case volumes climbed. Hospitals must therefore deliver better outcomes at shrinking margins, while CMS now withholds reimbursement if facilities fail to collect patient-reported scores on at least half of eligible arthroplasty cases. Revision surgeries face the tightest squeeze because their complexity overshoots flat payment bundles, pressuring providers to hammer supply costs and lean heavily on value-based purchasing contracts.
Restraints Impact Analysis*
| Restraints Impact Analysis | (~) % Impact on CAGR Forecast | Geographic Relevance | Impact Timeline |
|---|---|---|---|
| High procedure & implant costs vs. reimbursement caps | -0.90% | Global; most acute in US system | Short term (≤ 2 years) |
| Stringent & evolving regulatory scrutiny on implant safety | -0.60% | North America & EU leading; global adoption | Medium term (2-4 years) |
| Volatile critical-alloy supply disrupting production | -0.40% | Global; emphasis on US & EU manufacturers | Long term (≥ 4 years) |
| Cyber-security & data-privacy risks in sensor-enabled implants | -0.20% | Global | Medium term (2-4 years) |
| Source: Mordor Intelligence | |||
Stringent & Evolving Regulatory Scrutiny on Implant Safety
The FDA’s 2024 Class 2 recall of the MISHA Knee System over fracture risk signals more watchful post-market oversight. Europe’s Medical Device Regulation compounds the evidence burden, mandating continuous performance data and metal-ion surveillance. Although cobalt and chromium readings have remained below toxic thresholds up to 18 years post-implant, manufacturers must now finance extended registries and field-data capture that lengthen development pipelines. Smaller innovators feel the strain, and large incumbents face timetable uncertainty that can delay next-generation launches.
*Our forecasts treat driver/restraint impacts as directional, not additive. The impact forecasts reflect baseline growth, mix effects, and variable interactions.
Segment Analysis
By Device Type: Joint Replacement Drives Pipeline Expansion
Joint replacement devices accounted for 52.34% of 2024 sales, underscoring their anchor status in the joint reconstruction devices market. The category’s revenue is projected to rise in parallel with a 7.65% CAGR segment led by high-growth osteotomy and robotic-ready systems. Surgeons increasingly combine intra-articular sensors with conventional hardware to capture real-time alignment data, a shift that shortens post-operative imaging and refines rehabilitation protocols. Osteotomy platforms target younger cohorts who seek to defer full replacement, and arthroscopy kits capitalise on minimal-access trends that accelerate return to sport. Arthrodesis and resurfacing remain niche but vital for complex deformities, often serving as salvage options when bone stock is inadequate for modular implants.
The fastest-rising contenders bundle AI-driven planning software with physical instrumentation, moving decision-making from the operating theatre’s experience gradient to statistically grounded probability models. Zimmer Biomet’s OrthoGrid Hip AI, for instance, achieved 95% component-position accuracy, proving that software precision can become a pivotal selling point. As reimbursement pivots to outcomes, differentiation now depends on demonstrable, data-validated performance metrics rather than incremental hardware tweaks. The joint reconstruction devices market therefore rewards integrated toolsets that streamline pre-op imaging, intra-op guidance, and post-op analytics in one subscription model.


By Joint Type: Shoulder Momentum Outpaces Established Segments
Knee systems held 45.45% of global turnover in 2024, a testament to decades of procedural standardisation and long prosthesis life. Yet shoulder reconstruction exhibits the briskest 8.01% CAGR, fuelled by aging yet active demographics who refuse motion loss. Improved rotator-cuff repair techniques and reverse shoulder arthroplasty broaden indications, while the first robotic-assisted shoulder replacement using ROSA technology confirmed feasibility for complex geometry. Hip devices tick upward at a measured pace, sustained by population aging rather than step-change technology, whereas ankle, wrist, and elbow solutions capture attention through patient-specific 3-D printing that handles irregular bone stock.
Anatomical complexity pushes manufacturers to abandon one-size-fits-all paradigms and design geometry tuned to each joint’s kinematics. The joint reconstruction devices market size for shoulders is expected to surpass USD 5 billion by 2030, and strong clinician advocacy will likely reinforce its growth. For knees, ongoing advances in ultracongruent inserts and sensor-based balancing aim to curb lingering revision triggers such as instability and mal-alignment. Hip developers focus on dual-mobility cups and ceramic heads to minimise dislocation while retaining low wear. Collectively, the industry’s ability to tailor solutions joint-by-joint will remain the central lever for sustained expansion.
By Biomaterial: Biologics Gain Traction Against Metallic Mainstays
Metallic alloys – chiefly titanium and cobalt-chromium – continued to command 52.34% revenue share in 2024 because of their strength, machinability, and long clinical track record. Nonetheless, biologic and composite materials are advancing at 7.36% CAGR as surgeons look for implants that encourage osseointegration or even tissue regeneration. Polyethylene and highly cross-linked polymers still dominate bearing surfaces, while ceramics earn favour for low debris generation despite brittleness concerns. Molybdenum-rhenium derivatives and anodised titanium niobium nitride coatings show promise in curbing metal sensitivity without weakening fatigue life.
High-energy plasma spray and 3-D printed lattice architectures enlarge surface area for bone ingrowth, shortening time to stable fixation. In parallel, stem-cell-laden hydrogels and resorbable scaffolds sit at the interface of orthopaedics and regenerative medicine, setting the stage for hybrid constructs that meld structural metal cores with biologically active exteriors. As personalised care intensifies, raw-material selection will hinge on patient allergy profiles, activity level, and projected implant longevity. The joint reconstruction devices market now prizes biomaterial versatility as a core axis of competition.
By Fixation Type: Cementless Adoption Challenges Historical Norms
Cementless designs delivered 51.87% of 2024 revenues, confirming decades of progress in porous-coated metallurgy and hydroxyapatite layering that secure bony on-growth. Zimmer Biomet’s Oxford Cementless Partial Knee achieved a 94.1% ten-year survival rate, eclipsing many cemented benchmarks. Cemented techniques nevertheless post the stronger 8.12% CAGR outlook, thanks to select indications like osteoporotic bone or radical deformity where immediate stability trumps biological fixation. Hybrid strategies combine press-fit cups with cemented stems, letting surgeons reconcile unique anatomy with fixation predictability.
Future gains revolve around intra-operative imaging and sensor feedback that verify stability before wound closure, reducing early migration risk. For younger adults, cementless remains the default due to long-term remodel capacity, but for frail elders, cemented stems ease early weight-bearing. Hence fixation choice is no longer binary; instead, modularity enables personalised assembly matched to bone quality and patient activity. The joint reconstruction devices market size for cementless systems is forecast to climb in tandem with hardware-embedded analytics that document fixation success immediately post-implantation.
By End User: ASC Migration Reshapes Provider Economics
Hospitals retained 55.87% of 2024 implant spend, yet ambulatory surgical centers recorded the steepest 8.76% CAGR as payer policies and patient preferences steer procedures into efficient, lower-cost venues. Orthopedic specialty clinics thrive by offering integrated imaging, physical therapy, and same-day surgery, capturing athletes and working-age adults seeking rapid recovery. Sports medicine and trauma hubs further diversify revenue by managing acute injuries that flow directly from emergency departments.
Blue Cross NC’s July 2025 site-of-care rule now demands prior authorization for hospital-based outpatient musculoskeletal cases, funnelling many into ASC settings where criteria for medical necessity are met. Facilities that optimise turnover time through robotic workflows and digital pre-op assessment stand to seize market share. The joint reconstruction devices industry therefore tailors instrument trays and robot footprints to smaller operating rooms, improving logistics and trimming capital budgets.
Geography Analysis
North America generated 42.45% of global revenue in 2024 as leading institutions adopted robotics early and reimbursement systems financed innovation. Same-day discharge protocols for knee and hip replacements exceeded 30% across major centers, transforming bed-management strategies and catalysing demand for portable navigation carts and single-use instrumentation. Yet CMS payment cuts and stringent value-based benchmarks are compressing margins, compelling providers to scrutinise total episode cost. Manufacturers must therefore bundle analytics dashboards that validate outcome claims in order to maintain premium pricing.
Asia-Pacific is the clear velocity leader, expanding at a 6.78% CAGR through 2030 on the back of rising life expectancy, lifestyle disease incidence, and government-led investments in surgical capacity. Domestic champions in China, South Korea, and India win contracts through price-competitive yet technologically advanced offerings that align with localisation mandates. Regulatory harmonisation with ISO and FDA standards has shortened clearance timelines, inviting multinationals to establish joint ventures and local 3-D printing hubs. As procedural volumes rise, surgeon preference is migrating from basic cemented implants to computer-assisted navigation and robotic guidance. The joint reconstruction devices market in Asia-Pacific thus transitions rapidly from access-first to sophistication-first.
Europe posts balanced growth underpinned by universal coverage and high clinical standards. Implementation of the Medical Device Regulation tightens evidence thresholds, raising compliance costs but arguably lifting public confidence in next-generation implants. Demand is buoyed by an aging demographic similar to North America, yet procurement committees exert stiffer price discipline, rewarding suppliers that document lower revision rates and faster rehabilitation. Meanwhile, emerging economies in the Middle East, Africa, and South America pursue hospital modernisation projects that attract donations and private-equity backing for orthopaedic infrastructure. These regions seek modular, cost-sensitive systems that can later upgrade to advanced navigation as surgeon training matures.

Competitive Landscape
Four global majors Zimmer Biomet, Stryker, Johnson & Johnson’s DePuy Synthes, and Smith+Nephew anchor the mid-consolidated structure, each investing heavily in digital integration to defend share. Stryker’s Mako SmartRobotics surpassed 1 million lifetime procedures in early 2025 and now incorporates Q Guidance for augmented reality overlays, deepening its ecosystem moat. Zimmer Biomet countered with the ROSA platform that now covers knee, hip, and shoulder lines, while linking implant telemetry to its mymobility app for remote physical-therapy coaching. Johnson & Johnson’s VELYS blends intra-op video analytics with its Attune knee system, and Smith+Nephew’s CORI leverages ultrasound planning to avoid pre-op CT exposure.
Strategic acquisitions sharpen portfolios: Zimmer Biomet paid USD 16.59 billion to absorb Paragon 28 in foot-and-ankle specialisation, converging trauma, alignment, and biologics into a cohesive limb-reconstruction suite. Globus Medical’s purchase of Nevro adds neuromodulation for chronic pain, broadening value beyond implants into therapy continuity. Stryker divested its U.S. spinal-implant arm to Viscogliosi Brothers, freeing resources for hip revision robotics and cementless knee expansion. Smaller entrants focus on AI, sensor arrays, and additive manufacturing to leapfrog hardware incumbents, but stringent regulatory demands and hospital capital-budget constraints challenge their scale-up trajectories.
While price competition persists in commodity segments, the joint reconstruction devices market increasingly rewards lifetime-value propositions that pair implants with predictive analytics, tele-rehab platforms, and risk-sharing contracts. Manufacturers able to demonstrate reduced revision incidence and accelerated functional milestones secure preferred-vendor status and multiyear supply deals. The broader trend now shifts from single-procedure sales to platform subscriptions, with cloud dashboards capturing surgical data that feed continuous learning loops across a hospital network.
Joint Reconstruction Devices Industry Leaders
Conmed Corporation
Stryker Corporation
Medtronic plc
Smith + Nephew plc
Johnson & Johnson (DePuy Synthes)
- *Disclaimer: Major Players sorted in no particular order

Recent Industry Developments
- May 2025: Zimmer Biomet posted 1.1% net-sales growth, buoyed by launches including the Z1 Triple-Taper Femoral Hip System and FDA clearance of the Persona Revision SoluTion femur for metal-sensitive patients, while finalising the Paragon 28 acquisition.
- May 2025: Stryker unveiled next-generation Mako 4 with Q Guidance and the industry’s first robotic hip-revision capability, scheduling commercial shoulder and spine applications for late 2025.
- April 2025: Smith+Nephew reported USD 1,407 million Q1 revenue with 3.2% orthopaedics growth and introduced the CATALYSTEM Primary Hip System alongside FDA-cleared LEGION Medial Stabilized inserts.
- February 2025: Stryker unveiled next-generation Mako 4 with Q Guidance and the industry’s first robotic hip-revision capability, scheduling commercial shoulder and spine applications for late 2025.
- February 2025: Globus Medical agreed to buy Nevro Corp for USD 250 million to combine neuromodulation with its musculoskeletal portfolio.


Global Joint Reconstruction Devices Market Report Scope
As per the scope of the report, joint reconstruction devices are implants used to replace or repair damaged joints, such as hips or knees, to restore mobility and function. They are typically made of metal, plastic, or ceramic materials designed for durability and biocompatibility. These devices help improve quality of life for patients with joint degeneration or injury.
The joint reconstruction devices market is segmented by Device Type (Joint Replacement Devices, Osteotomy Devices, Arthroscopy Devices, Resurfacing Devices, Arthrodesis Devices, and Other Devices), Joint Type (Knee, Hip, Shoulder, Ankle, and Other Joint Types), Biomaterial (Metallic Alloys, Polymeric Materials, Ceramic Materials, and Biologic & Composite Materials), Fixation Type (5.4.1 Cementless, Cemented, and Hybrid), End User (Hospitals, Orthopedic Specialty Clinics, Ambulatory Surgical Centres (ASCs), and Sports Medicine & Trauma Centres), and Geography (North America, Europe, Asia Pacific, South America, and Middle East & Africa). The market report also covers the estimated market sizes and trends for 17 countries across major regions globally. The report offers the value (in USD million) for the above segments.
| Joint Replacement Devices |
| Osteotomy Devices |
| Arthroscopy Devices |
| Resurfacing Devices |
| Arthrodesis Devices |
| Other Devices |
| Knee |
| Hip |
| Shoulder |
| Ankle |
| Other Joint Types |
| Metallic Alloys |
| Polymeric Materials |
| Ceramic Materials |
| Biologic & Composite Materials |
| Cementless |
| Cemented |
| Hybrid |
| Hospitals |
| Orthopedic Specialty Clinics |
| Ambulatory Surgical Centres (ASCs) |
| Sports Medicine & Trauma Centres |
| By Device Type | Joint Replacement Devices |
| Osteotomy Devices | |
| Arthroscopy Devices | |
| Resurfacing Devices | |
| Arthrodesis Devices | |
| Other Devices | |
| By Joint Type | Knee |
| Hip | |
| Shoulder | |
| Ankle | |
| Other Joint Types | |
| By Biomaterial | Metallic Alloys |
| Polymeric Materials | |
| Ceramic Materials | |
| Biologic & Composite Materials | |
| By Fixation Type | Cementless |
| Cemented | |
| Hybrid | |
| By End User | Hospitals |
| Orthopedic Specialty Clinics | |
| Ambulatory Surgical Centres (ASCs) | |
| Sports Medicine & Trauma Centres |


Key Questions Answered in the Report
What is the current value of the joint reconstruction devices market?
The joint reconstruction devices market stood at USD 24.59 billion in 2025 and is projected to reach USD 31.40 billion by 2030.
Which device segment is expanding the fastest?
Within device types, osteotomy and digitally enabled joint replacement systems deliver the highest 7.65% CAGR through 2030.
Why are outpatient centers gaining procedure share?
Ambulatory surgical centers cut infection rates to 2.4% and lower total episode cost by roughly 40%, driving an 8.76% CAGR in adoption as payers steer cases away from hospitals.
How important are robotics to future growth?
Robotic-assisted arthroplasty already shows a 19% survivorship benefit and is becoming a must-have capability, with more than 1 million Mako procedures performed worldwide.
What material innovations are on the horizon?
Expect broader use of biologic composites, resorbable scaffolds, and advanced coatings such as titanium niobium nitride that enhance osseointegration while reducing metal sensitivity.
Which region offers the highest growth potential?
Asia-Pacific leads with a 6.78% CAGR as demographics, rising incomes, and domestic manufacturing incentives converge to expand surgical capacity.
Page last updated on:


