
Joint Pain Injections Market Size and Share
Market Overview
| Study Period | 2020 - 2031 |
|---|---|
| Market Size (2026) | USD 6.43 Billion |
| Market Size (2031) | USD 9.16 Billion |
| Growth Rate (2026 - 2031) | 7.35 % |
| Fastest Growing Market | Asia Pacific |
| Largest Market | North America |
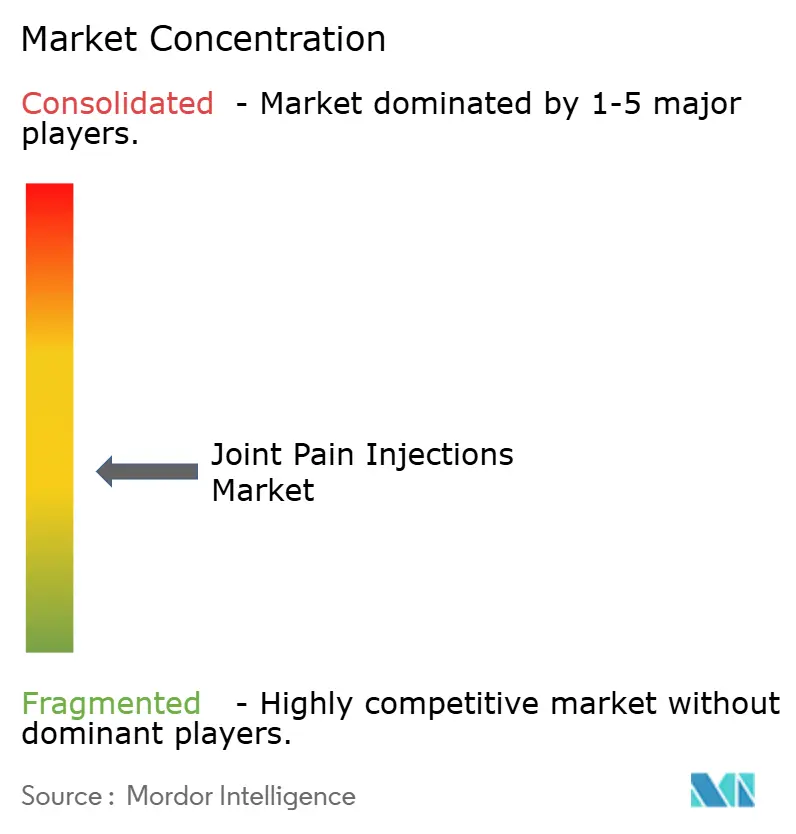
| Market Concentration | Medium |
Major Players *Disclaimer: Major Players sorted in no particular order Image © Mordor Intelligence. Reuse requires attribution under CC BY 4.0. | |
Joint Pain Injections Market Analysis by Mordor Intelligence
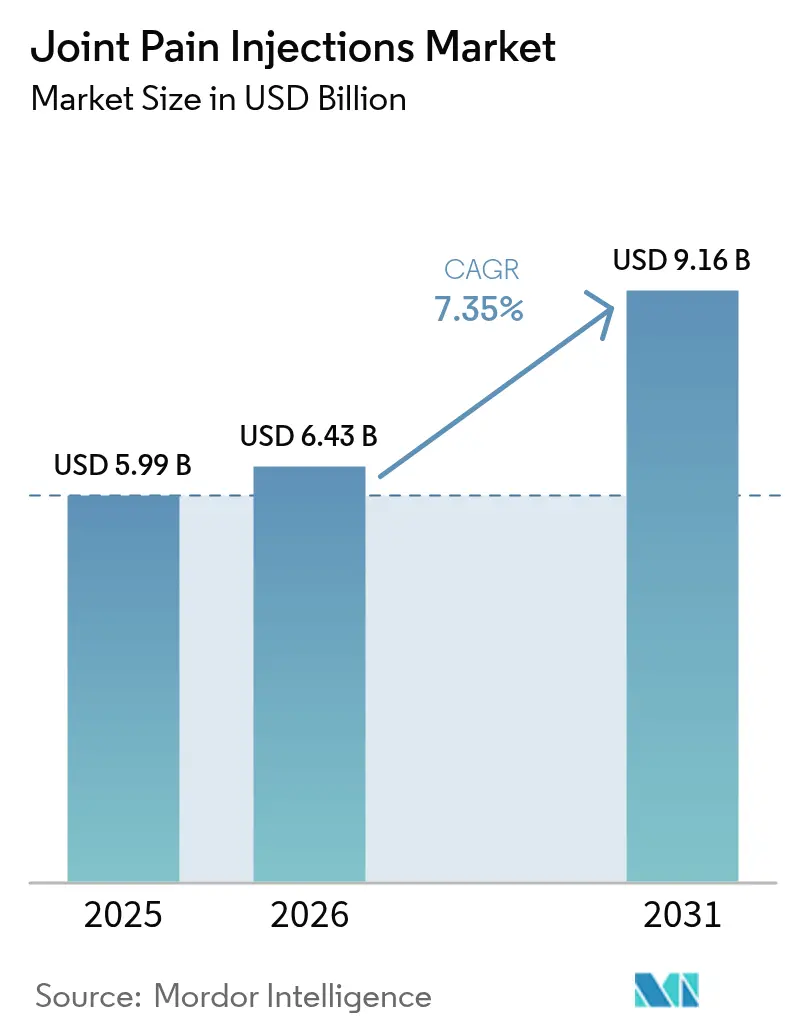
Joint Pain Injections market size in 2026 is estimated at USD 6.43 billion, growing from 2025 value of USD 5.99 billion with 2031 projections showing USD 9.16 billion, growing at 7.35% CAGR over 2026-2031.
This growth aligns with a sharp rise in osteoarthritis prevalence, wider reimbursement for regenerative medicine, and steady improvements in image-guided delivery that lower complication rates. Hyaluronic acid (HA) remains the anchor therapy, yet platelet-rich plasma (PRP) and other autologous biologics are moving from experimental status to mainstream care as payers formalize coverage. Within care settings, ambulatory surgery centers (ASCs) are capturing procedure volume from hospitals thanks to 40-60% lower episode costs, while AI-enabled ultrasound drives first-pass injection accuracy above 90%. Collectively, these forces push physicians toward single-dose or three-cycle regimens that optimize chair time and delay joint-replacement surgery, improving both patient satisfaction and health-system margins.
Key Report Takeaways
- By injection type, single-injection HA captured 58.03% of the injection-cycle joint pain injections market share in 2025; three-cycle regimens are positioned for 12.12% CAGR through 2031.
- By injection cycle, hyaluronic acid led the injection-type hierarchy with 47.68% revenue share in 2025, while PRP is on track for the fastest 8.72% CAGR to 2031.
- By application, knee and ankle applications accounted for 43.35% of the 2025 joint pain injections market size; hip injections are projected to grow at 11.38% CAGR over the forecast horizon.
- By end user, hospitals retained 39.92% end-user share in 2025, yet ASCs are advancing at a 12.98% CAGR to 2031 on the strength of bundled-payment acceptance.
- By geography, North America held the largest regional joint pain injections market share at 36.28% in 2025; Asia-Pacific is expanding fastest at 10.79% CAGR on demographic momentum and accelerated approvals.
Note: Market size and forecast figures in this report are generated using Mordor Intelligence’s proprietary estimation framework, updated with the latest available data and insights as of 2026.
Market Trends and Insights
Drivers Impact Analysis of Joint Pain Injections Market*
| Driver | (~) % Impact on CAGR Forecast | Geographic Relevance | Impact Timeline |
|---|---|---|---|
| Rising osteoarthritis burden | +2.1% | Asia-Pacific, North America | Long term (≥ 4 years) |
| Single-dose HA adoption | +1.8% | North America, EU, Asia-Pacific | Medium term (2-4 years) |
| Broader PRP reimbursement | +1.4% | North America, EU | Medium term (2-4 years) |
| ASC procedure migration | +1.2% | North America, major Asian metros | Short term (≤ 2 years) |
| AI-guided ultrasound | +0.8% | North America, EU | Medium term (2-4 years) |
| Employer-funded MSK programs | +0.5% | North America, other developed markets | Short term (≤ 2 years) |
| Source: Mordor Intelligence | |||
Increasing Osteoarthritis Incidence and Aging Population
Global osteoarthritis cases among people aged 15-64 exerting direct pressure on payers to finance minimally invasive interventions that keep working adults productive. Japan sits at the high end of prevalence with 12,610.12 cases per 100,000, an indicator of treatment demand across industrialized Asia. Post-menopausal women are driving incremental volume: nearly one-half are projected to develop osteoarthritis by 2045.[1]Mi-Jin Lee et al., “Clinical outcomes of single versus multiple HA injections,” BMC Musculoskeletal Disorders, biomedcentral.com These dynamics create a long-duration runway for injection therapies that defer or avoid joint replacement and maintain labor participation.
Accelerated Uptake of Single-Dose Viscosupplementation (HA)
Single-injection HA protocols cut follow-up visits while matching the efficacy of multi-injection regimens, reducing system utilization and patient travel costs. Analysis of 150,000 Korean beneficiaries showed a 44% lower total knee arthroplasty risk after single doses versus untreated cohorts, bolstering payer confidence. Industrial response is robust; BD lifted prefillable-syringe output sevenfold to satisfy anticipated demand. The operational win for providers fewer appointments has accelerated formulary placement in the United States, Germany and Japan, setting a medium-term positive arc for the joint pain injections market.
Wider Payer Support for PRP and Regenerative Therapies
UnitedHealthcare has formalized CPT coding for leukocyte-poor PRP, signalling maturity in reimbursement policy.[2]UnitedHealthcare, “2025 Medicare Advantage Medical Policy Updates,” uhcprovider.com Meta-analyses confirm PRP outperforms HA on pain reduction at 6- and 12-month checkpoints, giving actuaries defensible long-term savings arguments. Employers now spend an average USD 52 per member per month on musculoskeletal programs that include PRP coverage when productivity gains outweigh premiums. As evidence consolidates, PRP volumes are forecast to expand rapidly, reinforcing regenerative medicine’s role inside the joint pain injections market.
Proliferation of Pain-Centric Ambulatory Surgery Centers (ASCs)
Orthopedic outpatient procedures are set to grow 13% this decade, and ASCs have cost profiles that are 40-60% lower than hospital outpatient departments.[3]Vizient Inc., “Orthopedic Outpatient Procedures Outlook,” vizientinc.com CMS now reimburses shoulder replacements in ASC settings, indirectly lifting injection volumes because pre- and post-surgical pain management remains in the same facility. Lower overhead lets ASCs price injections competitively, enticing employer-sponsored plans to steer patients toward these sites. Short-term CAGR support is therefore strong in North America and spreading to high-income Asian urban clusters.
Restraints Impact Analysis of Joint Pain Injections Market*
| Restraint | (~) % Impact on CAGR Forecast | Geographic Relevance | Impact Timeline |
|---|---|---|---|
| High patient out-of-pocket exposure | -1.3% | United States, emerging economies | Medium term (2-4 years) |
| Reimbursement coding variability | -0.9% | North America, EU, Asia-Pacific | Short term (≤ 2 years) |
| Off-label steroid safety concerns | -0.7% | Global | Long term (≥ 4 years) |
| Regulatory audits of high-volume clinics | -0.6% | North America, EU | Medium term (2-4 years) |
| Source: Mordor Intelligence | |||
High Patient Out-of-Pocket Costs in Uninsured Segments
Coverage denials for viscosupplementation based on contested clinical value have forced some US patients to absorb the full USD 1,100–USD 1,800 per injection episode. Cigna still classifies orthopedic stem-cell therapies as “not medically necessary,” creating uneven benefit structures that suppress uptake. Internationally, many emerging-market payers reimburse surgery but not biologic injections, limiting access despite clinical need. Until definitive cost-effectiveness data influence public insurance rule-making, out-of-pocket exposure will continue to curb uptake.
Variability in Reimbursement and Procedural Coding
The 2025 Medicare Physician Fee Schedule altered relative value units for large-joint injections, forcing providers to re-model profitability. Local Coverage Determinations have barred amniotic-derived products, stalling growth in a potentially high-margin segment. Outside the United States, disparate device-versus-drug definitions create coding ambiguity that can delay payment up to 180 days, pressuring cash-flow at smaller practices. Unless global coding systems converge, injection adoption will be uneven across borders.
*Our forecasts treat driver/restraint impacts as directional, not additive. The impact forecasts reflect baseline growth, mix effects, and variable interactions.
Joint Pain Injections Market Segment Analysis
By Injection Type:
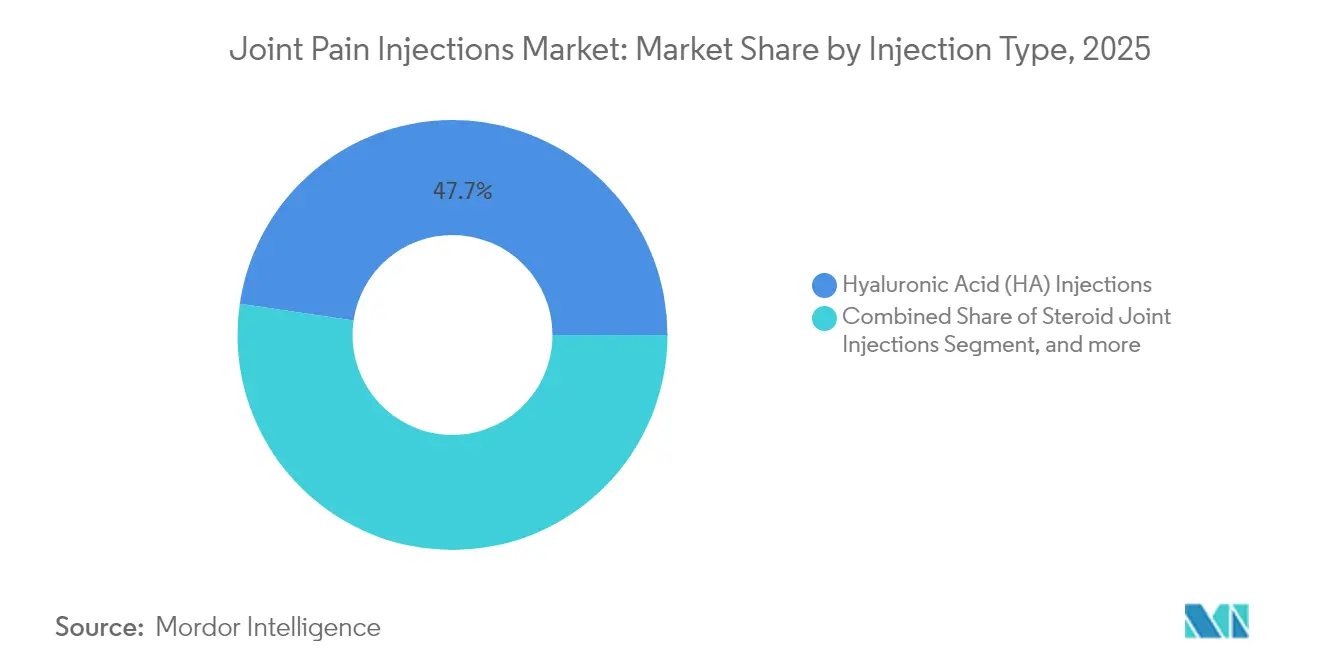
HA Dominates, PRP AcceleratesThe joint pain injections market size for hyaluronic acid stood equal to 47.68% of total revenue in 2025. Long-term safety, broad payer acceptance, and rising single-dose use keep HA entrenched across knee and ankle indications. PRP revenue is forecasted for a 8.72% CAGR, gaining traction as randomized studies corroborate superior WOMAC and VAS scores at 12 months.
Combination products that merge HA with collagen tripeptides or linkers appeal to severe osteoarthritis patients and could widen choice. However, the Centers for Medicare & Medicaid Services’ 2024 non-coverage determination for placental biologics narrows near-term expansion pathways. Over the forecast window, proven efficacy endpoints and payer alignment suggest PRP will chip away at HA’s dominance without dislodging it entirely from first-line status in the joint pain injections market.



By Injection Cycle:
Three-Cycle Protocols Gain MomentumSingle-cycle regimens represented 58.03% of market value in 2025 as physicians embraced the convenience of one-and-done dosing. Evidence now shows three PRP injections deliver statistically greater pain relief than a single dose, forming the rationale for a 12.12% CAGR through 2031 for this segment.
Five-cycle programs remain confined to severe cases because the incremental benefit plateaus after the third dose; consequently, payer willingness to reimburse beyond three sessions is waning. Manufacturers are therefore redesigning packaging—multi-chamber kits for three cycles—to remove compounding errors and shorten prep time, a move that reinforces the growth of mid-range dosing frequencies within the joint pain injections market.
By Application:
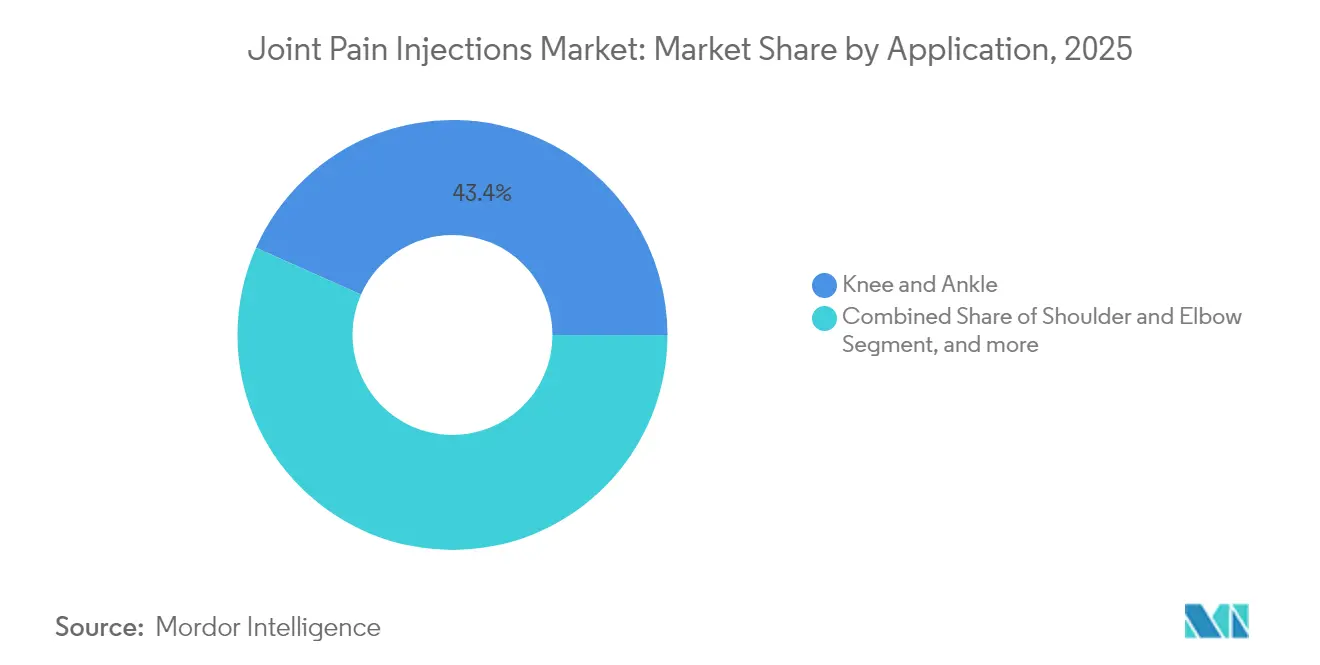
Hip and Small Joints RiseThe knee and ankle cluster accounted for 43.35% of 2025 revenue, underpinned by high prevalence and mature clinical guidelines. Hip injections are climbing at an 11.38% CAGR as AI-guided ultrasound improves access to a deep joint previously served primarily by surgery.
Shoulder and elbow volumes benefit from athletes extending playing careers into middle age, prompting specialized centers to adopt PRP plus HA combinations. Meanwhile, spine-related injections face stricter utilization review after audits uncovered double-billing and documentation lapses, leading to slower growth. Overall, modality expansion into hip and small-joint anatomies will diversify revenue streams across the joint pain injections market.
By End User:
ASCs Outpace HospitalsHospitals preserved a 39.92% share in 2025 due to integrated imaging and anesthesia resources. Yet ASCs are on course for a 12.98% CAGR, propelled by bundled-payment acceptance and patient preference for lower copays. Orthopedic clinics continue to serve as referral hubs, but regulatory oversight of high-volume pain centers is tightening and may redistribute volume toward accredited facilities with robust data reporting.
Sports medicine centers capture elective demand among active seniors who value rapid recovery, while initial home-based pilot programs using portable ultrasound remain experimental. The overarching shift to value-based payment aligns with ASC strengths, signaling continued share gains at hospitals’ expense within the joint pain injections market.
Geography Analysis
North America Joint Pain Injections Market
North America delivered 36.28% of 2025 sales, anchored by the United States where Medicare Advantage now reimburses PRP under specified CPT codes and employer MSK programs average USD 52 per member per month. Canada’s single-payer model has begun funding HA in earlier disease stages, spurring 8% procedural growth. Mexico shows latent demand but still contends with uneven device registration timelines and out-of-pocket barriers, limiting near-term uptake.
Europe Joint Pain Injections Market
Europe benefits from synchronized Medical Device Regulation that clarifies safety benchmarks for HA syringes. Germany and France drive regional procedure volume through robust outpatient networks, while the United Kingdom’s National Health Service pilots risk-share contracts tying reimbursement to functional-outcome thresholds. Southern European countries such as Spain and Italy are scaling AI-guided ultrasound to rural clinics, boosting accessibility.
APAC Joint Pain Injections Market
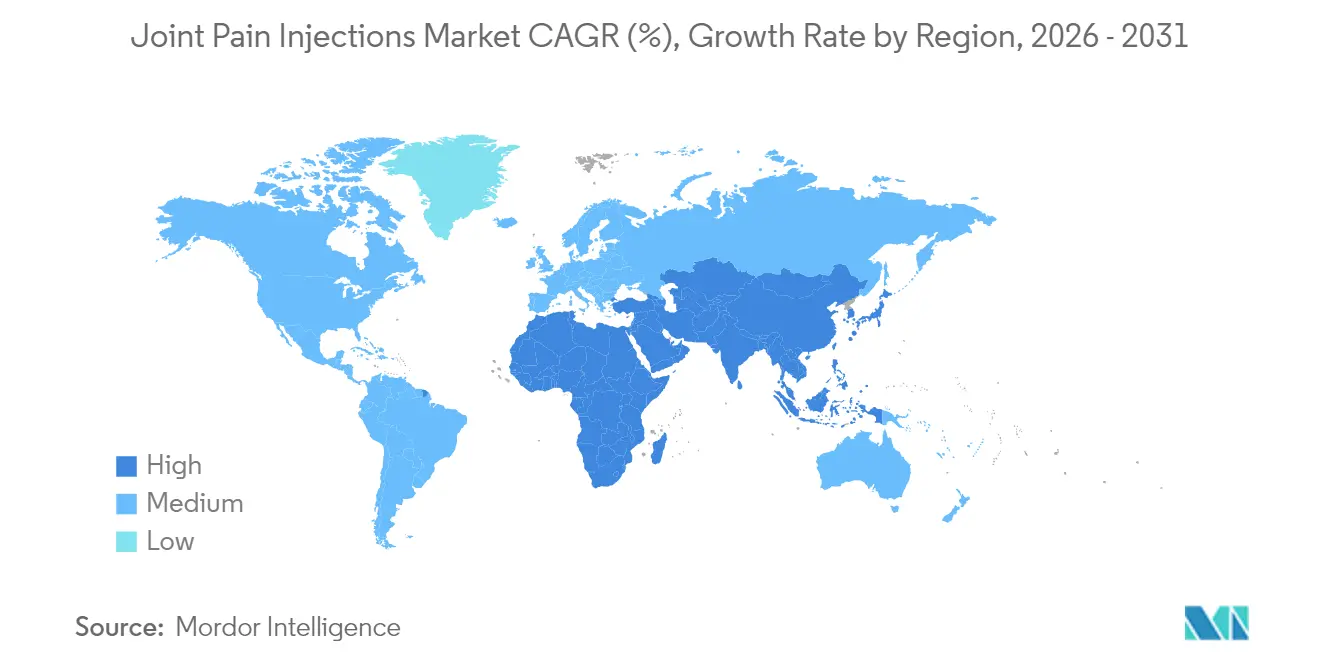
Asia-Pacific is the fastest-growing territory at 10.79% CAGR, propelled by Japan’s exceptional osteoarthritis burden and well-established imaging infrastructure. China’s National Medical Products Administration has slashed device approval timelines to 150 days, accelerating market entry for single-dose HA brands. Australia, India and South Korea invest heavily in ASC construction, mirroring US practice patterns and unlocking procedural capacity. Rest-of-Asia markets exhibit early-adoption behavior with government-backed tele-ultrasound programs that may compress the diffusion curve for newer injection modalities.

Regulatory Landscape
Regulation for joint pain injections varies by modality and region, with hyaluronic acid (HA) intra-articular products in the United States historically regulated as higher-risk medical devices and requiring robust evidence packages for authorization and reimbursement. A recent anchor is Fidia Farmaceutici receiving US FDA Center for Devices and Radiological Health Premarket Approval (PMA) for HYMOVIS ONE (reported as April 2025) and then making it commercially available in the United States in January 2026, underscoring the continued importance of PMA pathways for differentiated viscosupplements.
In Europe, compliance requirements for HA injections are governed by the Medical Device Regulation (EU) 2017/745, which raises post-market clinical follow-up and real-world evidence expectations across legacy and new products. In parallel, the European Medicines Agency updated post-authorization expectations for centrally authorized products via revisions that became applicable in January 2026, including the revised variations framework and updated stability testing guidance for variations, increasing procedural and quality-system workload for manufacturers managing product changes across markets.
Competitive Landscape
The market is moderately fragmented. The five largest manufacturers control significant market share of global revenue, indicating partial concentration but ample room for niche innovators. Anika Therapeutics has re-centered its portfolio on HA after divesting sports-medicine hardware, allowing deeper R&D in high-molecular-weight gels. Bioventus acquired CartiHeal’s Agili-C for USD 315 million, integrating a cartilage implant that complements its HA line and differentiates the brand via combination therapy potential.
Device players are equally active. BD expanded prefillable‐syringe production sevenfold, pushing unit costs lower and ensuring supply resilience during seasonal demand spikes. AI-ultrasound specialists such as Exact Imaging are entering co-marketing partnerships with biologic manufacturers to embed imaging software directly in injection kits, a move that could raise switching costs for clinicians. Competitive success increasingly hinges on evidence generation: firms that link products to high-quality registry data and publish real-world outcomes are favored on payer formularies, reinforcing a virtuous cycle of volume and margin capture in the joint pain injections market.
Joint Pain Injections Industry Leaders
Zimmer Biomet
Anika Therapeutics
Bioventus
Ferring Pharmaceuticals
Sanofi
- *Disclaimer: Major Players sorted in no particular order
Joint Pain Injections Market Companies Covered in this Report
- Anika Therapeutics
- Bioventus
- Ferring Pharmaceuticals
- Sanofi
- Pfizer
- Eli Lilly and Company
- Flexion Therapeutics
- Teva Pharmaceutical Industries
- Zimmer Biomet
- Seikagaku
- Arthrex
- Stryker
- Sequent Scientific
- Seaspine Holdings
- Chugai Pharma
- Sequoia Medical
- Meda AB
- LG Life Science
- Terumo
- Johnson & Johnson

Market Opportunities and Future Outlook
A key whitespace is the push toward fewer-visit care pathways (single-injection and clinic-efficient protocols) that align with payer scrutiny and site-of-care shifts. Recent approvals and launches reinforce this direction: Fidia Farmaceutici brought HYMOVIS ONE, a single-injection, non-avian HA hydrogel, to the US market in January 2026 following FDA PMA, and this type of product profile supports providers and ASCs seeking to reduce follow-up visits while maintaining outcomes.
Another opportunity area sits around clinically validated regenerative and disease-modifying approaches that go beyond short-term symptom control, but face higher evidence thresholds and professional-society scrutiny. Pipeline movement provides tangible signals, including Biosplice Therapeutics submitting an NDA to the US FDA in January 2026 for lorecivivint for knee osteoarthritis, and MEDIPOST reporting in May 2026 that its Japan Phase 3 trial for CARTISTEM met primary and secondary endpoints. At the same time, the American Association of Hip and Knee Surgeons (AAHKS) released a 2025 biologics position statement cautioning against cartilage-restoration claims in hips and knees, which elevates the value of products supported by rigorous endpoints, registries, and defensible labeling for payers and employer MSK programs.
Recent Industry Developments in Joint Pain Injections Market
- April 2026: Croma-Pharma reacquired Synocrom, a hyaluronic acid viscosupplement used in knee osteoarthritis, and communicated planned availability in the EU and Switzerland from May 2026. The move returns a known HA brand to its portfolio and strengthens commercial positioning in European channels where product continuity and MDR-aligned documentation shape purchasing decisions.
- November 2025: Anika Therapeutics filed the third and final module of its Premarket Approval (PMA) application with the US FDA for Hyalofast, a scaffold intended to treat articular cartilage defects in the knee. Advancing through PMA supports a higher-barrier regenerative segment and can broaden Anika's orthopedic solutions alongside viscosupplementation-focused offerings.
- June 2024: Sun Pharma, in collaboration with Moebius Medical, announced positive clinical trial data for MM-II, a single intra-articular injection showing superior pain relief versus placebo for up to 26 weeks in osteoarthritis patients. The readout supports longer-duration, single-administration product profiles that fit clinic throughput priorities and payer interest in reducing repeat visits.


Joint Pain Injections Market Report Scope and Research Methodology
Market Definition and Coverage
For this methodology, the market is defined as revenue generated from injectable therapies used to reduce pain and inflammation in joints, across clinical settings, for common joint pain indications.
Scope exclusions: Oral pain medicines, topical products, physiotherapy-only care, and joint replacement surgery are excluded from this market sizing.
Segments Covered in This Report
- By Injection Type
- Steroid Joint Injections
- Hyaluronic Acid (HA) Injections
- Platelet-Rich Plasma (PRP) Injections
- Placental Tissue Matrix (PTM) & MSC Injections
- Other Biologic / Combination Injections
- By Injection Cycle
- Single-cycle
- Three-cycle
- Five-cycle
- By Application
- Knee & Ankle
- Shoulder & Elbow
- Hip Joint
- Spinal Facet & SI Joints
- Other Small Joints
- By End User
- Hospitals
- Ambulatory Surgical Centers (ASCs)
- Orthopedic / Pain Clinics
- Sports Medicine Centers
- Home-Care Settings
- By Geography
- North America
- United States
- Canada
- Mexico
- Europe
- Germany
- United Kingdom
- France
- Italy
- Spain
- Rest of Europe
- Asia-Pacific
- China
- Japan
- India
- Australia
- South Korea
- Rest of Asia-Pacific
- Middle East & Africa
- GCC
- South Africa
- Rest of Middle East & Africa
- South America
- Brazil
- Argentina
- Rest of South America
- North America
Data Sources, Market Sizing, and Validation
Desk Research
Desk work starts by mapping what is being counted, then aligning it to public signals that tend to move with procedure volumes and patient demand. We review guidance and statistics from sources such as the US CDC, the US FDA, the WHO, and the OECD to understand disease burden, safety notes, and health system trends that influence injection use.
Next, the sizing inputs are stress-tested using payer and utilization context from sources such as CMS data releases, peer-reviewed orthopedic and sports medicine journals, and selected trade association publications. We also review company annual reports, investor presentations, earnings call transcripts, and reputable press coverage to clarify product positioning, geographic exposure, and expected pricing direction. In addition, we use approved paid subscriptions for company financials and intelligence, patent databases, and an import and export shipment-level database where it helps explain supply patterns. The specific sources listed here are illustrative, and many other public references were used for data collection, validation, and research clarification.
Primary Interviews and Surveys
Primary inputs are used to confirm how injection choice changes by joint type and patient profile, and to reality-check assumptions on dose per course, repeat intervals, and the setting of care. We speak with a mix of clinicians, distributors, and product-side executives across APAC, EMEA, and the Americas so the model reflects differences in treatment pathways, reimbursement friction, and private-pay adoption.
Distribution of primary research fieldwork respondents
| Company type | Respondent position | Region |
|---|---|---|
| Top tier: 38% | CXOs: 12% | APAC: 47% |
| Mid tier: 47% | Functional/Unit leaders: 31% | EMEA: 31% |
| Smaller Players: 15% | Managers: 57% | Americas: 22% |
Market-Sizing & Forecasting
Our model is built from a demand-pool view where epidemiology and treated-patient cohorts are converted into expected injection usage, then translated into revenue using typical price points by therapy class. The top-down approach is anchored on the number of patients treated for joint pain conditions and the average number of injection events per treated patient in a year, then adjusted for access and reimbursement differences by region.
To keep totals realistic, we cross-check the results with selective bottom-up approximations based on sampled supplier revenues, channel checks with distributors and clinics, and ASP-times-volume spot checks for the most common injection categories. Key variables used include osteoarthritis prevalence and aging mix, procedure volumes in orthopedic and pain clinics, split of injections by therapy type (steroid, hyaluronic acid, PRP, and biologic or combination products), repeat interval patterns by joint (knee versus smaller joints), and the shift of care toward ambulatory surgical centers and specialty clinics.
For forecasting, we rely on scenario analysis supported by expert views on reimbursement direction, adoption of biologic options, and expected pricing pressure. When data gaps appear for newer biologic or combination injections, assumptions are bridged using adjacent therapy adoption curves, then corrected through follow-up calls with respondents who actively manage product portfolios or clinic operations.
Data Validation & Update Cycle
Validation is done in layers so single-source bias does not drive the output. We compare modeled revenue totals against independent indicators such as procedure volume direction, payer coverage changes, and stated company exposure, then investigate outliers before locking assumptions.
A second analyst review is completed for calculations, unit logic, and currency handling, followed by a final consistency check across regions and therapy classes. Reports are refreshed annually, and interim updates are triggered when material events occur, such as new safety warnings, reimbursement changes, or major launches that can shift utilization. Before delivery, we do a fresh pass on recent public updates so clients receive the latest view while still following the same repeatable steps.
Mordor Intelligence's Joint Pain Injections Market Size Compared With Other Published Estimates
Published market values for joint pain injections can look far apart even when the topic sounds the same, because each publisher makes different choices on what products to include, which year is treated as the base, and how price and volume are projected forward. Differences also come from whether sizing follows a treated-patient demand pool, a procedure-based build, or a revenue roll-up from selected companies.
In this study, the biggest gap drivers are usually whether biologic or combination injections are counted alongside steroid, hyaluronic acid, PRP, and PTM types, how repeat-use assumptions are set by joint and care setting, and how currency and inflation are applied to ASP over time. The table also reflects that some estimates extend the forecast out to 2034 to 2035 with more aggressive uptake curves, while others keep slower adoption for newer therapies, and that can shift the current-year figure when back-calculations are used.
Benchmark comparison
| Source | Market Size | Gaps in Research Methodology |
|---|---|---|
| Mordor Intelligence | USD 6.43 B (2026) | |
| Global Consultancy A | USD 6.97 B (2026) | This estimate appears to use a narrower injection-type list and applies a faster growth curve into a longer horizon, which can lift the 2026 value through higher assumed ASP progression. |
| Industry Publisher B | USD 6.03 B (2025) | This estimate uses a different base year and may apply lower repeat-rate assumptions and more conservative pricing for biologic and PTM categories, which compresses the starting market value. |
Overall, the spread is mainly explained by product-scope choices and by how repeat frequency and pricing are carried through the model, rather than by one single data point. By keeping injection types explicit (including biologic and combination classes) and tying usage to treated-patient and setting-of-care checks, the market total is kept traceable to clear inputs, a modeling choice applied by Mordor Intelligence.


Key Questions Answered in the Report
What is the current value of the global joint pain injections market?
The joint pain injections market size is USD 6.43 billion in 2026.
How fast is the market expected to grow through 2031?
The market is projected to expand at a 7.35% CAGR, reaching USD 9.16 billion by 2031.
Which injection type is growing fastest?
Platelet-rich plasma is forecast to record the highest 8.72% CAGR to 2031.
Why are ambulatory surgery centers gaining share?
ASCs offer 40-60% lower episode costs and benefit from expanding bundled-payment coverage, spurring a 12.98% CAGR in procedure volume.
Which region is expanding most rapidly?
Asia-Pacific leads with an 10.79% CAGR thanks to high osteoarthritis prevalence and accelerated device approvals.
How does single-dose HA influence treatment economics?
Single-injection protocols cut follow-up visits, lower total costs, and have shown a 44% reduction in knee-replacement risk in large health-system studies.
Page last updated on:


 Your data is secure and never sold or shared.


