Japan Smart Home Market Size and Share
Market Overview
| Study Period | 2020 - 2031 |
|---|---|
| Forecast Data Period | 2026 - 2031 |
| Historical Data Period | 2020 - 2024 |
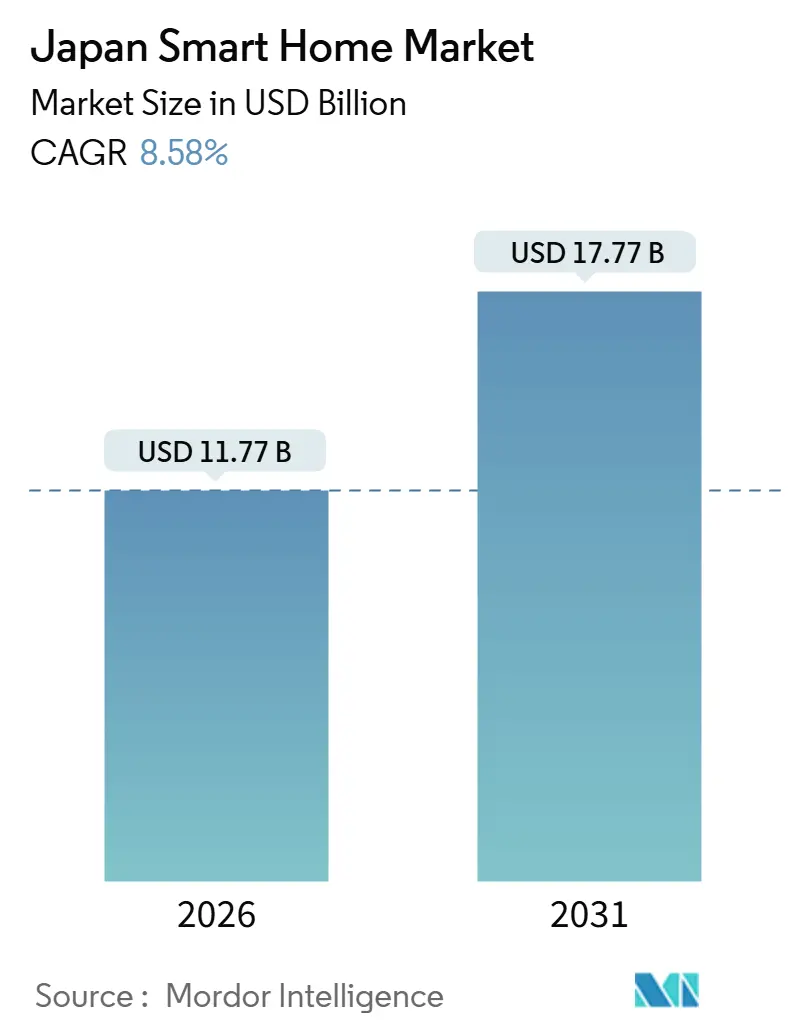
| Market Size (2026) | USD 11.77 Billion |
| Market Size (2031) | USD 17.77 Billion |
| Growth Rate (2026 - 2031) | 8.58% CAGR |
| Market Concentration | Medium |
Major Players *Disclaimer: Major Players sorted in no particular order Image © Mordor Intelligence. Reuse requires attribution under CC BY 4.0. | |
Japan Smart Home Market Analysis by Mordor Intelligence
The Japan smart home market size is USD 11.77 billion in 2026 and is projected to reach USD 17.77 billion by 2031, advancing at an 8.58% CAGR. Strong demographic pressure from an aging population, rising energy-efficiency mandates, and government subsidies for zero-energy houses are redirecting demand from novelty devices toward assistive living and energy-management solutions. Insurance discounts for connected security equipment, the spread of Matter-certified devices, and telecom-operator bundles are further lowering adoption hurdles. Competition revolves around ecosystem lock-in, with domestic appliance majors leveraging trusted brands while global platforms subsidize voice-assistant hardware to win recurring service revenue. Thread-based sensors are mitigating Wi-Fi congestion in dense apartments, and edge AI processing is easing privacy concerns by keeping data on-device.
Key Report Takeaways
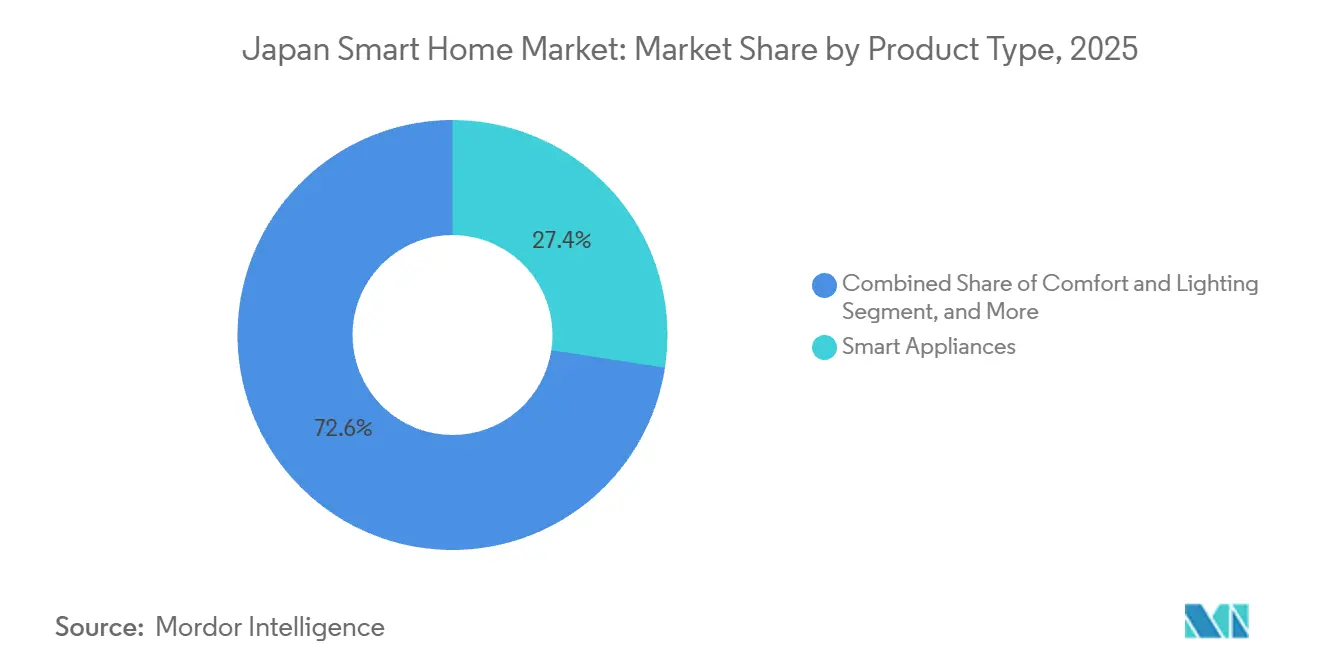
- By product type, smart appliances held 27.43% revenue share in 2025, while security devices are forecast to expand at a 10.81% CAGR through 2031.
- By technology, Wi-Fi accounted for 45.12% of connectivity share in 2025, whereas Thread protocol is projected to grow at a 9.23% CAGR to 2031.
- By sales channel, online retail captured 38.63% of purchases in 2025, while telecom-operator bundles are advancing at an 11.61% CAGR through 2031.
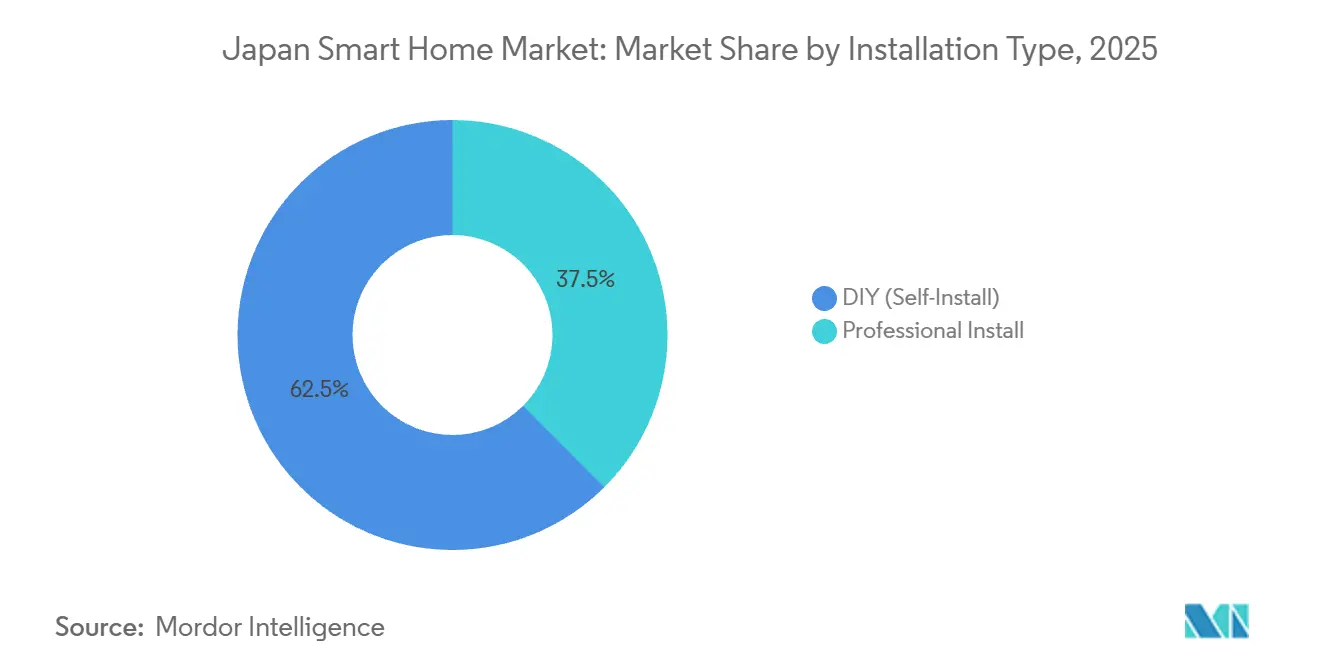
- By installation type, DIY deployments commanded 62.47% share in 2025 and are expected to grow at a 12.39% CAGR to 2031.
- By dwelling type, apartments and condominiums represented 41.63% of 2025 spending, whereas detached houses are on track for an 11.13% CAGR to 2031.
- By geography, Kanto secured 32.00% share in 2025, while Kyushu and Okinawa are anticipated to post a 9.48% CAGR through 2031.
Note: Market size and forecast figures in this report are generated using Mordor Intelligence’s proprietary estimation framework, updated with the latest available data and insights as of January 2026.
Japan Smart Home Market Trends and Insights
Drivers Impact Analysis*
| Driver | (~) % Impact on CAGR Forecast | Geographic Relevance | Impact Timeline |
|---|---|---|---|
| Rising concern about home security and safety | +1.8% | National, with early gains in Kanto, Kansai, and Kyushu | Medium term (2-4 years) |
| Advances in IoT, AI and voice-controlled assistants | +2.1% | National, concentrated in Kanto and Kansai urban centers | Short term (≤ 2 years) |
| Ageing-in-place needs driving assistive technologies | +2.3% | National, acute in Hokkaido, Tohoku, and Shikoku | Long term (≥ 4 years) |
| Government energy-efficiency subsidies for smart devices | +1.5% | National, higher uptake in Chubu and Kyushu | Medium term (2-4 years) |
| Smart-city pilot subsidies integrating residential data | +0.9% | Kanto, Kansai, and Chubu metropolitan zones | Long term (≥ 4 years) |
| Property-insurance discounts for smart-home devices | +0.7% | National, early adopters in Kanto and Kansai | Medium term (2-4 years) |
| Source: Mordor Intelligence | |||
Ageing-in-Place Needs Driving Assistive Technologies
Japan’s over-65 cohort reached 36.2 million in 2025, and municipalities now subsidize motion sensors, fall-detection wearables, and voice-activated lighting to let seniors remain at home rather than relocate to care facilities. Panasonic’s HomeX platform integrates locks, emergency buttons, and caregiver dashboards, while NEC pilots AI anomaly detection that alerts families when routines deviate. These solutions resonate in rural prefectures where medical facilities are sparse and response times long. Uptake is accelerating as hardware bundles spread through telecom contracts that spread costs over 24 months. The demographic shift will keep assistive technology at the center of Japan smart home market growth well into the next decade.
Advances in IoT, AI, and Voice-Controlled Assistants
Cumulative Alexa and Google Assistant installations surpassed 15 million units by 2025, yet local players such as Sony embed Japanese-language AI in TVs and appliances to overcome privacy and dialect concerns. Matter 1.3 certification lets users mix Panasonic air conditioners with Sharp refrigerators under one app, reducing fragmentation that previously deterred multi-brand households. Edge AI controllers from Mitsubishi Electric optimize HVAC without sending raw data to cloud servers, aligning with strict data-residency rules. Hardware subsidies, tighter speech recognition, and cross-brand interoperability are shortening replacement cycles, and in turn enlarging the Japan smart home market base across urban and rural regions.
Rising Concern About Home Security and Safety
Public anxiety rose after high-profile break-ins in 2024-2025, prompting insurers to cut premiums 5-10% for homes fitted with smart locks and cameras. Together, dual-income households and elderly residents living alone represent more than 40% of households and value biometric locks, and AI doorbells that differentiate genuine visitors from potential threats. Property developers now pre-install video doorbells in new condos to stand out in competitive urban markets. Falling device costs and bundled telecom packages are keeping double-digit growth intact for security devices through 2028, pushing the Japan smart home market toward deeper penetration of safety-driven solutions.
Government Energy-Efficiency Subsidies for Smart Devices
The Zero Energy House program offers homeowners rebates up to JPY 1.4 million (USD 9,500) on thermostats, solar inverters, and battery systems that meet strict efficiency thresholds. Utilities such as Tokyo Electric Power Company layer demand-response credits on top, rewarding households for curbing peak-hour consumption. Panasonic HEMS and Mitsubishi Electric Ene-Look controllers dynamically shift HVAC loads in response to real-time tariffs, delivering cash savings that shorten payback periods. As fossil-fuel prices rise, these subsidies are expected to keep energy-management hardware growing in the high-teens range through 2029.
Restraints Impact Analysis*
| Restraint | (~) % Impact on CAGR Forecast | Geographic Relevance | Impact Timeline |
|---|---|---|---|
| High upfront hardware and installation cost | -1.4% | National, acute in rural Hokkaido, Tohoku, and Shikoku | Short term (≤ 2 years) |
| Interoperability and legacy system issues | -1.1% | National, concentrated in older housing stock | Medium term (2-4 years) |
| Data-residency rules limiting foreign cloud platforms | -0.6% | National, affecting global platform providers | Long term (≥ 4 years) |
| Shortage of certified installers in rural prefectures | -0.5% | Hokkaido, Tohoku, Shikoku, and mountainous Chubu | Medium term (2-4 years) |
| Source: Mordor Intelligence | |||
High Upfront Hardware and Installation Cost
A professionally installed whole-home package can top JPY 800,000 (USD 5,400), placing smart automation beyond many middle-income buyers. Import tariffs, limited economies of scale, and premium finish requirements inflate equipment prices above North American norms. Labor adds 20-30% because electricians in major cities charge more than JPY 8,000 (USD 54) per hour. Telecom bundles and subscription models spread payments over time, yet sticker shock remains the largest brake on the Japan smart home market, especially in rural districts where incomes are lower.
Interoperability and Legacy System Issues
Roughly 13 million homes built before 1990 lack wiring or wall space for modern devices. Incompatibility among Zigbee, Z-Wave, Wi-Fi, and proprietary protocols forces costly work-arounds and brand-specific hubs. Legacy HVAC units from the late 1990s require proprietary adapters that often go out of stock. Although Matter promises a universal layer, full relief will take years as firmware upgrades trickle out. Until adoption surpasses half of new shipments, interoperability gaps will remain a drag on the Japan smart home market CAGR.
*Our forecasts treat driver/restraint impacts as directional, not additive. The impact forecasts reflect baseline growth, mix effects, and variable interactions.
Segment Analysis
By Product Type: Security Devices Outpace Appliance Incumbents
Security devices will generate the highest incremental revenue, advancing at a 10.81% CAGR through 2031 as insurers incentivize adoption and urban residents seek remote monitoring. Smart appliances nonetheless dominated the Japan smart home market share at 27.43% in 2025 on the back of Panasonic, Hitachi, and Sharp ecosystems that sync with energy-management dashboards.
Security offerings now bundle biometric locks, AI cameras, and cloud storage, creating service revenue that offsets hardware price erosion. Control hubs and speakers from Amazon and Google bridge multiple devices, while home entertainment rivals seek growth in rural prefectures where broadband rollout is closing the digital divide. Energy-management devices are mandated in zero-energy houses, forcing manufacturers to integrate across formerly stand-alone categories and compressing margins in single-function product lines.


By Technology: Thread Protocol Challenges Wi-Fi Dominance
Wi-Fi accounted for 45.12% of connectivity in 2025 thanks to existing router infrastructure, yet Thread sensors are set to erode share with a 9.23% CAGR through 2031. Thread’s low-power mesh reduces battery drain and network congestion in dense apartments, traits valued by younger renters who lead DIY purchases.
Bluetooth remains popular for smart speakers and locks, though range limits restrict full-home coverage. Z-Wave adoption lags due to frequency restrictions and limited vendor support. Matter certification is accelerating cross-brand compatibility, and IPv6 transition is laying groundwork for massive device counts in future smart-city deployments, keeping interoperability front and center in the Japan smart home market size expansion.
By Sales Channel: Telecom Bundles Reshape Distribution Economics
Online retail commanded 38.63% of 2025 sales after Amazon Japan and Rakuten perfected same-day delivery, aggressive discounting, and review curation. However, telecom-operator bundles are projected to post an 11.61% CAGR, the fastest among channels, as NTT, KDDI, and SoftBank embed cameras, speakers, and HEMS controllers into fiber and 5G packages that cut upfront cost to zero for 24-month contracts.
Brick-and-mortar chains such as Bic Camera still help consumers touch and test devices, but foot traffic slipped 8% in 2025. Professional installers focus on high-end projects, yet their share erodes as DIY hardware and telecom bundles bypass them. Subscription economics are shifting the Japan smart home market toward annuity revenue that rewards long-term engagement over transactional sales.
By Installation Type: DIY Adoption Accelerates Amid Installer Shortages
DIY options represented 62.47% of deployments in 2025 and are projected to expand at a 12.39% CAGR. Younger urban buyers favor QR-code provisioning and app-guided setup, while rural customers adopt DIY out of necessity because certified installers are scarce.
Professional installation still anchors luxury condominiums and commercial projects requiring hidden wiring, multi-zone HVAC, and ongoing maintenance. Hybrid models are emerging as consumers buy devices online then hire integrators for configuration. Property developers pre-wire new units so residents can activate services through telecom portals, speeding adoption and bolstering Japan smart home market size growth.
By Dwelling Type: Detached Houses Lead Growth Amid Renovation Wave
Apartments and condominiums held 41.63% of expenditure in 2025, reflecting Japan’s urban density, but detached houses are forecast to climb at an 11.13% CAGR as owners retrofit for energy efficiency and accessibility. Detached dwellings offer roof space for solar panels and battery systems that boost energy independence, especially in grid-constrained rural areas.
Landlords remain cautious without clear rent premiums, so renter uptake hinges on telecom bundles that avoid property modifications. Multi-generational homes need zoned climate control and privacy partitions, pushing niche demand for customizable ecosystems. Renovations driven by the baby-boomer cohort keep Japan smart home market share growth tilted toward owner-occupied properties.
Geography Analysis
Kanto captured 32.00% of 2025 revenue on the strength of Tokyo’s high disposable incomes, advanced retail logistics, and early smart-city pilots in Yokohama and Kawasaki. Dual-income professionals and tech-savvy millennials are accelerating the adoption of voice assistants, security cameras, and energy management systems.
Kyushu and Okinawa are the fastest climbers, advancing at a 9.48% CAGR to 2031 as renewable microgrids, disaster-preparedness mandates after recent typhoons, and zero-energy house subsidies boost device installs. Kansai leverages its manufacturing base and Osaka’s smart-city blueprint for mid-single-digit growth, while Chubu benefits from Toyota’s connected-home experiments and Mitsubishi Electric’s HVAC hub.
Hokkaido and Tohoku face broadband gaps and installer shortages, yet harsh winters drive smart thermostat deployment. Shikoku and Chugoku log moderate gains through Hiroshima’s smart-city projects and Takamatsu’s telecom pilots. Fiber and 5G rollouts are diffusing beyond metros, narrowing the urban-rural gap and broadening the Japan smart home market size across prefectures.
Competitive Landscape
The market shows moderate fragmentation with platform giants, appliance majors, and regional integrators vying for lock-in. Amazon and Google subsidize hardware to monetize commerce and services, eroding margins but capturing voice interface share. Panasonic, Sony, and Mitsubishi Electric rely on trusted brands, nationwide after-sales networks, and integration with existing HVAC and appliance bases, yet proprietary protocols expose them to Matter-driven disruption.
Schneider Electric, Honeywell, and Siemens focus on custom high-end projects, commanding premium prices for energy management and integration. Chinese vendors such as Xiaomi target price-sensitive consumers, pushing feature-rich devices at low prices. Telecom operators disrupt retail by bundling devices into connectivity contracts, securing recurring revenue and higher customer retention.
White-space opportunities include elder-care solutions that merge health monitoring with emergency response. Patent filings on Matter integration and Thread networking rose 40% year-over-year in 2025, foreshadowing intense R&D competition. Data-residency laws force foreign players to localize infrastructure, raising entry costs yet opening niches for domestic cloud providers. This competitive fluidity is expected to tighten ecosystem battles and shape future Japan smart home market share allocations.
Japan Smart Home Industry Leaders
Schneider Electric SE
Emerson Electric Co.
ABB Ltd.
Honeywell International Inc.
Siemens AG
- *Disclaimer: Major Players sorted in no particular order


Recent Industry Developments
- October 2025: Panasonic Holdings partnered with Amazon Web Services to embed HomeX with AWS IoT Core for 15% energy savings via predictive maintenance.
- September 2025: NTT introduced Hikari Cross 2.0 bundling speakers, cameras, and HEMS with fiber subscriptions under 24-month contracts.
- July 2025: Sony unveiled an Aibo-based home-monitoring system for fall detection and anomaly alerts aimed at elderly residents.
- May 2025: Mitsubishi Electric expanded the capacity of its Shizuoka plant by 25% with a JPY 8 billion (USD 54 million) investment in AI-powered HVAC units.


Research Methodology Framework and Report Scope
Market Definitions and Key Coverage
Our study defines Japan's smart home market as the sale value of connected devices, enabling software, and installation services that let households remotely or automatically manage lighting, security, energy, entertainment, HVAC, and major appliances.
Scope excludes commercial building automation platforms and single function consumer gadgets such as wireless headsets.
Segmentation Overview
- By Product Type
- Comfort and Lighting
- Smart Lighting (Bulbs, Switches, Dimmers)
- Smart Curtains/Blinds
- Control and Connectivity
- Smart Hubs/Controllers
- Smart Speakers
- Energy Management
- Smart Thermostats
- Smart Meters
- Home Entertainment
- Smart TVs
- Streaming Devices
- Security
- Smart Cameras
- Smart Doorbells
- Smart Locks
- Smart Appliances
- Smart Refrigerators
- Smart Washing Machines
- HVAC Control
- Smart Air-Conditioners
- Comfort and Lighting
- By Technology
- Wi-Fi
- Bluetooth
- Zigbee
- Z-Wave
- Thread
- Other Technologies (LTE, PLC, etc.)
- By Sales Channel
- Offline Retail/CE Stores
- Online Retail and Marketplaces
- Professional Installer/Dealer Channel
- Telecom-Operator Bundles
- By Installation Type
- DIY (Self-Install)
- Professional Install
- By Dwelling Type
- Detached Houses
- Apartments and Condominiums
- Other Dwelling Types
Detailed Research Methodology and Data Validation
Primary Research
We then interview device OEM managers, telecom bundle strategists, e-commerce merchants, and certified installers across Kanto, Kansai, Kyushu, and Hokkaido. These conversations validate channel mix, average selling prices, subsidy uptake, and emerging buyer cohorts, letting our team adjust secondary signals that appear inconsistent.
Desk Research
Mordor analysts first compile foundational data from tier 1 public sources such as the Ministry of Internal Affairs and Communications' ICT Usage Survey, METI's Residential Appliance Production tables, the Japan Smart Home Council's device census, customs shipment files, and academic journals on IoT adoption. Financial filings, investor decks, and reputable press deepen firm level insight, while paid databases, D&B Hoovers for company revenues and Questel for patent counts, sharpen competitive context. Numerous additional sources are also reviewed to cross-check facts and fill minor gaps.
Market-Sizing & Forecasting
A top down household penetration model estimates 2024 demand by applying device adoption rates to housing stock by dwelling type, which is then reconciled with selective bottom up checks (sampled manufacturer shipments × ASPs). Key variables like broadband penetration, Zero Energy Home subsidy claims, residential electricity price, aging population ratio, and annual smart speaker installs drive scenario assumptions. Multivariate regression with ARIMA overlays projects each variable, producing a 2025-2030 value forecast; anomalies prompt iterative tweaking until primary contributors agree the curve reflects realistic uptake.
Data Validation & Update Cycle
Outputs undergo three tier analyst review, variance testing against import data and utility smart meter rollouts, and quarterly alert checks. Reports refresh annually, and before delivery we run a last minute pass so clients see the newest view.
Why Mordor's Japan Smart Home Baseline Commands Reliability
Published estimates differ.
Other studies quote the market at USD 7.93 billion for 2024 and USD 8.10 billion for 2024, respectively. Such gaps usually stem from mismatched scope, aggressive CAGR choices, or limited channel coverage.
Benchmark comparison
| Market Size | Anonymized source | Primary gap driver |
|---|---|---|
| USD 10.84 B (2025) | Mordor Intelligence | - |
| USD 7.93 B (2024) | Global Consultancy A | Counts mainly security and access devices; assumes uniform 26% CAGR without regional channel checks |
| USD 8.10 B (2024) | Analyst Firm B | Excludes smart appliance revenue and relies on service fees, inflating future growth |
| USD 5.67 B (2023) | Industry Publisher C | Uses retail only data, omits telecom bundles and professional install charges |
The comparison shows that once scope breadth, data cadence, and mixed method validation are standardized, Mordor's balanced baseline emerges as the most dependable footing for strategic planning. We believe our transparent variables and repeatable steps give decision makers clarity they can trust.


Key Questions Answered in the Report
How big is the Japan smart home market in 2026?
The Japan smart home market size stands at USD 11.77 billion in 2026 and is projected to rise to USD 17.77 billion by 2031.
What is the main growth driver for smart home demand in Japan?
A rapidly aging population, which now accounts for almost one-third of residents, is boosting demand for assistive technologies that enable seniors to live independently.
Which product category is growing fastest?
Security devices, helped by insurance premium discounts and lower hardware prices, are forecast to expand at a 10.81% CAGR through 2031.
Why are telecom bundles important to adoption?
Bundled offers from NTT, KDDI, and SoftBank eliminate upfront hardware costs, making entry affordable and locking customers into 24-month service contracts.
Which connectivity protocol will gain the most share?
Thread is projected to grow at a 9.23% CAGR because its battery-friendly mesh network suits dense apartment living and aligns with the Matter standard.
What is the biggest barrier to wider penetration?
High upfront hardware and professional installation costs remain the primary restraint, especially in rural areas with lower household incomes.
Page last updated on:


