Japan LED Lighting Market Size and Share
Market Overview
| Study Period | 2020 - 2031 |
|---|---|
| Forecast Data Period | 2026 - 2031 |
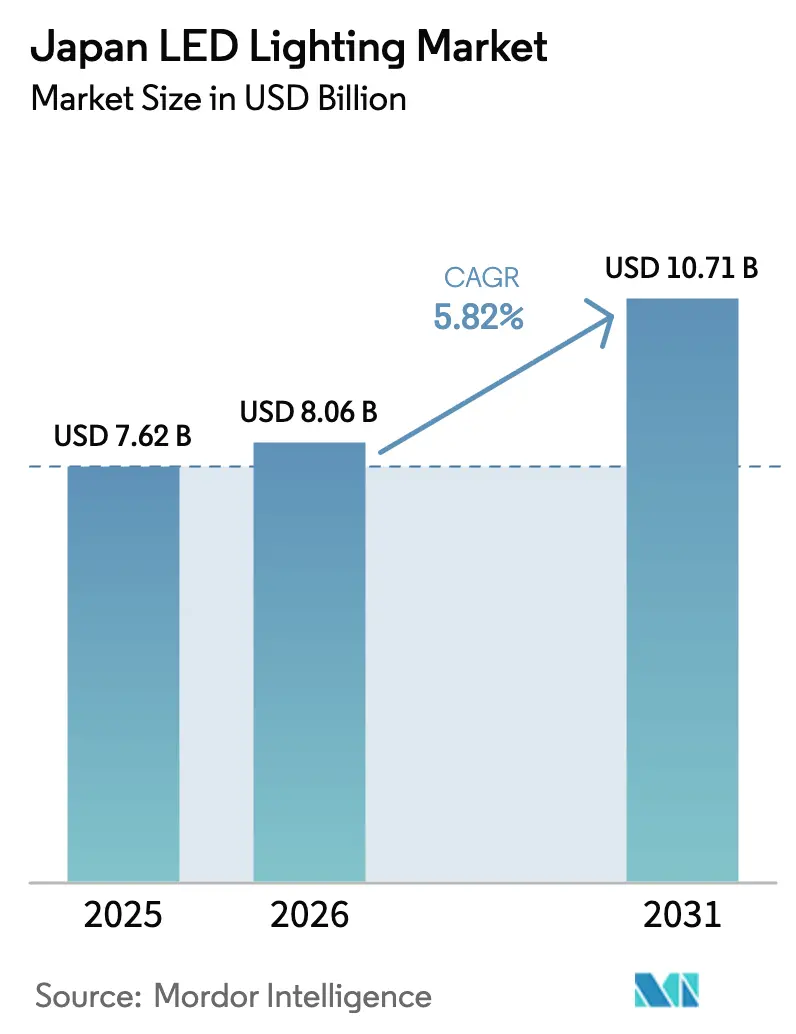
| Base Year Market Size (2025) | USD 7.62 Billion |
| Market Size (2026) | USD 8.06 Billion |
| Market Size (2031) | USD 10.71 Billion |
| Growth Rate (2026 - 2031) | 5.82% CAGR |
| Market Concentration | Medium |
Major Players *Disclaimer: Major Players sorted in no particular order Image © Mordor Intelligence. Reuse requires attribution under CC BY 4.0. | |
Japan LED Lighting Market Analysis by Mordor Intelligence
Japan's LED lighting market size in 2026 is estimated at USD 8.06 billion, growing from 2025 value of USD 7.62 billion with 2031 projections showing USD 10.71 billion, growing at 5.82% CAGR over 2026-2031. Steady expansion stems from the 2027 fluorescent-lamp ban mandated by the Minamata Convention, stringent revisions to the Energy Conservation Law, and the acceleration of smart-city programs that make connected luminaires an essential municipal asset. Supply-side resilience strategies adopted after China’s export controls on gallium and germanium further reinforce domestic value addition, while premium applications such as UV-C disinfection and horticulture lighting preserve margins amid rising import competition.[1]IndraStra Global, “Japan Issues Stark Warning Over China's Chip Material Export Controls,” indrastra.com Retrofit upgrades dominate demand because Japan possesses a highly built urban fabric; however, new installations tied to smart poles and plant factories provide incremental volume. E-commerce also continues to reshape consumer access, especially in the residential segment, where deadline-driven replacement purchases are on the rise.
Key Report Takeaways
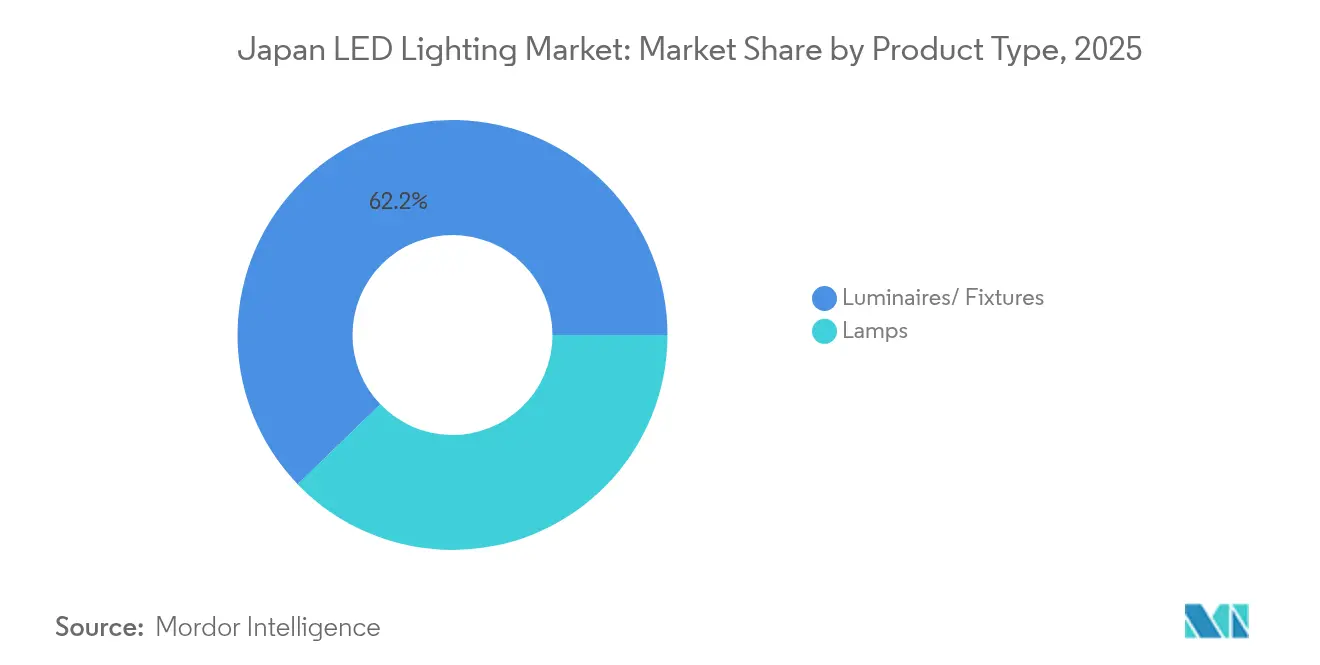
- By product type, luminaires held 62.20% of Japan's LED lighting market share in 2025, whereas lamps are set to expand at an 8.35% CAGR through 2031.
- By distribution channel, wholesale and retail controlled 54.30% of sales in 2025, while e-commerce is projected to post a 7.12% CAGR to 2031.
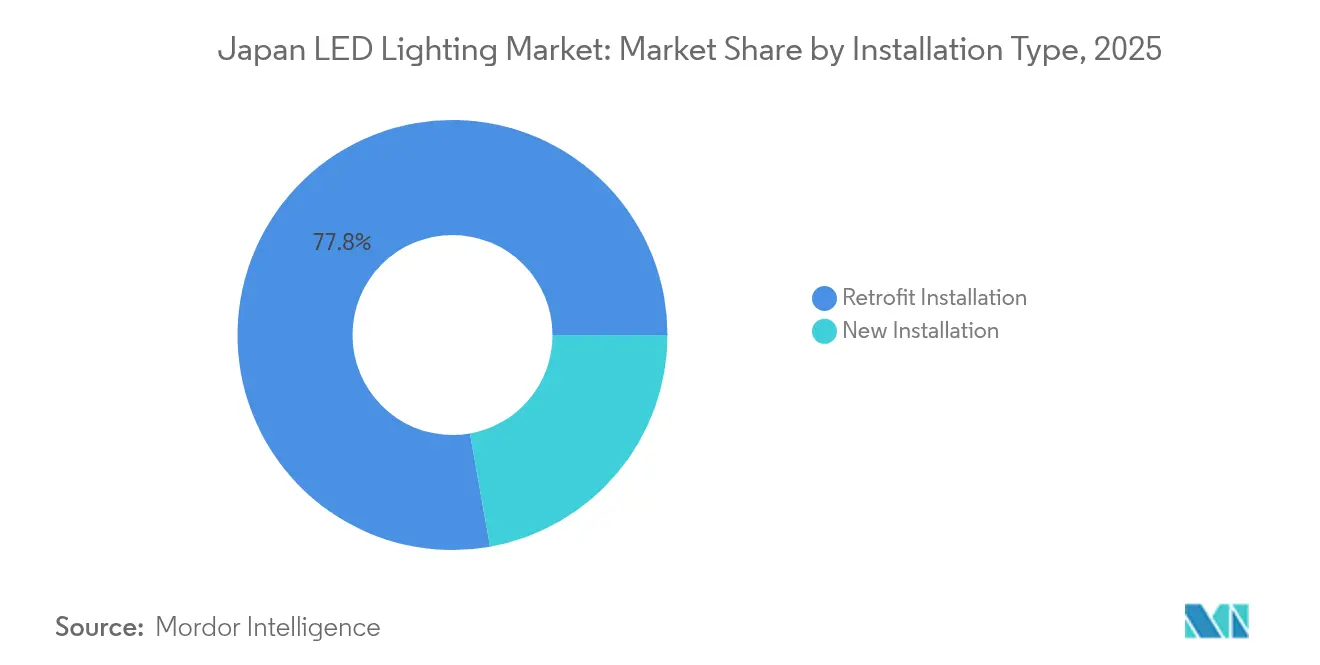
- By installation type, retrofit projects accounted for 77.80% of the Japan LED lighting market size in 2025, and new installations are growing at a 7.45% CAGR.
- By application, residential retained the largest slice at 20.05% in 2025, yet highway and roadway lighting is advancing at a 9.25% CAGR toward 2031.
- By end user, indoor spaces represented 62.90% of 2025 demand, while outdoor deployments are accelerating at a 9.01% CAGR, driven by smart-pole rollouts.
Note: Market size and forecast figures in this report are generated using Mordor Intelligence’s proprietary estimation framework, updated with the latest available data and insights as of 2026.
Japan LED Lighting Market Trends and Insights
Drivers Impact Analysis*
| Driver | (~) % Impact on CAGR Forecast | Geographic Relevance | Impact Timeline |
|---|---|---|---|
| Stringent energy-efficiency mandates and mercury-lamp phase-out | +1.8% | National, with accelerated adoption in major metropolitan areas | Medium term (2-4 years) |
| Post-Fukushima retrofit boom in commercial and residential buildings | +1.2% | National, with the highest intensity in the Tohoku and Kanto regions | Long term (≥ 4 years) |
| Accelerating smart-city and smart-pole deployments | +0.9% | Urban centers, expanding to suburban municipalities | Medium term (2-4 years) |
| OEM shift to LED headlamps in Japan-built vehicles | +0.7% | National automotive manufacturing hubs | Short term (≤ 2 years) |
| Hospital demand for UV-C disinfection luminaires | +0.5% | National healthcare infrastructure | Short term (≤ 2 years) |
| Vertical-farm and horticulture LED demand spike | +0.3% | Agricultural regions and urban plant factories | Long term (≥ 4 years) |
| Source: Mordor Intelligence | |||


Stringent Energy-Efficiency Mandates and Mercury-Lamp Phase-Out
Japan’s convergence of the Minamata Convention’s 2027 ban on fluorescent lighting and the upgraded Energy Conservation Law eliminates any remaining cost-benefit debate, making LED adoption compulsory across all sectors. Municipal subsidies such as Iwata City’s JPY 30 million (USD 0.2 million) incentive accelerate residential conversions ahead of the deadline. Revised JIS Z 9112:2019 standards classify luminaires by application, creating premium niches for high-color-rendering units. Despite 60% consumer awareness, nearly half of households have not yet acted, underscoring latent demand that will be unlocked as the cutoff nears. Mandatory replacement removes uncertainty and ensures a structural growth runway for the Japan LED lighting market.
Post-Fukushima Retrofit Boom in Commercial and Residential Buildings
Electricity tariffs have surged 59% for households and 92% for industrial users since 2011, making energy-efficient lights integral to cost management. ESCO contracts, pioneered by firms such as Azbil, allow property owners to implement upgrades without upfront capital, guaranteeing future savings.[2]JETRO, “Business Catalog by Japanese Companies Contributing to Indonesia's Decarbonization,” jetro.go.jp Local governments lead by example: Yatsushiro City is auditing 290 facilities for complete LED conversion as part of its Zero Carbon strategy. National building codes require new structures to meet Net Zero Energy House standards by 2030, embedding advanced lighting into every construction plan. Retrofits, therefore, remain a dependable volume driver for the Japan LED lighting market well beyond the initial Fukushima recovery.
Accelerating Smart-City and Smart-Pole Deployments
Smart poles transform lighting into a platform offering 5G backhaul, CCTV, and environmental sensing. Panasonic’s smartphone-based maintenance system across Ehime Prefecture illustrates cost‐saving diagnostics. Secual’s retrofit module attaches connectivity to existing poles, cutting capex and quickening municipal rollouts. MinebeaMitsumi will supply 178 mesh-networked streetlights for the 2025 Osaka Expo, underscoring the event’s role as a living lab for multipurpose luminaires. Government Digital Rural City subsidies offset initial expenses, widening adoption beyond megacities. These deployments inject new momentum into the Japan LED lighting market by monetizing data and telecom services, not just energy savings.
OEM Shift to LED Headlamps in Japan-Built Vehicles
Automakers embed LED headlamps to meet global safety regulations and ADAS requirements, channeling secure demand to domestic component makers. ICHIKOH’s latest modules for Toyota deliver 30% higher optical efficiency and 60% lower power draw compared with prior models.[3]ICHIKOH Industries, “2024 Integrated Report,” ichikoh.com High-resolution adaptive beams containing over 200,000 pixels position Japanese suppliers at the forefront of next-generation automotive lighting. AMS OSRAM’s standardized XLS platform, showcased in 2024, signals an industry shift toward interchangeable units that lower cost barriers for OEMs. Aftermarket choices, such as PIAA’s 6,000 lm bulbs, ensure continued pull even after the initial vehicle sale. Automotive uptake diversifies revenue streams within the Japan LED lighting market and shields producers from fluctuations in general-purpose segments.
Restraints Impact Analysis*
| Restraint | (~) % Impact on CAGR Forecast | Geographic Relevance | Impact Timeline |
|---|---|---|---|
| High upfront cost vs. legacy fluorescents | -0.8% | National, with a higher impact on the price-sensitive residential segment | Short term (≤ 2 years) |
| Margin squeeze from low-cost imports | -0.6% | National, affecting domestic manufacturers and distributors | Medium term (2-4 years) |
| Phosphor supply constraints for high-CRI devices | -0.4% | National, concentrated in specialty lighting applications | Medium term (2-4 years) |
| Strict WEEE recycling compliance costs | -0.3% | National, with a higher impact on commercial and municipal segments | Long term (≥ 4 years) |
| Source: Mordor Intelligence | |||
High Upfront Cost versus Legacy Fluorescents
Household consumers confront immediate out-of-pocket spending, and 45.7% have yet to begin replacements despite understanding the ban, confirming that price remains a hurdle. Many existing fixtures are incompatible with plug-in LED tubes, necessitating the replacement of entire luminaire fixtures, which further increases costs. Municipal programs, such as Iwata City’s subsidy, partially ease the burden but cover a limited geography. The price barrier primarily delays the uptake of residential LED lighting in Japan; however, ongoing declines in LED costs and expanding incentives are expected to mitigate this constraint.
Margin Squeeze from Low-Cost Imports
Chinese suppliers accounted for USD 43.3 billion, or 74%, of global lighting exports in 2023, compressing margins in commodity segments.[4]LEDinside, “How are Chinese LED Companies Tapping into Overseas Markets?” ledinside.com Simultaneously, China’s export curbs on gallium and germanium lifted raw-material costs by around 30% for Japanese chipmakers. Domestic brands respond by focusing on high-value niches such as UV-C sterilization, automotive, and horticulture, where engineering depth commands premiums. Although brand loyalty and supply-chain diversification offer partial relief, persistent pricing pressure still restrains profit reinvestment across the Japan LED lighting market.
*Our forecasts treat driver/restraint impacts as directional, not additive. The impact forecasts reflect baseline growth, mix effects, and variable interactions.
Segment Analysis
By Product Type: Luminaires Drive Market Value
Luminaires captured 62.20% of Japan's LED lighting market share in 2025, reflecting user preference for integrated solutions with superior thermal management. Lamps, although smaller, are advancing at an 8.35% CAGR as consumers accelerate pre-deadline replacements of fluorescent bulbs. The luminaire's edge is rooted in safety: manufacturers such as Panasonic caution against retrofitting LED tubes into aging fluorescent housings due to the risk of fire. Integrated units also permit embedded wireless controls and occupancy sensors, features increasingly requested in premium office renovations.
Advanced fixture designs from Fukunishi Denki exhibit Panasonic’s LiBecoM system, enabling activity-based dimming for further savings. Meanwhile, lamp-level growth benefits from high-CRI tube offerings specifically designed for photography studios and retail displays. Together, these trends ensure both categories contribute to sustained gains in the Japan LED lighting market.


By Distribution Channel: E-commerce Disrupts Traditional Retail
Wholesale outlets accounted for 54.30% of 2025 sales, remaining vital for contractor-led projects and municipal tenders. Yet e-commerce is projected to clock a 7.12% CAGR through 2031, buoyed by Amazon Japan storefront launches from premium players like Lipro. BicCamera typifies hybrid strategies: its LED ceiling-light catalog combines online ordering with showroom demonstrations to reassure consumers about specifications.
Direct-sales integrators respond by bundling luminaires with installation and maintenance, defending share in complex commercial jobs. For standard residential fixtures, web platforms offer price transparency and next-day delivery, reinforcing the shift in consumer behavior. Digital purchasing thus unlocks new reach for the Japan LED lighting market, particularly among younger households.
By Installation Type: Retrofit Dominance Signals Market Maturity
Retrofit projects accounted for 77.80% of Japan's LED lighting market size in 2025, due to the nation’s vast existing building stock. ESCO models guarantee savings and eliminate upfront capital, appealing to municipalities and factories alike. New installations, which are expanding at a 7.45% CAGR, primarily involve smart infrastructure, vertical farms, and UV-C water treatment systems.
Yatsushiro City’s facility-wide survey typifies the structured approach to upgrades, integrating lighting with energy-management software for performance tracking. Concurrently, plant factories such as Yamamura’s Kirakira Vege deploy tailored spectral LEDs to maximize crop yield. This dual path anchors a robust outlook for the Japan LED lighting market through both modernization and innovation.
By Application: Highway Infrastructure Leads Growth
Residential spaces accounted for 20.05% of demand in 2025, supported by government subsidies and increasing awareness of the fluorescent ban. Highway and roadway lighting, however, is expected to post a 9.25% CAGR, driven by smart-pole conversion schemes and sensor integration along major arteries. Commercial properties pursue upgrades to cut electricity bills and enhance occupant comfort, while hospitals adopt UV-C LED luminaires for disinfection.
Industrial plants turn to ruggedized fixtures rated for harsh environments, and automotive players integrate adaptive headlamps. Horticulture remains a niche but fast-emerging field, with controlled-environment agriculture benefiting from tunable spectra that enhance photosynthesis. Application diversity, therefore, broadens revenue streams inside the Japan LED lighting market.
By End User: Outdoor Growth Outpaces Indoor Maturity
Indoor environments still accounted for 62.90% of revenue in 2025, reflecting Japan’s dense commercial and residential architecture. Yet, outdoor deployments are growing at a 9.01% CAGR through 2031, as municipalities prioritize energy savings and digital functionality. Smart solar streetlights from MIRAI-LABO integrate repurposed EV batteries, delivering off-grid resilience and emergency power.
Indoor retrofits now emphasize the use of IoT controls, daylight harvesting, and human-centric lighting. Outdoor systems pair luminaires with air-quality sensors, 5G antennas, and surveillance cameras, transforming poles into multifunction assets. This split underscores how the Japan LED lighting market is evolving from simple efficiency upgrades to holistic infrastructure solutions.
Geography Analysis
Kanto, anchored by Tokyo, holds the largest share of the Japanese LED lighting market, thanks to its dense building stock, early adoption of smart cities, and corporate headquarters that demand premium fixtures. Retrofit programs targeting aging offices continue to maintain steady growth, while residential conversions surge in suburban prefectures under municipal subsidy schemes. The Tohoku region has experienced accelerated adoption, largely due to post-Fukushima reconstruction grants that favor high-efficiency lighting.
Kansai gains momentum through 2025 Osaka Expo preparations, where MinebeaMitsumi’s 178 smart streetlights symbolize broader municipal upgrades connecting sensors, parking meters, and public Wi-Fi. Kyushu’s progress is exemplified by Yatsushiro City’s 290-facility Zero Carbon plan, positioning the prefecture as a benchmark for holistic energy management. Local governments are also exploring solar-powered luminaires to tap into the region’s renewable energy potential.
Smaller prefectures leverage Digital Rural City funds to bridge the urban-rural gap, adopting smart poles that pair lighting with disaster-alert speakers. Agricultural districts deploy horticulture LEDs inside plant factories to enhance food security. National policies narrow regional disparities, ensuring every prefecture marches toward the 2027 fluorescent cutoff. This geographic convergence solidifies a nationwide foundation for the sustained expansion of the Japan LED lighting market.
Competitive Landscape
Domestic producers maintain a moderate level of concentration by integrating chip fabrication, phosphor chemistry, and fixture assembly. Nichia’s H6 Series attains Ra ≥ 90 with superior efficacy, commanding premiums in retail and museum installations. Ushio’s USD 200 million buyout of ams OSRAM’s lamp assets enhances scale in semiconductor-process lamps and broadens market access. Supply-chain resilience ranks high after the implementation of gallium export controls; manufacturers diversify their sourcing and invest in compound semiconductor research and development (R&D) to secure upstream inputs.
Strategic alliances blossom in emerging niches: Miura partners with Nichia to commercialize UV-C sterilizers that achieve industry-leading 10 m³/h water treatment capacity. Automotive lighting players such as ICHIKOH pursue adaptive high-resolution beams, countering commoditization through proprietary optics. Medium-sized firms focus on value-added services, such as wireless controls and predictive maintenance, thereby differentiating themselves from low-cost imports.
Market entrants emphasize e-commerce and design aesthetics, as evident in Lipro’s Amazon-only launch, which targets health-conscious households with high-quality full-spectrum lighting. Long-term positioning, therefore, depends on technology leadership and channel innovation rather than sheer volume, shaping a competitive arena that rewards R&D commitment across the Japan LED lighting market.
Japan LED Lighting Industry Leaders
Nichia Corporation
Panasonic Holdings Corp.
Toshiba Lighting and Technology Corp.
Sharp Corporation
Koizumi Lighting Technology Corp.
- *Disclaimer: Major Players sorted in no particular order

Recent Industry Developments
- September 2025: Yatsushiro City commissioned Inec to survey 290 facilities for full LED conversion as part of its Zero Carbon plan.
- August 2025: MIRAI-LABO installed off-grid solar streetlights with repurposed EV batteries at the Ministry of Economy, Trade and Industry courtyard.
- July 2025: Ushio Electric announced a USD 200 million acquisition of ams OSRAM’s lamp business, targeting the semiconductor manufacturing lamp market.
- June 2025: Rackland purchased Philips-authorized distributor Nihon P.I. to embed IoT lighting controls into commercial fit-outs.


Japan LED Lighting Market Report Scope
Agricultural Lighting, Commercial, Industrial and Warehouse, Residential are covered as segments by Indoor Lighting. Public Places, Streets and Roadways, Others are covered as segments by Outdoor Lighting. Daytime Running Lights (DRL), Directional Signal Lights, Headlights, Reverse Light, Stop Light, Tail Light, Others are covered as segments by Automotive Utility Lighting. 2 Wheelers, Commercial Vehicles, Passenger Cars are covered as segments by Automotive Vehicle Lighting.| Lamps |
| Luminaires / Fixtures |
| Direct Sales |
| Wholesale Retail |
| E-commerce |
| New Installation |
| Retrofit Installation |
| Commercial Offices |
| Retail Stores |
| Hospitality |
| Industrial |
| Highway and Roadway |
| Architectural |
| Public Places |
| Hospitals |
| Horticulture Gardens |
| Residential |
| Automotive |
| Others (Chemicals, Oil and Gas, Agriculture) |
| Indoor |
| Outdoor |
| Automotive |
| By Product Type | Lamps |
| Luminaires / Fixtures | |
| By Distribution Channel | Direct Sales |
| Wholesale Retail | |
| E-commerce | |
| By Installation Type | New Installation |
| Retrofit Installation | |
| By Application | Commercial Offices |
| Retail Stores | |
| Hospitality | |
| Industrial | |
| Highway and Roadway | |
| Architectural | |
| Public Places | |
| Hospitals | |
| Horticulture Gardens | |
| Residential | |
| Automotive | |
| Others (Chemicals, Oil and Gas, Agriculture) | |
| By End User | Indoor |
| Outdoor | |
| Automotive |


Market Definition
- INDOOR LIGHTING - It incorporates all LED based lamps and fixtures/luminaire that are used to illuminate indoor section of residential, commercial, industrial buildings and agricultural lighting. LED offers efficient brightness with higher durability in comparison to other lighting technology.
- OUTDOOR LIGHTING - It incorporates the LED lighting fixtures that is used for illumination for exterior/outdoor illumination. For instance, LED lighting fixtures used to illuminate streets and highways, transport hubs, stadiums and other public places such as parking spaces.
- AUTOMOTIVE LIGHTING - It refers to the lighting fixtures installed for illumination and signaling purposes. It is used in both exterior and interior lighting of the vehicle. Headlamps, fog lamp, daytime running light (DRLs) are examples of exterior light whereas cabin light are interior lights.
- END USER - It refers to the end use application area where the LED fixture will be installed. For instance, in terms of indoor lighting, we have residential, commercial and industrial as end user category. For automotive lighting, primary end user considered are automotive manufacturers and aftermarket sale
| Keyword | Definition |
|---|---|
| Lumen | Lumen is a unit of luminous flux in the International System of Units that is equal to the amount of light given out through a solid angle by a source of one-candela intensity radiating equally in all directions. |
| Footcandle | A foot-candle (or foot-candle, fc, lm/ft2, or ft-c) is a measurement of light intensity. One foot-candle is defined as enough light to saturate a one-foot square with one lumen of light. |
| Colour Rendering Index (CRI) | Color Rendering Index (CRI) is a measurement of how natural colors render under an artificial white light source when compared with sunlight. The index is measured from 0-100, with a perfect 100 indicating that colors of objects under the light source appear the same as they would under natural sunlight. |
| Luminous flux | Luminous flux is a measure of the power of visible light produced by a light source or light fitting. It is measured in lumens (lm). |
| Annual Energy Cost | Annual Energy Cost means the average daily energy consumption multiplied by 365 (days per year), expressed in kilowatt hour per year (kWh/a). |
| Constant voltage drivers | Constant voltage drivers are designed for a single direct current (DC) output voltage. Most common constant voltage drivers (or Power Supplies) are 12VDC or 24VDC. An LED light that is rated for constant voltage usually specifies the amount of input voltage it needs to operate correctly. |
| Constant Current Driver | Constant current LED drivers are designed for a designated range of output voltages and a fixed output current (mA). LEDs that are rated to operate on a constant current driver require a designated supply of current usually specified in milliamps (mA) or amps (A). These drivers vary the voltage along an electronic circuit which allows current to remain constant throughout the LED system. |
| Minimum Energy Performance Standards (MEPS) | Minimum Energy Performance Standards specify the minimum level of energy performance that appliances and equipment must meet or exceed before they can supply or used for commercial purposes. |
| Luminous Efficacy | Luminous efficacy is a measurement commonly used in the lighting industry that indicates the ability of a light source to emit visible light using a given amount of power. |
| Solid State Lighting | Solid-state lighting (SSL) is a type of lighting that uses semiconductor light-emitting diodes (LEDs), organic light-emitting diodes (OLED), or polymer light-emitting diodes (PLED) as sources of illumination rather than electrical filaments, plasma (used in arc lamps such as fluorescent lamps), or gas. |
| Rated Lamp Life | Lamp life, also referred to as rated life, is the time in hours a lamp will last before a percentage of lamps will burn out. |
| Color Temperature | Colour temperature is a scale that measures how ‘warm’ (yellow) or ‘cool’ (blue) the light from a particular source is. It is measured in degrees of the Kelvin scale (abbreviated to K), and the higher the number, the ‘cooler’ the light. The lower the ‘K’ number, the ‘warmer’ the light. |
| Ingress Protection rating (IP rating) | The IP (Ingress Protection) rating of a bulb or light fixture declares the level of protection it has against dirt and water. |
| Fidelity Index | The general colour fidelity index, Rf, represents how closely the colour appearances of the entire sample set are reproduced (rendered) on average by a test light as compared to those under a reference illuminant. |
| Gamut Index | The gamut area is defined as “the area enclosed by a set of test color samples illuminated by a light source, in a two-dimensional chromaticity diagram or a plane of color space.”1 Within a defined color space, a “gamut” describes the subset of colors that can be perceived under specific lighting conditions. |
| Binning | In the lighting industry, the act of "binning" of LEDs is the process of sorting LEDs by certain characteristics, such as color, voltage, and brightness. |
| Accent lighting | Accent lighting, also called highlighting, emphasizes objects by focusing light directly on them. Accent lighting is used inside and outside the home to feature locations such as an entrance or to create dramatic effects. |
| Dimmable driver | A dimming driver has two functions: As a driver, it converts the 230V AC mains input to a low voltage DC output. As a dimmer, it reduces the amount of electrical energy flowing to the LEDs, thereby causing them to dim. |
| Flicker | Flicker is the repeated and frequent variation in the output of a light source over time. |
| Fluorescent | A property of materials defined as the ability to emit light after absorbing electromagnetic radiation such as visible or UV light. |
| Candela | The candela is the unit of luminous intensity in the International System of Units. It measures the light output per unit solid angle emitted from a light source in a specific direction. |
| LUX | Lux is used to measure the amount of light output in a given area - one lux is equal to one lumen per square meter. It enables us to measure the total "amount" of visible light present and the intensity of the illumination on a surface. |
| Uniformity (U0) | The uniformity of lighting has significant effects on visual performance in both indoor and outdoor areas. Uniformity (represented as U0) value can be found by dividing the minimum brightness (Emin) resulting from calculations according to the current lighting order, to the average brightness value (Eavg). |
| Visible Light Spectrum | The visible light spectrum is the segment of the electromagnetic spectrum that the human eye can view. More simply, this range of wavelengths is called visible light. Typically, the human eye can detect wavelengths from 380 to 700 nanometers. |
| Ambient Temperature | Ambient Temperature is the temperature of the air surrounding an electrical enclosure. |
| Current-controlled dimming control | Current-controlled dimming controls LED brightness by varying the applied current using a 0-10V dimmer. Current-controlled dimming is smooth and HD-video friendly. It can only dim to a minimum of 5% of light output. |
| Design Light Consortium | It is a partnership of energy efficiency stakeholders in the United States and Canada to “promote quality, performance and energy efficient lighting solutions for the commercial sector”. |
| Pulse Width Modulation | Pulse-width modulation, or pulse-duration modulation, is a method of controlling the average power delivered by an electrical signal. |
| Surface Mounted Device | A surface mount device (SMD) is an electronic device whose components are mounted or placed directly on the surface of a printed circuit board. |
| Alternating Current | Alternating current is an electric current which periodically reverses direction and changes its magnitude continuously with time, in contrast to direct current, which flows only in one direction. |
| Direct Current | Direct current (DC) is an electric current that is uni-directional, so the flow of charge is always in the same direction. |
| Beam Angle | Beam angle (also called beam spread) is a measure of how light is distributed. On any plane perpendicular to the centerline of the light, the beam angle is the angle between two rays where the light intensity is 50% of the maximum light intensity. |
| LED Based Solar High Mast Lighting Systems | A Solar LED High Mast Light is a raised source of High illumination lights (6~8 lights) and with high intensity on the middle of major junctions (Ring roads, Outer Ring roads), turned on or lit automatically in the absence of light (at specified timings or at periodic times, every night). |
| Surface Mounted Diode (SMD) LEDs | A surface mount diode is a type that emits light and is flat mounted and soldered onto a circuit board. |
| Chip on Board (COB) LEDs | A COB LED is basically multiple LED chips (usually 9 or more) glued directly onto a substrate by the manufacturer to form a single module. |
| Dual In-Line Package (DIP) LEDs | A dual in-line package (DIP or DIL) is an electronic component package with a rectangular case and two parallel rows of electrical connector pins. |
| Graphene LED Lights | A graphene LED light bulb is simply an LED light bulb where the filament has been coated in graphene. A graphene LED bulb is reported to be 10% more efficient than regular LED light bulbs and they are cheaper to manufacture and buy. |
| LED Corn Bulbs | LED Corn lights are designed as an energy efficient alternative to high intensity discharge (HID) and SON lamps. It uses a large number of LEDs on a metal structure to provide sufficient light. This arrangement of LEDs looks a lot like a corn cob, hence the name "corn light". |
| Per Capita Income | Per capita income or total income measures the average income earned per person in a given area in a specified year. It is calculated by dividing the area's total income by its total population. Per capita income is national income divided by population size. |
| Charging Stations | A charging station, also known as a charging station or electric vehicle utility, is a power supply that provides electrical energy for charging plug-in electric vehicles. |
| Headlight | A headlight is a light that is mounted on the front of a car and illuminates the road in front of it. Low beam and high beam LED headlights are additional categories for these LED headlights. |
| Day Time Running Light (DRLs) | A daytime running lamp is a white, yellow, or amber lighting device mounted on the front of a road-going motor vehicle or bicycle. |
| Directional Signal Light | Directional signal lights are the front and rear lights on an automobile that flash to show the direction of a turn. |
| Stop Light | A red light that is mounted to the back of a car and turns on when the brakes are used to show that the car is stopped. |
| Reverse Light | The reverse light is at the back of the vehicle to indicate its backward motion. |
| Tail Light | A red light that can be seen in the dark is mounted on the rear of a road vehicle. Stop, reverse, and directional signal lights are all part of it. |
| Fog Light | Bright lights in automobiles used to increase visibility on the road in foggy conditions or to warn other drivers of the presence of the vehicle. |
| Passenger Vehicle | A passenger vehicle is a road vehicle, other than a moped or a motorcycle, intended for the transportation of people and designed for up to 8 to 9 seats. |
| Commercial Vehicle | A commercial vehicle (Bus, Truck, Van) is any type of motor vehicle used to transport goods or pay passengers. |
| Two Wheelers (2W) | A two-wheeler is a vehicle that runs on two wheels. |
| Streets & Roadways | Both roads and streets refer to hard, flat surfaces on the ground on which vehicles, people, and animals can travel. Since streetways are usually in cities and towns, they often have houses and buildings on both sides. The roadway is in the countryside and sometimes passes through forests and fields |
| Horticulture Lighting | Horticulture is the science and art of sustainably growing, producing, marketing and using high quality, intensively cultivated food and ornamental plants. |


Research Methodology
Mordor Intelligence has followed the following methodology in all our data center reports.
- Step 1: Raw Data Collection: To understand the market, initially, all crtical data points were identified. Critical information about countries and regions of interest including Per-capita Income, Population, Automotive Production, Interest rate on Auto-Loans, Number of Automobiles on Road, Total LED Import, Lighting Electricity Consumption among others were recorded or estimated based on internal calculations.
- Step 2: Identify Key Variables: To build a robust forecasting model, key variables such as Number of Households, Automotive Production, Road Networks among others were identified. Through an iterative process, the variables required for the market forecast were set, and the model was built using these variables.
- Step 3: Build a Market Model: Based on data and critical industry trend data (variables), including LED pricing, LED penetration rate, and project macro and micor economic factors were utilized for building the market forecasting.
- Step 4: Validate and Finalize: In this crucial step, all market numbers and variables derived through an internal mathematical model were validated through an extensive network of primary research experts from all the markets studied. The respondents are selected across levels and functions to generate a holistic picture of the market studied.
- Step 5: Research Outputs: Syndicated Reports, Custom Consulting Assignments, Databases & Subscription Platforms


