Japan Dairy Alternatives Market Size and Share
Market Overview
| Study Period | 2021 - 2031 |
|---|---|
| Forecast Data Period | 2026 - 2031 |
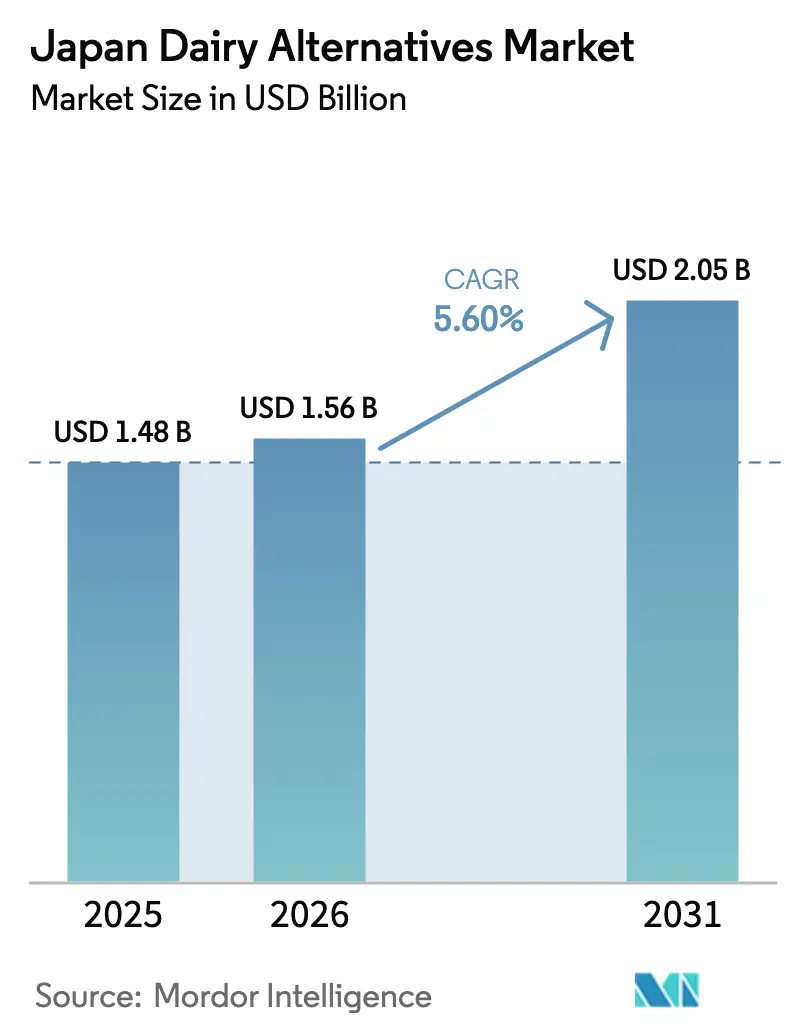
| Base Year Market Size (2025) | USD 1.48 Billion |
| Market Size (2026) | USD 1.56 Billion |
| Market Size (2031) | USD 2.05 Billion |
| Growth Rate (2026 - 2031) | 5.60% CAGR |
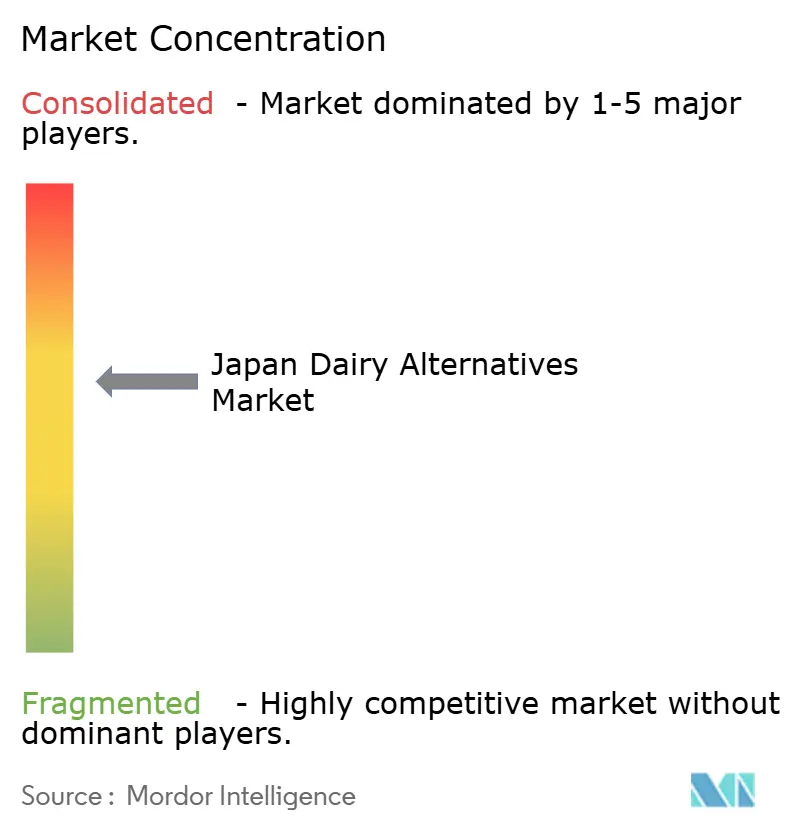
| Market Concentration | Medium |
Major Players
*Disclaimer: Major Players sorted in no particular order Image © Mordor Intelligence. Reuse requires attribution under CC BY 4.0. |
|
Japan Dairy Alternatives Market Analysis by Mordor Intelligence
Japan Dairy Alternatives Market size in 2026 is estimated at USD 1.56 billion, growing from 2025 value of USD 1.48 billion with 2031 projections showing USD 2.05 billion, growing at 5.60% CAGR over 2026-2031. This growth trajectory reflects Japan's evolving dietary landscape, where traditional dairy consumption patterns intersect with rising health consciousness and demographic shifts. The market's expansion is underpinned by Japan's aging population, with 29.1% of citizens over 65 years old, creating heightened demand for digestible alternatives to conventional dairy products [1]Source: Statistics Bureau of Japan, "Current Population Estimates as of October 1, 2024", stat.go.jp. Rising health consciousness, transparent labeling, and demographic aging underpin this steady growth in the Japan non-dairy products market. Manufacturers continue to refine protein functionality through fermentation technology, delivering products that approximate dairy taste while remaining easier to digest for the 85% of adults who show lactose malabsorption. Macroeconomic headwinds—including a 17% jump in average food prices in 2024—have not derailed demand; instead, they have accelerated premiumization, positioning non-dairy alternatives as functional food options rather than simple substitutes. Retailers respond by expanding shelf space, while food-service operators leverage plant-based offerings to refresh post-pandemic menus, further normalizing non-dairy choices among mainstream consumers in the Japan non-dairy products market.
Key Report Takeaways
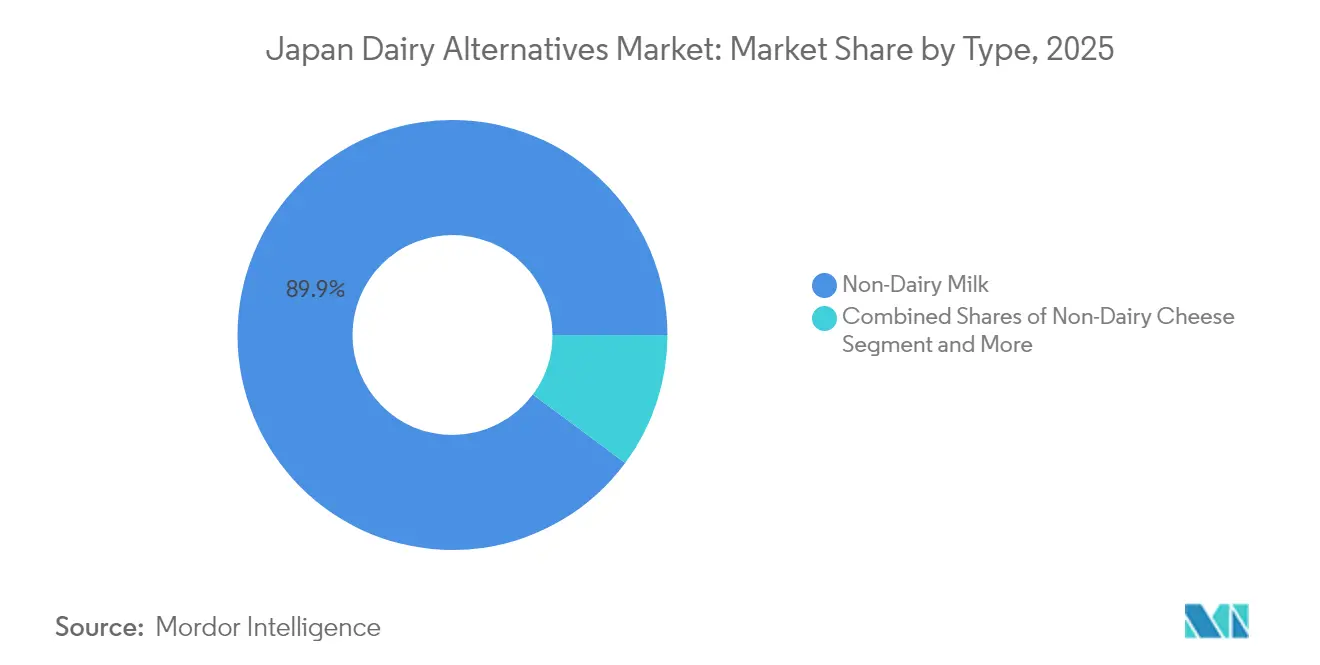
- By product type, non-dairy milk held 89.85% of Japan non-dairy products market share in 2025, non-dairy cheese is forecast to expand at a 6.06% CAGR through 2031.
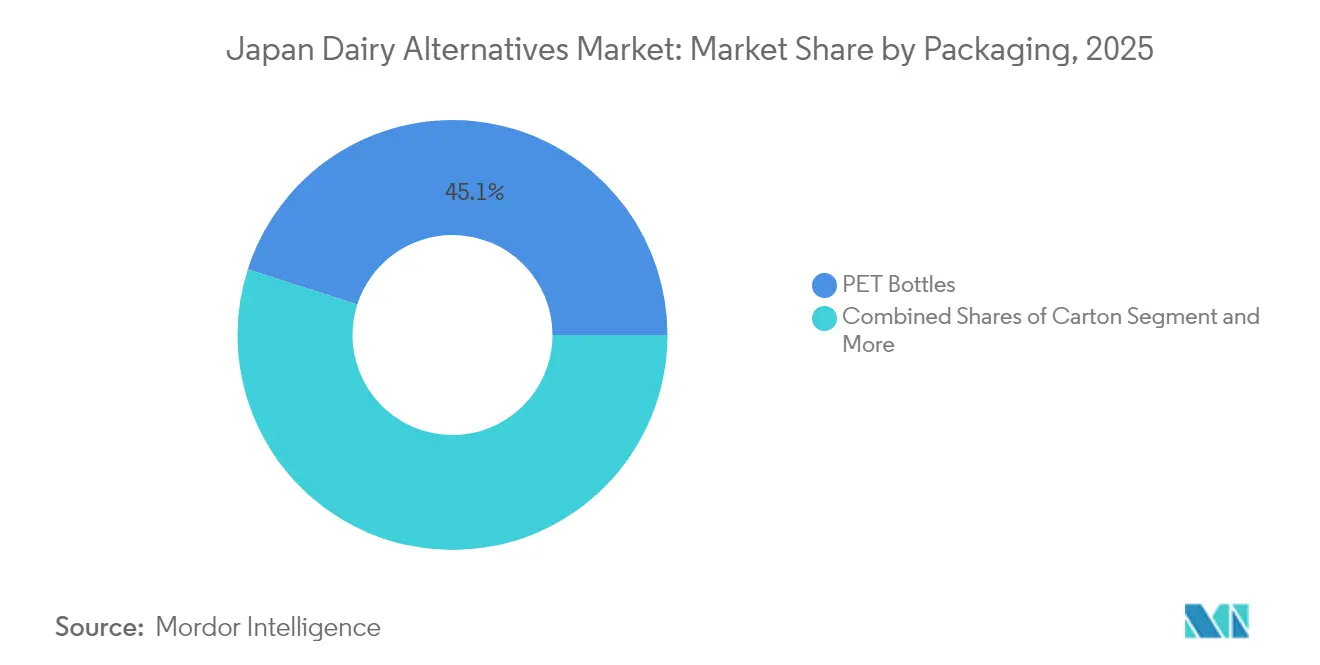
- By packaging, PET bottles accounted for 45.05% of Japan non-dairy products market size in 2025, whereas cartons record the swiftest growth at a 6.22% CAGR.
- By distribution channel, off-trade commanded 98.92% revenue share in 2025, while on-trade is advancing at a 6.97% CAGR through 2031.
Note: Market size and forecast figures in this report are generated using Mordor Intelligence’s proprietary estimation framework, updated with the latest available data and insights as of 2026.
Japan Dairy Alternatives Market Trends and Insights
Drivers Impact Analysis*
| Driver | (~) % Impact on CAGR Forecast | Geographic Relevance | Impact Timeline |
|---|---|---|---|
| Rising awareness of lactose intolerance | +1.2% | National, concentrated in urban centers | Medium term (2-4 years) |
| Convenient, ready-to-drink packaging options | +0.8% | National, with higher penetration in metropolitan areas | Short term (≤ 2 years) |
| Growing vegan and flexitarian population | +0.9% | National, led by Tokyo-Osaka corridor | Long term (≥ 4 years) |
| Influence of global food trends | +0.7% | National, with early adoption in major cities | Medium term (2-4 years) |
| Celebrity endorsements boost product awareness | +0.5% | National, amplified through social media | Short term (≤ 2 years) |
| Wider retail and e-commerce availability | +1.0% | National, addressing rural distribution gaps | Medium term (2-4 years) |
| Source: Mordor Intelligence | |||
Rising Awareness of Lactose Intolerance
Japan's genetic predisposition to lactose intolerance affects approximately 85% of the adult population, yet awareness of this condition has only recently gained mainstream recognition through healthcare initiatives and media coverage. The Ministry of Health, Labour and Welfare's 2024 dietary guidelines explicitly acknowledge lactose sensitivity as a nutritional consideration, marking a significant policy shift from traditional dairy promotion strategies [2]Source: Ministry of Health, Labour and Welfare, "Dietary intake standards for Japan", mhlw.go.jp. This official recognition catalyzes consumer education campaigns by healthcare providers, creating informed demand for lactose-free alternatives. The demographic most responsive to this messaging includes urban professionals aged 25-45, who demonstrate higher health literacy and disposable income to support premium non-dairy purchases. Pharmaceutical companies like Otsuka Holdings have leveraged this trend by positioning their plant-based products as functional foods rather than mere dairy substitutes, emphasizing digestive wellness benefits. The regulatory framework supporting this driver includes JAS (Japanese Agricultural Standards) labeling requirements that mandate clear lactose content disclosure, enabling consumers to make informed dietary choices.
Convenient, Ready-to-Drink Packaging Options
Japan's convenience-oriented culture drives packaging innovation that prioritizes portability, shelf stability, and single-serving formats aligned with on-the-go consumption patterns. The success of ready-to-drink formats reflects deeper societal shifts toward time-compressed lifestyles, particularly among working professionals who increasingly rely on convenience stores for meal solutions. Ezaki Glico's "Almond Effect" line exemplifies this trend, featuring 200ml single-serve packages designed for commuter consumption, supported by celebrity endorsement campaigns featuring actress Hana Matsushima that launched in September 2024. Packaging technology advances include aseptic processing that extends shelf life without refrigeration, addressing Japan's limited cold storage infrastructure in rural convenience stores. The regulatory environment supports this driver through MHLW food safety standards that facilitate ambient-stable formulations, while packaging waste regulations incentivize lightweighting and recyclability improvements. Distribution partnerships between non-dairy producers and convenience store chains like 7-Eleven create ubiquitous availability that normalizes non-dairy consumption as part of daily routines.
Growing Vegan and Flexitarian Population
Japan's plant-based dietary adoption, while modest at 1.4% strict vegans, encompasses a broader 5.4% flexitarian population that regularly incorporates plant-based alternatives into traditional diets. This demographic shift is particularly pronounced among younger consumers aged 20-35, who demonstrate greater environmental consciousness and willingness to experiment with non-traditional foods. The Tokyo Olympic Games legacy continues to influence dietary trends, as sustainability messaging from the 2021 event highlighted plant-based nutrition as environmentally responsible consumption. Corporate wellness programs increasingly promote flexitarian diets as part of employee health initiatives, with companies like Meiji Holdings integrating plant-based options into corporate cafeterias and vending machine selections. Social media influence amplifies this trend, with Japanese food influencers showcasing plant-based recipes that blend traditional Japanese flavors with international non-dairy ingredients. The regulatory landscape supports this driver through MAFF (Ministry of Agriculture, Forestry and Fisheries) initiatives promoting domestic plant protein production, including subsidies for soy and oat cultivation that reduce ingredient costs for local manufacturers.
Influence of Global Food Trends
Japan's culinary landscape increasingly incorporates international food trends, with non-dairy alternatives benefiting from global wellness movements and social media-driven food discovery. The popularity of café culture, particularly specialty coffee shops serving oat milk lattes, creates consumer familiarity with non-dairy textures and flavors in familiar contexts. International food service chains like Starbucks Japan have standardized non-dairy options across their menu, normalizing these alternatives for mainstream consumers who might otherwise resist dietary changes. The K-beauty and wellness trend from South Korea has particularly influenced Japanese consumers' perception of plant-based nutrition as beneficial for skin health and overall wellness. Food technology transfer from European and North American markets accelerates product development, with Japanese companies licensing fermentation and protein extraction technologies to create locally adapted formulations. Celebrity chef endorsements and cooking show features showcase non-dairy ingredients in traditional Japanese recipes, demonstrating culinary versatility that reduces consumer resistance to taste differences.
Restraints Impact Analysis*
| Restraint | (~) % Impact on CAGR Forecast | Geographic Relevance | Impact Timeline |
|---|---|---|---|
| High prices limit mass adoption | -1.5% | National, most pronounced in rural areas | Medium term (2-4 years) |
| Limited awareness in rural areas | -0.8% | Rural prefectures, particularly aging communities | Long term (≥ 4 years) |
| Taste differs from traditional dairy | -1.0% | National, varies by age demographic | Medium term (2-4 years) |
| Consumer skepticism on nutritional value | -0.6% | National, concentrated among older consumers | Long term (≥ 4 years) |
| Source: Mordor Intelligence | |||
High Prices Limit Mass Adoption
Non-dairy products in Japan command premium pricing that significantly constrains market penetration, with typical retail prices 2-3 times higher than conventional dairy equivalents. Teikoku Databank's 2024 food pricing analysis reveals that raw material inflation, specialized processing equipment, and limited production scale create structural cost disadvantages for plant-based alternatives. Import dependency for key ingredients like almonds and oats exposes producers to currency fluctuations and international commodity price volatility, with the yen's weakness in 2024 further pressuring input costs. Rural consumers, who face both lower average incomes and higher transportation costs for specialty products, demonstrate particularly strong price sensitivity that limits adoption rates. The challenge is compounded by Japan's deflationary economic environment, where consumers have been conditioned to expect stable or declining prices for food products. Government subsidy programs for domestic plant protein production remain limited compared to traditional dairy support, creating an uneven competitive landscape that perpetuates pricing disparities.
Limited Awareness in Rural Areas
Japan's rural-urban digital divide creates information asymmetries that constrain non-dairy product awareness outside metropolitan areas, where 46.32 million people live more than 500 meters from fresh food stores according to MAFF studies[3]Source: MAFF (Ministry of Agriculture, Forestry, and Fisheries), "Japan's rural-urban digital", maff.go.jp. Rural consumers face 2.7 times greater distances to specialty food retailers compared to urban residents, limiting exposure to non-dairy product displays and promotional activities. Traditional media consumption patterns in rural areas favor television and print media over social media platforms where non-dairy brands concentrate their marketing efforts. Agricultural communities maintain strong cultural connections to dairy farming, creating resistance to messaging that positions plant-based alternatives as superior to traditional dairy products. The aging rural population, with median ages exceeding 50 in many prefectures, demonstrates lower adoption rates for new food categories and greater reliance on established dietary patterns. Distribution challenges include limited cold storage infrastructure in rural convenience stores and higher logistics costs that discourage retailers from stocking diverse non-dairy options.
*Our forecasts treat driver/restraint impacts as directional, not additive. The impact forecasts reflect baseline growth, mix effects, and variable interactions.
Segment Analysis
By Type: Non-Dairy Milk Dominates Through Innovation
Non-dairy milk maintains commanding market leadership with 89.85% share in 2025, driven by consumer familiarity and versatile application across traditional Japanese beverages and cooking. Soy milk continues as the foundational segment, leveraging Japan's centuries-old tofu manufacturing expertise and established supply chains for domestic soybean processing. Oat milk emerges as the premium growth driver, with companies like Oatly establishing local production partnerships to reduce import dependency and customize formulations for Japanese taste preferences. Almond milk faces headwinds from import cost inflation, while coconut milk benefits from established Southeast Asian trade relationships and tropical flavor acceptance in dessert applications.
The fastest-growing non-dairy cheese segment, expanding at 6.06% CAGR through 2031, reflects sophisticated consumer demand for functional dairy alternatives in traditional Japanese cuisine applications. Fermentation technology advances enable texture improvements that better replicate dairy cheese characteristics, with companies investing in precision fermentation capabilities to produce casein-like proteins. Hemp milk and hazelnut milk remain niche segments, primarily targeting health-conscious consumers willing to pay premium prices for perceived nutritional benefits. Cashew milk demonstrates potential in foodservice applications, particularly in specialty coffee shops where baristas value its frothing properties for latte art creation.


By Packaging Type: Sustainability Drives Carton Growth
PET bottles command 45.05% market share in 2025, reflecting consumer preferences for convenience, portability, and resealable functionality that aligns with Japan's on-the-go consumption culture. However, cartons demonstrate superior growth trajectory at 6.22% CAGR through 2031, driven by environmental sustainability initiatives and corporate packaging targets. Seven & i Holdings' commitment to 50% recycled content by 2030 catalyzes supplier adoption of sustainable packaging solutions, while Suntory's bottle-to-bottle recycling infrastructure creates circular economy advantages for PET applications.
Cans represent the smallest segment but benefit from technological innovations in barrier coatings that prevent metallic taste transfer and extend shelf life for plant-based formulations. Packaging lightweighting initiatives reduce transportation costs and environmental impact, with leading manufacturers achieving 15-20% weight reductions through material optimization. Regulatory compliance factors include Japan's packaging waste regulations that incentivize recyclable materials and producer responsibility programs that internalize end-of-life costs. The shift toward carton packaging reflects broader consumer environmental consciousness, particularly among younger demographics who prioritize sustainability credentials in purchasing decisions.
By Distribution Channel: On-Trade Expansion Accelerates
Off-trade channels maintain overwhelming dominance with 98.92% market share in 2025, reflecting Japan's robust convenience store infrastructure and consumer preference for home consumption. Convenience stores serve as primary discovery points for new non-dairy products, with 7-Eleven's 21,000+ locations providing unparalleled distribution reach across urban and rural markets. Supermarkets and hypermarkets increasingly dedicate shelf space to plant-based alternatives, with chains like Aeon implementing dedicated plant-based sections that improve product visibility and consumer education.
On-trade channels, despite minimal current share, demonstrate exceptional growth potential at 6.97% CAGR through 2031, driven by foodservice recovery and evolving consumer dining preferences. Specialty coffee shops lead on-trade adoption, with independent cafés differentiating through premium non-dairy options that command higher margins than traditional dairy alternatives. Restaurant integration remains limited but shows promise in health-focused establishments and international cuisine concepts that cater to dietary restrictions. E-commerce penetration accelerates through partnerships with major platforms like Amazon Japan and Rakuten, addressing rural distribution gaps and enabling subscription-based repeat purchases that improve customer lifetime value.
Competitive Landscape
The Japan non-dairy products market exhibits moderate concentration with established domestic players leveraging manufacturing expertise and distribution relationships to defend market positions against international entrants. Traditional food manufacturers like Kikkoman and Marusan-AI capitalize on decades of soy processing experience and consumer trust to maintain leadership in core segments, while adapting product portfolios to include innovative plant-based alternatives.
Strategic differentiation increasingly centers on fermentation technology and precision manufacturing capabilities, with companies investing in biotechnology partnerships to enhance protein functionality and taste profiles that better replicate dairy characteristics. Emerging competitive dynamics reflect technology-driven disruption, as precision fermentation enables smaller companies to produce dairy-identical proteins without traditional agricultural constraints.
International brands like Oatly establish local production partnerships to overcome import cost disadvantages and customize formulations for Japanese taste preferences, while domestic innovators like Asahi Group develop proprietary yeast-derived proteins that promise superior nutritional profiles and manufacturing scalability. White-space opportunities exist in specialized segments like aged cheese alternatives and fermented dairy substitutes, where consumer willingness to pay premium prices supports investment in advanced processing technologies. The regulatory environment supports innovation through MHLW approval pathways for novel food ingredients and JAS certification programs that validate product quality and safety claims.
Japan Dairy Alternatives Industry Leaders
-
Kikkoman Corporation
-
SAPPORO HOLDINGS LTD.
-
MARUSAN-AI CO., LTD.
-
Otsuka Holdings Co., Ltd.
-
Yakult Honsha Co., Ltd.
- *Disclaimer: Major Players sorted in no particular order

Recent Industry Developments
- August 2025: Otsuka Foods Co., Ltd. relaunched its Sugoi Daizu line of whole soybean beverages. The revamped packaging now highlights the rich dietary fiber content more clearly. Additionally, a new easy-to-drink “Unprocessed Type 200ml” variant will join the lineup. These relaunched products hit shelves nationwide in Japan starting September 1, 2025.
- May 2025: A new dairy-free milk, crafted from yeast, has been unveiled by Asahi, marking a pioneering move in Japan. As per Asahi's statement, “LIKE MILK” boasts a naturally sweet and mellow flavor profile. It matches traditional milk in protein and calcium content, is abundant in dietary fiber and zinc, and has 38 percent less fat compared to both dairy and soy milks.
- July 2024: Japan's inaugural oat milk, "Delicious Oat Milk Made by Mr. Tsukagoshi," has been unveiled by Misola Foods. This oat milk serves as a dairy alternative, crafted to appeal to both adults and children. Marketed as Japan's pioneering oat milk, this beverage boasts a rich flavor and a gentle sweetness, achieved by enzymatically converting oat starches into sugars.


Japan Dairy Alternatives Market Report Scope
Non-Dairy Butter, Non-Dairy Cheese, Non-Dairy Milk, Non-Dairy Yogurt are covered as segments by Category. Off-Trade, On-Trade are covered as segments by Distribution Channel.| Non-Dairy Milk | Oat Milk |
| Hemp Milk | |
| Hazelnut Milk | |
| Soy Milk | |
| Almond Milk | |
| Coconut Milk | |
| Cashew Milk | |
| Non-Dairy Cheese | |
| Non-Dairy Desserts | |
| Non-Dairy Yogurt | |
| Others |
| PET Bottles |
| Cans |
| Cartons |
| Others |
| On-trade | |
| Off-trade | Convenience Stores |
| Supermarkets and Hypermarkets | |
| Online Retail Stores | |
| Others Distribution Channels |
| By Type | Non-Dairy Milk | Oat Milk |
| Hemp Milk | ||
| Hazelnut Milk | ||
| Soy Milk | ||
| Almond Milk | ||
| Coconut Milk | ||
| Cashew Milk | ||
| Non-Dairy Cheese | ||
| Non-Dairy Desserts | ||
| Non-Dairy Yogurt | ||
| Others | ||
| Packaging Type | PET Bottles | |
| Cans | ||
| Cartons | ||
| Others | ||
| Distribution Channel | On-trade | |
| Off-trade | Convenience Stores | |
| Supermarkets and Hypermarkets | ||
| Online Retail Stores | ||
| Others Distribution Channels | ||


Market Definition
- Dairy Alternatives - Dairy alternatives are foods that are made from plant-based milk/oils instead of their usual animal products, such as cheese, butter, milk, ice cream, yogurt, etc. Plant-based or non-dairy milk alternative is the fast-growing segment in the newer food product development category of functional and specialty beverage across the globe.
- Non-Dairy Butter - Non dairy butter is a vegan butter alternative that is made from a mixture of plant oils. With an increase in alternative diets like vegetarianism, veganism, and gluten intolerance, plant butter is a healthy non-dairy substitute for normal butter.
- Non-Dairy Ice Cream - Plant based ice cream is a growing category. Non-dairy ice cream is a type of dessert made without any animal ingredients. This is typically considered a substitute for regular ice cream for those who cannot or do not eat animal or animal-derived products, including eggs, milk, cream, or honey.
- Plant-Based Milk - Plant based milks are milk substitutes that are made from nuts (e.g., hazelnuts, hemp seeds), seeds (e.g., sesame, walnuts, coconuts, cashews, almonds, rice, oats, etc.) or legumes (e.g., soy). Plant-based milk such as soy milk and almond milk have been popular in East Asia and the Middle East for centuries.
| Keyword | Definition |
|---|---|
| Cultured Butter | Cultured butter is prepared by having the raw butter go through chemical processing and has been added with certain emulsifiers and foreign ingredients. |
| Uncultured Butter | This type of butter is one which has not been processed in any way |
| Natural Cheese | The type of cheese in its most natural form. It is made from natural and simple products and ingredients, including fresh and natural salts, natural colors, enzymes, and high-quality milk. |
| Processed Cheese | Processed cheese undergoes the same processes as natural cheese; however, it requires more steps and many different forms of ingredients. Making processed cheese involves melting natural cheese, emulsifying it, and adding preservatives and other artificial ingredients or colorings. |
| Single Cream | Single cream contains around 18% fat. It’s a single layer of cream that appears over boiled milk. |
| Double Cream | Double cream contains 48% fat, more than double the amount of fat of single cream. It’s heavier and thicker than single cream |
| Whipping Cream | This has a much higher fat percentage than single cream (36%). Used to top cakes, pies, and puddings and as a thickener for sauces, soups, and fillings. |
| Frozen Desserts | Desserts that are meant to be eaten in frozen condition. E.g., sherbets, sorbets, frozen yogurts |
| UHT Milk (Ultra-high temperature milk) | Milk heated at a very high temperature. Ultra-high-temperature processing (UHT) of milk involves heating for 1–8 sec at 135–154°C. which kills the spore-forming pathogenic microorganism, resulting in a product with a shelf-life of several months. |
| Non-dairy butter/Plant-based butter | Butter made from plant-derived oil such as coconut, palm, etc. |
| Non-dairy Yogurt | Yogurt made from typically made from nuts, like almonds, cashews, coconuts, and even other foods like soybeans, plantains, oats, and peas |
| On-trade | It refers to restaurants, QSRs, and bars. |
| Off-trade | It refers to supermarkets, hypermarkets, on-line channels, etc. |
| Neufchatel cheese | One of the oldest kinds of cheese in France. It is a soft, slightly crumbly, mold-ripened, bloomy-rind cheese made in the Neufchâtel-en-Bray region of Normandy. |
| Flexitarian | It refers to a consumer preferring a semi-vegetarian diet, that is centered on plant foods with limited or occasional inclusion of meat. |
| Lactose Intolerance | Lactose intolerance is a reaction in digestive system to lactose, the sugar in milk. It causes uncomfortable symptoms in response to the consumption of dairy products. |
| Cream Cheese | Cream cheese is a soft and creamy fresh cheese with a tangy taste made from milk and cream. |
| Sorbets | Sorbet is a frozen dessert made using ice combined with fruit juice, fruit purée, or other ingredients, such as wine, liqueur, or honey. |
| Sherbet | Sherbet is a sweetened frozen dessert made with fruit and some sort of dairy product such as milk or cream. |
| Shelf stable | Foods that can be safely stored at room temperature, or "on the shelf," for at least one year and do not have to be cooked or refrigerated to eat safely. |
| DSD | Direct Store Delivery is the process in supply chain management wherein the product is delivered from manufacturing plant directly to the retailer. |
| OU Kosher | Orthodox Union Kosher is a kosher certification agency based in New York City. |
| Gelato | Gelato is a frozen creamy dessert made with milk, heavy cream and sugar. |
| Grass-fed Cows | Grass-fed cows are allowed to graze in pastures, where they eat a variety of grasses and clover. |


Research Methodology
Mordor Intelligence follows a four-step methodology in all our reports.
- Step-1: Identify Key Variables: In order to build a robust forecasting methodology, the variables and factors identified in Step 1 are tested against available historical market numbers. Through an iterative process, the variables required for market forecast are set, and the model is built on the basis of these variables.
- Step-2: Build a Market Model: Market-size estimations for the forecast years are in nominal terms. Inflation is not a part of the pricing, and the average selling price (ASP) is kept constant throughout the forecast period for each country.
- Step-3: Validate and Finalize: In this important step, all market numbers, variables, and analyst calls are validated through an extensive network of primary research experts from the market studied. The respondents are selected across levels and functions to generate a holistic picture of the market studied.
- Step-4: Research Outputs: Syndicated Reports, Custom Consulting Assignments, Databases & Subscription Platforms


