
IoT Billing and Monetization Software Market Size and Share
Market Overview
| Study Period | 2020 - 2031 |
|---|---|
| Market Size (2026) | USD 2.76 Billion |
| Market Size (2031) | USD 6.08 Billion |
| Growth Rate (2026 - 2031) | 17.11 % |
| Fastest Growing Market | Africa |
| Largest Market | North America |
| Market Concentration | Medium |
Major Players *Disclaimer: Major Players sorted in no particular order Image © Mordor Intelligence. Reuse requires attribution under CC BY 4.0. | |
IoT Billing and Monetization Software Market Analysis by Mordor Intelligence
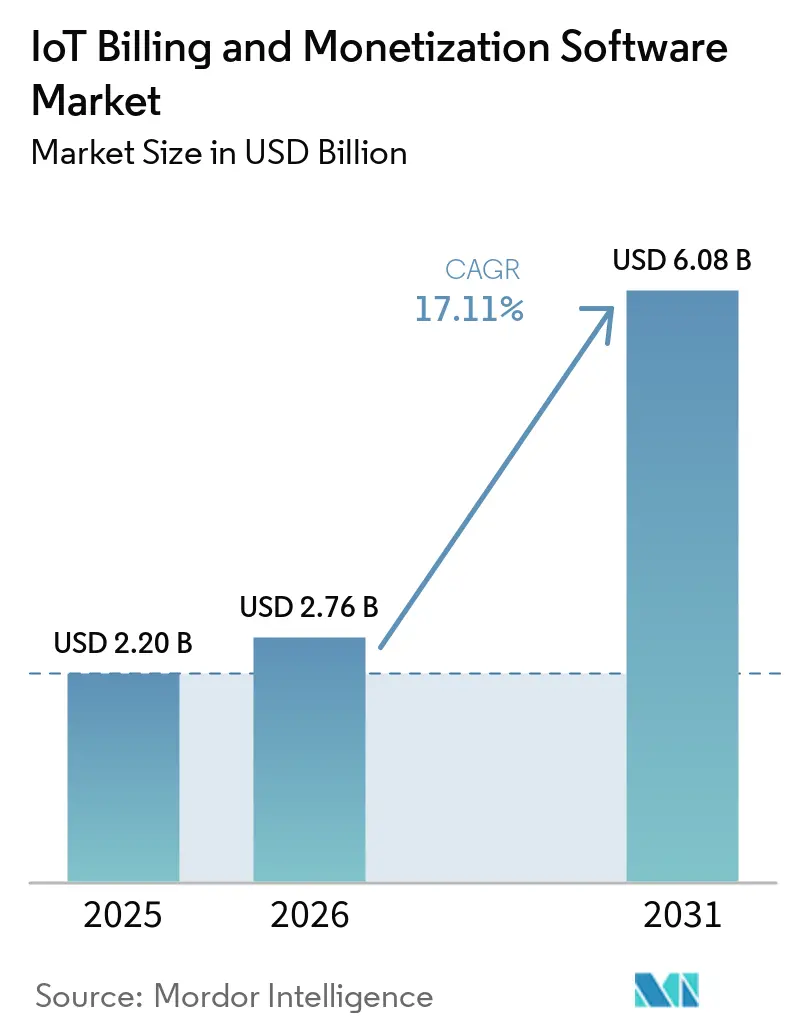
The IoT Billing And Monetization Software Market size is expected to increase from USD 2.20 billion in 2025 to USD 2.76 billion in 2026 and reach USD 6.08 billion by 2031, growing at a CAGR of 17.11% over 2026-2031.
Rising cellular and noncellular device counts are increasing the number and variety of events that must be rated, billed, and settled. Providers are responding with platforms that can support subscriptions, consumption pricing, and outcome-linked service plans in the same operating environment. Cloud-native systems are becoming more relevant because they support faster product configuration and API-led connectivity with enterprise systems. Regulatory obligations for data access, security, and billing accuracy are increasing the value of platforms with audit trails and compliance controls. The IoT billing and monetization software market is also being shaped by vendor consolidation, AI-supported configuration, and eSIM management capabilities for devices that operate across multiple networks.
Key Report Takeaways
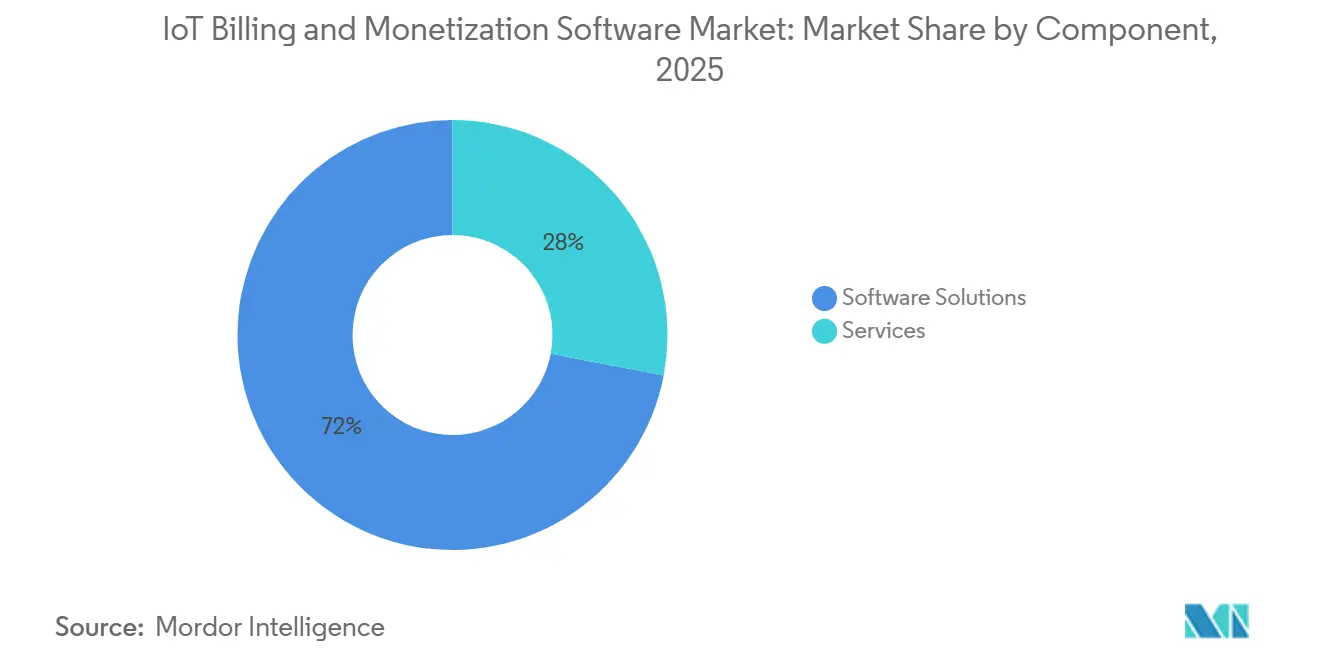
- By component, software solutions held 71.98% of the IoT billing and monetization software market share in 2025, while services supported implementation, integration, and managed operations.
- By deployment mode, cloud-based systems accounted for 67.11% of the IoT billing and monetization software market share in 2025, supported by the need for elastic capacity and faster service launches.
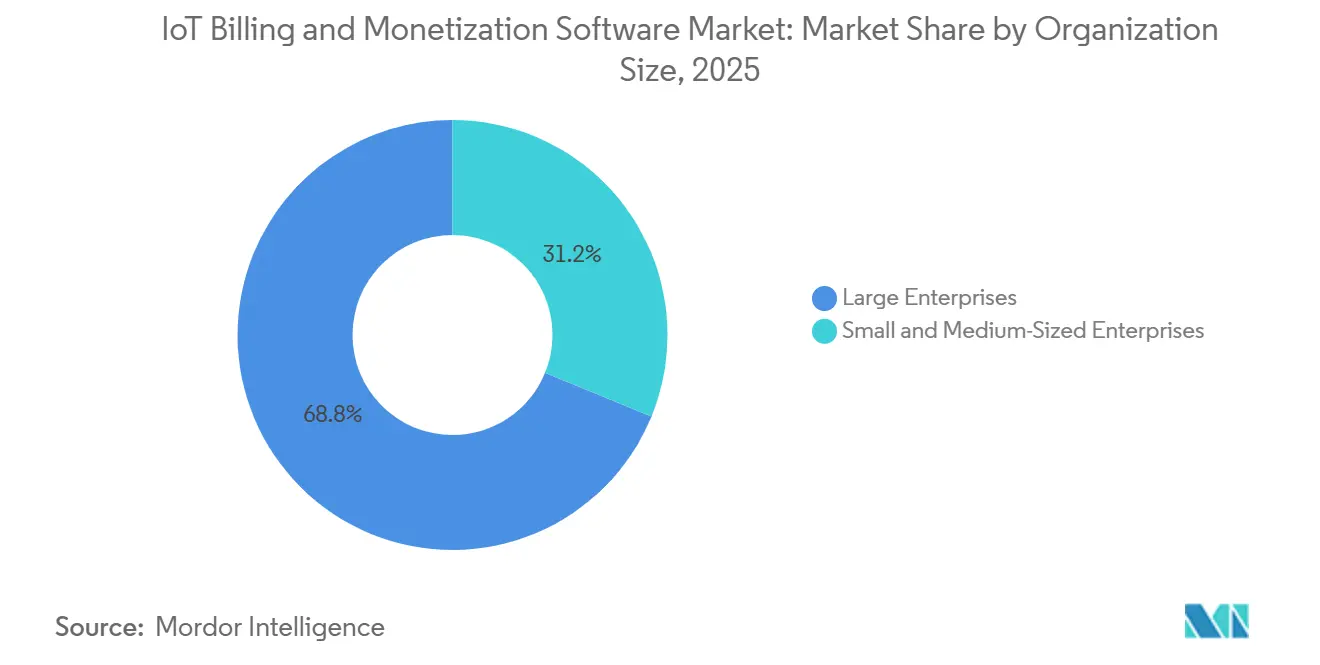
- By organization size, large enterprises held 68.82% share in 2025, while SMEs are projected to expand at an 18.57% CAGR through 2031.
- By application, connected vehicle and fleet services accounted for 20.13% of the IoT billing and monetization software market size in 2025, while connected healthcare and medical devices are projected to advance at an 18.95% CAGR through 2031.
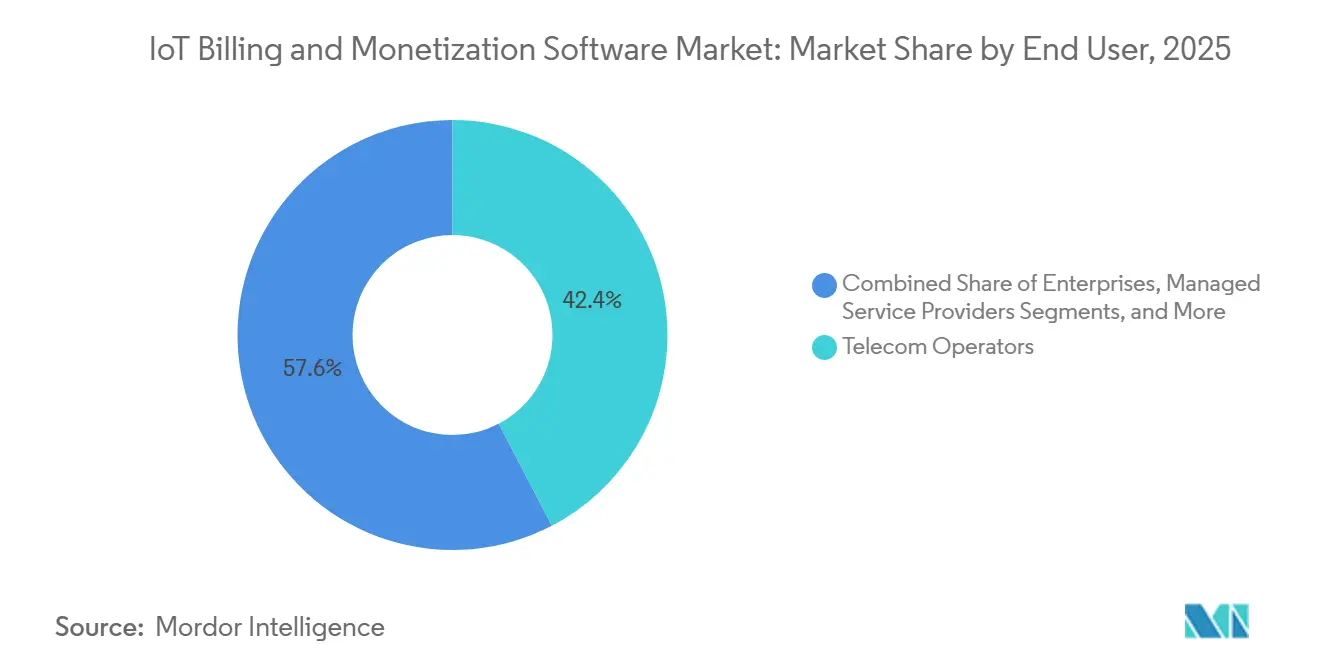
- By end user, telecom operators held 42.36% share in 2025, while enterprises are projected to record the highest CAGR of 18.53% through 2031.
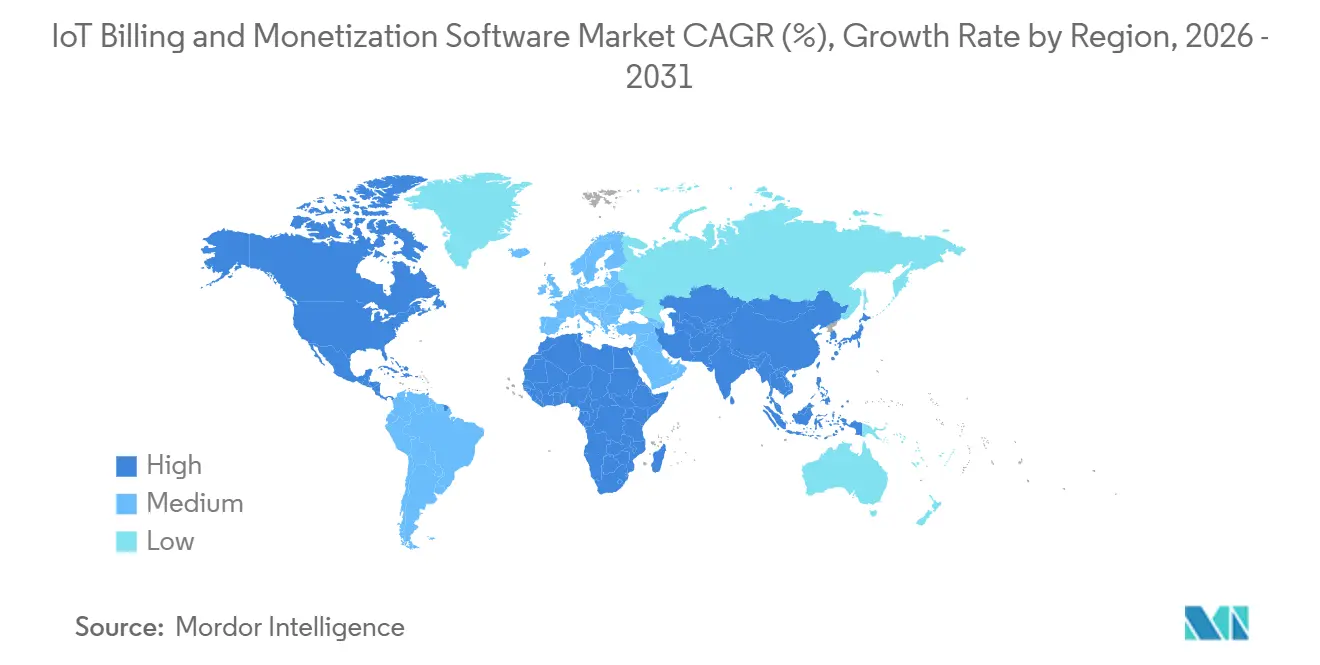
- By geography, North America held 32.22% share in 2025, while Africa is projected to expand at an 18.84% CAGR through 2031.
Note: Market size and forecast figures in this report are generated using Mordor Intelligence’s proprietary estimation framework, updated with the latest available data and insights as of January 2026.
Market Trends and Insights
Drivers Impact Analysis of IoT Billing and Monetization Software Market*
| Driver | (~) % Impact on CAGR Forecast | Geographic Relevance | Impact Timeline |
|---|---|---|---|
| Expansion of Connected Device Fleets and Usage Events | +5.0% | Global, highest intensity in Asia-Pacific and North America | Medium term (2-4 years) |
| Subscription and Usage-Based Business Model Adoption | +3.5% | Global, early movers in North America and Western Europe | Medium term (2-4 years) |
| Cloud-Native Transformation of Telecom and Enterprise BSS | +3.0% | Global, North America, Europe, and Asia-Pacific lead | Long term (≥ 4 years) |
| Real-Time Revenue Assurance and Billing Accuracy Requirements | +2.0% | Global, particular urgency in high-volume telecom markets | Short term (≤ 2 years) |
| Autonomous Device and Machine-to-Machine Commerce | +1.5% | North America and Europe core, spillover to Asia-Pacific | Long term (≥ 4 years) |
| Multi-Party Settlement for Shared IoT Infrastructure | +0.8% | Europe, Asia-Pacific, and Middle East | Medium term (2-4 years) |
| Source: Mordor Intelligence | |||
Expansion of Connected Device Fleets and Usage Events
Cellular IoT connections reached 4.5 billion at the end of 2025, while total IoT connections are projected to reach 47.1 billion by 2031 at a 13% CAGR. This scale increases the volume of events that billing platforms must collect, classify, rate, and reconcile. A utility meter may send periodic low-volume data, while a 5G RedCap video device can create continuous traffic that is subject to changing quality-of-service terms. These different patterns require pricing rules that recognize device type, usage level, network conditions, and the party responsible for payment. Germany was expected to have more than 96 million machine SIM cards by the end of 2026, adding a substantial device base that requires machine-oriented billing processes. The IoT billing and monetization software market therefore benefits when operators replace systems designed for simpler consumer traffic with platforms that handle diverse event structures.
Subscription and Usage-Based Business Model Adoption
Connected-product providers are shifting from one-time device sales toward subscriptions, usage charges, and service bundles. That shift requires a platform that can process metered usage, apply hybrid pricing rules, and support revenue recognition in one workflow. Stripe introduced its Machine Payments Protocol in March 2026 as an open approach for autonomous machine-to-machine payment orchestration.[1]Stripe, “Introducing the Machine Payments Protocol,” Stripe, stripe.com The development indicates that machine-originated payment events are becoming a practical consideration for connected-service providers. Golioth’s move to modular usage-based pricing also reflected the need to attribute granular device activity across mixed fleets. The IoT billing and monetization software market gains relevance as providers need a reliable record of what a device consumed, which contract applied, and which customer or partner should be charged.
Cloud-Native Transformation of Telecom and Enterprise BSS
Cloud-native billing environments support event-led integrations and allow providers to configure new commercial offers without rebuilding a monolithic rate plan. They are particularly relevant for network slicing, B2B2X offers, partner settlement, and connected-device services that rely on frequent pricing changes. TM Forum Open Digital Architecture alignment is becoming an important procurement consideration because it gives operators a more consistent API framework for ingesting and rating events. API-led platforms can connect to product catalogs, customer systems, network functions, and partner applications with fewer custom interfaces. The EU Data Act became applicable in September 2025 and increased the need for connected products to make data available through documented access arrangements. The IoT billing and monetization software market is supported by this transition because cloud-native platforms can make data exchange and service configuration easier than older tightly coupled systems.
Real-Time Revenue Assurance and Billing Accuracy Requirements
IoT billing errors can accumulate quickly because individual events may have low value but occur at high frequency. A missed or incorrectly rated event may be difficult to detect until it appears in a reconciliation or audit process. The CFCA Global Fraud Loss Survey 2025 estimated global telecom fraud losses at USD 41.82 billion, including USD 5.31 billion from subscription fraud, which shows the financial importance of transaction controls.[2]CFCA, “Global Fraud Loss Survey 2025 Report Published,” cfca.org Aria Systems launched the Allegro ACE Adaptive Charging Engine in June 2026 for IoT connectivity, AI-service tokens, and network API charging. The company stated that the platform supports sub-100ms responses and several charging approaches within one compute layer. In healthcare, device telemetry also needs a reliable audit trail when it serves as an input to reimbursement, making accurate billing processes more important in the IoT billing and monetization software market.
Restraints Impact Analysis of IoT Billing and Monetization Software Market*
| Restraint | (~) % Impact on CAGR Forecast | Geographic Relevance | Impact Timeline |
|---|---|---|---|
| Legacy OSS/BSS Integration Complexity | -2.5% | Global, most acute in North America, Europe, and East Asia | Long term (≥ 4 years) |
| Data Privacy, Cybersecurity, and Data Sovereignty Requirements | -1.5% | EU and UK primary, expanding to Asia-Pacific markets | Medium term (2-4 years) |
| Fragmented Device Protocols and Inconsistent Usage Telemetry | -1.0% | Global, highest impact in industrial IoT and smart utilities | Medium term (2-4 years) |
| Difficulty Proving Economic Value for Low-ARPU Deployments | -0.7% | Asia-Pacific emerging markets, South America, Africa | Long term (≥ 4 years) |
| Source: Mordor Intelligence | |||
Legacy OSS/BSS Integration Complexity
Older business support systems often combine product catalogs, rating rules, provisioning processes, and customer records in tightly connected components. Separating these functions without disrupting active billing requires parallel operations, data synchronization, and extensive testing for each product line. New IoT services can also require additional links between network operations systems and billing systems. This creates an implementation burden when operators need to connect several device platforms, partner applications, and network technologies. Undocumented business rules may emerge after a modernization project starts and delay the intended service launch. These issues can slow adoption in the IoT billing and monetization software market, especially where a provider has a large installed base and limited tolerance for billing disruption.
Data Privacy, Cybersecurity, and Data Sovereignty Requirements
Billing platforms can process device identifiers, location data, usage information, and payment-related records. This concentration of data makes the platforms important targets for regulatory review and cybersecurity controls. The EU Data Act became applicable on September 12, 2025, and new connected products must make user data accessible by default from September 12, 2026. The EU Cyber Resilience Act also introduces vulnerability-reporting obligations from September 11, 2026, with full enforcement scheduled for December 2027. Cerillion’s April 2026 Omantel deployment used hosting in Oman Data Park to meet local data sovereignty requirements. The resulting need for country-specific controls and infrastructure can raise delivery costs for the IoT billing and monetization software market.
*Our forecasts treat driver/restraint impacts as directional, not additive. The impact forecasts reflect baseline growth, mix effects, and variable interactions.
IoT Billing and Monetization Software Market Segment Analysis
By Component:
Software Platforms Anchor Billing Value ChainsSoftware solutions held 71.98% of the IoT billing and monetization software market share in 2025. The result reflected the central role of rating, charging, invoicing, mediation, and settlement software in a connected-service offering. Once a rating engine is integrated into an operator’s production environment, changing it can affect active customers, product catalogs, and partner arrangements. This creates high switching costs and supports multiyear license, support, and maintenance relationships. The category is moving toward AI-supported configuration and composable software rather than complete platform replacement. Amdocs introduced CES26 in March 2026 with specialized monetization agents and configuration-driven convergent charging for large-scale service delivery. Aria Systems introduced Aria Allegro as a standalone product in May 2026, reflecting demand for billing components that can be adopted without replacing an entire stack.[3]Aria Systems, “Aria Launches Allegro as a Standalone Product,” Aria Systems, ariasystems.com TM Forum Open Digital Architecture alignment also matters because buyers increasingly seek open interfaces that reduce future integration dependence.
Services include integration, consulting, migration, configuration, and managed billing operations. These activities remain important when operators move from older BSS systems to cloud-based environments. Service providers help organizations map legacy rating logic, reconcile data, test billing outcomes, and support the transition of live customers. The demand for services can be strongest when an operator adds new IoT use cases alongside existing consumer and enterprise products. At the same time, AI-supported rule configuration may reduce the long-term need for labor-intensive professional-service work. Vendors must therefore balance near-term implementation revenue with the value of simpler and more repeatable software deployment. The IoT billing and monetization software industry depends on both categories, but software retains the larger value position because it stays embedded in the recurring billing process. A stable software base can also support services revenue when customers introduce new products, partners, or device groups.


By Deployment Mode:
Cloud Dominance Supports Scale and Faster Service LaunchesCloud-based deployment accounted for 67.11% of the IoT billing and monetization software market share in 2025. Operators use cloud capacity to accommodate changes in device counts and transaction volumes without building equivalent infrastructure for every demand peak. Cloud-native billing systems can introduce new usage plans through configurable services and containerized workloads. This supports connected offers that change by data usage, device status, service tier, or network quality. It also helps providers connect billing functions with customer applications through APIs. AIS in Thailand deployed a Netcracker cloud-native BSS platform for B2C, B2B, and IoT services, illustrating the use of a common platform across several business lines. The deployment supported greater scalability and shorter time to launch new connected offerings. These capabilities strengthen the role of cloud delivery in the IoT billing and monetization software market.
On-premises installations remain relevant when privacy rules, security policies, or data residency requirements limit cloud hosting. Some operators also retain local systems because existing billing processes are deeply connected to internal applications. The EU Data Act’s data-access requirements can increase the pressure to modernize interfaces, even where a customer retains an on-premises environment. Legacy systems may need custom connectors to support documented data-access processes, while cloud-native systems often include API functions as a standard element. Cerillion’s 2025 expansion with MVNX added modules for prepaid and postpaid subscribers and enabled multi-tenant billing for MVNO customers. The case shows how SaaS-oriented delivery can reduce the capital and implementation burden for service providers. Deployment choices will remain shaped by a customer’s operating model, compliance obligations, and ability to modernize older systems.
By Organization Size:
Large Enterprises Lead While SMEs Increase AdoptionLarge enterprises accounted for 68.82% of the IoT billing and monetization software market size in 2025. Tier-1 telecom operators, global utilities, automotive manufacturers, and large healthcare systems operate device fleets that can justify comprehensive charging, settlement, and revenue-management platforms. These organizations often require convergent billing across consumer, enterprise, wholesale, and partner services. They may also need real-time online charging and controls that work across many countries and contract types. Their procurement processes favor suppliers with long implementation experience, integration resources, and broad product portfolios. NEC completed its acquisition of CSG Systems in May 2026, and Netcracker led the integration of CSG customer engagement, monetization, and payment technologies into a unified AI-native BSS/OSS platform. The transaction increased competition for large renewals and transformation programs. Large customers can use vendor scale to seek wider functionality, but they also continue to evaluate specialized providers where product flexibility is more important.
SMEs are projected to expand at an 18.57% CAGR through 2031. Cloud SaaS delivery can lower the capital and integration barriers that previously limited access to sophisticated billing functions. Smaller fleet operators still need dependable invoicing, payment handling, tax treatment, and customer records, but may not need a full telecom BSS suite. Fynn offers device-based billing with GoBD compliance, SEPA integration, and DATEV export for German IoT platforms. These functions address a practical need for compliant billing without the cost of a large enterprise program. Digital-native providers can also need precise usage measurement when they sell access to connected-product data through APIs. Lightweight, API-led platforms can serve this need more efficiently than systems designed for major operators. The IoT billing and monetization software market can therefore widen as smaller providers adopt packaged, cloud-based charging and billing services.
By Application:
Connected Vehicles Lead and Healthcare Expands QuicklyConnected vehicle and fleet services held 20.13% of the IoT billing and monetization software market share in 2025. Automotive manufacturers are adding recurring digital services to vehicle ownership, including telematics, connectivity, infotainment, safety functions, and fleet-management tools. A single vehicle can create billable activity for the manufacturer, network operator, driver, fleet owner, and a third-party content provider. This structure makes it important to identify the event, the applicable service entitlement, and the party that should bear the cost. Providers also need to maintain service continuity when vehicles move across networks or national borders. Soracom launched its Automotive Suite in July 2026 with usage-split billing through multiple APNs for OEM telematics, operator services, and end-user infotainment costs. The product addressed multi-party attribution in connected-vehicle commercial models. The IoT billing and monetization software market benefits from these use cases because vehicle services require consistent charging over long device lifecycles.
Connected healthcare and medical devices are projected to record an 18.95% CAGR through 2031. Remote monitoring programs create billing events that need to be linked to verifiable device telemetry and documented service activity. CMS finalized CPT codes 99445 and 99470 in January 2026, increasing the relevance of short-duration and event-triggered billing cycles in connected healthcare. The 2026 Physician Fee Schedule treats software-generated clinical data as a verifiable billing input when the relevant requirements are met. This links billing design with audit records and the reliability of telemetry collection. Device makers and healthcare providers need systems that preserve evidence of device activity, service eligibility, and reimbursement-related records. The resulting requirements can create a higher barrier for general subscription platforms that lack healthcare-focused controls. In the IoT billing and monetization software industry, suppliers with relevant audit capabilities can serve a use case where the billing process is closely connected to regulatory requirements.
By End User:
Telecom Operators Anchor Demand and Enterprises Add MomentumTelecom operators held 42.36% of the IoT billing and monetization software market size in 2025. Operators both run connectivity networks and buy the software needed to charge for IoT data, network services, and partner offerings. Their systems need to process events from large numbers of SIMs and eSIMs while supporting prepaid, postpaid, wholesale, and enterprise contracts. This makes telecom operators important buyers of convergent charging, mediation, and settlement software. MATRIXX Software extended its StarHub monetization partnership for 5 years in July 2025, expanding from the giga! digital sub-brand to main consumer and enterprise offers. The extension showed how a charging platform can move from a focused service to wider billing responsibilities. Industry consolidation may also lead operators to revisit existing contracts when new supplier combinations offer broader product coverage. These conditions maintain telecom operators as a central customer group for the IoT billing and monetization software market.
Enterprises are projected to expand at an 18.53% CAGR through 2031. Manufacturers are using connected-device data to support predictive-maintenance subscriptions, while healthcare systems are billing for remote monitoring programs. Automotive original equipment manufacturers are also creating connected-car service packages that can operate independently from a telecom operator’s billing stack. These organizations need to manage plans, usage, invoices, and partner payments in a way that matches their own commercial model. Managed service providers can support SME and mid-market customers that do not want to operate a billing platform internally. Government and public-sector organizations introduce additional requirements for multi-party settlement and public accounting, especially in smart-city metering and utility programs. Their needs differ from traditional consumer telecom billing because several agencies, suppliers, and end users may share responsibility for a service. This diversity expands the addressable demand for the IoT billing and monetization software market.

Geography Analysis
North America IoT Billing and Monetization Software Market
North America held 32.22% of the IoT billing and monetization software market share in 2025. The region’s position was supported by Tier-1 telecom modernization and enterprise adoption of connected-service platforms. Amdocs and AWS announced a multiyear strategic collaboration in February 2026 that focused on cloud-based platforms for AI services, network APIs, and IoT connectivity. This reflects the demand for platforms that can price several digital services through a common operating environment. The CMS code changes also add a healthcare-related demand stream for systems that connect telemetry records with reimbursement workflows. Canada contributes through enterprise programs in manufacturing and utilities. Mexico contributes through connected-vehicle telematics and smart-utility programs.
Europe IoT Billing and Monetization Software Market
Europe combines a substantial enterprise deployment pipeline with a demanding regulatory environment. The EU Data Act, changing data-collection expectations, and forthcoming Cyber Resilience Act obligations require vendors to treat access, security, and reporting controls as product capabilities. Germany was expected to have more than 96 million machine SIM cards by the end of 2026, increasing the number of connections that require machine-oriented charging and settlement. Deutsche Telekom’s planned June 2028 2G shutdown also creates a deadline for re-rating migrations among operators supporting older IoT devices. The UK Information Commissioner’s Office updated its guidance for consumer IoT products and services on June 11, 2026. Hansen Technologies renewed its Telefónica Germany partnership in May 2026 to support the migration of several million customers to cloud, AI, and API-powered BSS solutions. These conditions make Europe an important market for compliant and adaptable billing platforms.
MEA, APAC and South America IoT Billing and Monetization Software Market
Africa is projected to expand at an 18.84% CAGR through 2031, the fastest regional rate in the IoT billing and monetization software market. Asia-Pacific has the largest connection base, with North East Asia accounting for 70% of cellular IoT connections at the end of 2025. Japan, South Korea, China, and India operate large device fleets that require high-throughput billing capacity. In the Middle East, Cerillion’s Omantel transformation showed how local hosting requirements can shape platform architecture. Mobile technologies generated USD 240 billion in economic value across Africa in 2025 and are projected to reach USD 290 billion by 2030. GSMA reported that 61 operators in 37 African markets had launched 5G services by May 2026.[4]GSMA, “5G in Africa 2026, Market Status, Trends and Outlook,” GSMA, gsma.com South America is progressing through smart-utility metering and enterprise fleet-management programs in Brazil and Argentina.

Competitive Landscape
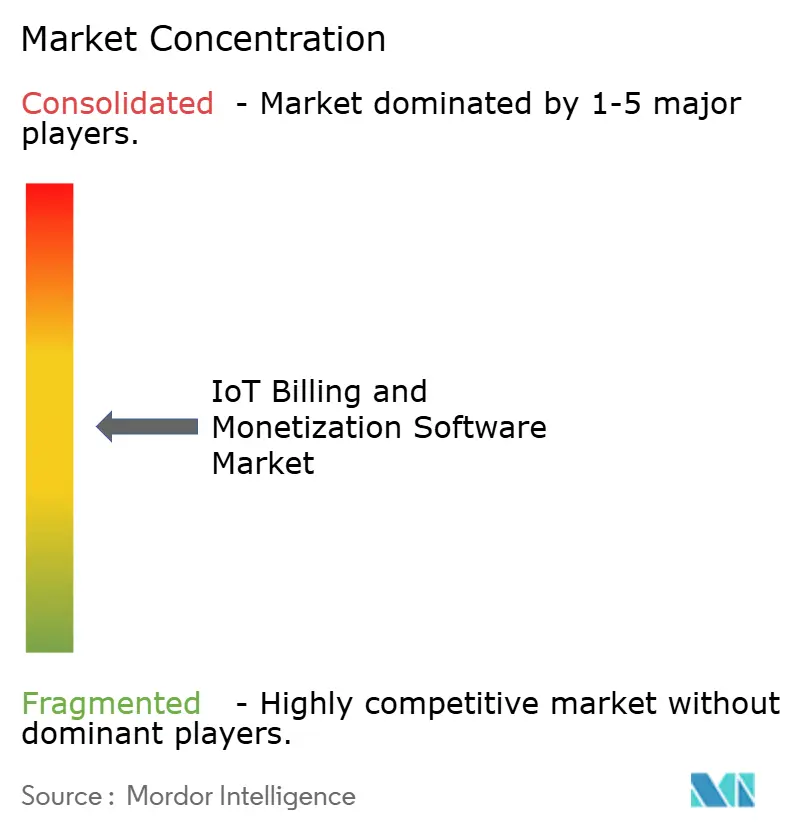
The IoT billing and monetization software market is moderately concentrated. Full-suite BSS/OSS vendors, including Amdocs, Ericsson, Oracle, SAP, Huawei, and Nokia, compete for Tier-1 telecom budgets with broad portfolios and established integration capabilities. Specialist providers, including MATRIXX Software, Cerillion, Aria Systems, Zuora, Aeris Communications, and Eseye, compete through cloud-native delivery, focused monetization functions, and vertical expertise. The competitive focus is moving toward AI-supported configuration, low-latency charging, and eSIM lifecycle management. Cerillion participated in 2 TM Forum Moonshot Catalyst projects at DTW Ignite 2026, using standards participation to demonstrate product alignment in operator evaluations. The industrial IoT mid-market remains a practical opportunity because many manufacturers need more than general subscription billing but do not want a long BSS transformation program. Vendors that offer precise usage rating and integration simplicity can address this gap.
Amdocs introduced CES26 in March 2026, embedding AI agents across monetization, ordering, and assurance workflows. The product move supported configuration-driven convergent charging for large-scale 5G and IoT services. Aria Systems launched Allegro ACE in June 2026 for real-time charging of IoT connectivity, AI services, and network APIs. Its focus on pre-event authorization and event charging addresses customers that need immediate controls at device-fleet scale. Cerillion announced a BSS/OSS transformation program for Omantel in April 2026, covering B2C, B2B, and IoT services. These examples show that market leaders are combining feature development with deployments that validate their platforms in complex operating settings.
Aeris Communications and Eseye are pursuing eSIM orchestration-led billing for multinational device deployments. Their approach is relevant where customers need unified connectivity management, carrier flexibility, and billing across several geographies. Eseye’s SGP.32 capabilities combine eSIM orchestration with multi-currency billing for automotive, utility, and healthcare deployments. Hansen Technologies is pursuing operator-specific depth through its Telefónica Germany partnership, which provides a large migration reference in European tenders.[5]Hansen Technologies, “Telefónica Germany Extends Hansen Partnership,” Hansen Technologies, hansencx.com The IoT billing and monetization software industry remains competitive because customers often evaluate both suite breadth and the ability to solve a defined operational problem. Larger providers can offer integrated portfolios, while specialized vendors can offer more focused implementations.
IoT Billing and Monetization Software Industry Leaders
Amdocs Limited
Oracle Corporation
SAP SE
Telefonaktiebolaget LM Ericsson
Huawei Technologies Co., Ltd.
- *Disclaimer: Major Players sorted in no particular order
IoT Billing and Monetization Software Market Companies Covered in this Report
- Amdocs Limited
- Oracle Corporation
- SAP SE
- Telefonaktiebolaget LM Ericsson (publ)
- Huawei Technologies Co., Ltd.
- CSG Systems International, Inc.
- Nokia Corporation
- Comarch S.A.
- MATRIXX Software, Inc.
- Cerillion plc
- Aria Systems, Inc.
- Zuora, Inc.
- LogiSense Corporation
- PortaOne, Inc.
- Optiva, Inc.
- Netcracker Technology Corporation
- Hansen Technologies Limited
- Eseye Limited
- Aeris Communications, Inc.

Recent Industry Developments in IoT Billing and Monetization Software Market
- July 2026: Soracom launched its Automotive Suite, introducing Split Billing capabilities that allow connectivity costs for OEM telematics, operator services, and end-user infotainment to be separately attributed across a single multi-carrier IoT eSIM.
- June 2026: Aria Systems launched Aria Allegro ACE, a real-time Adaptive Charging Engine designed to support usage authorization, charging, and monetization across telecom, IoT, AI, cloud, and other consumption-based services.
- May 2026: Hansen Technologies extended its partnership with Telefónica Germany, expanding the operator's use of Hansen's cloud-, AI-, and API-powered BSS capabilities to support digital service and monetization requirements.
- April 2026: Cerillion announced a major BSS/OSS transformation programme with Omantel, deploying its pre-integrated BSS/OSS Suite across consumer, enterprise, and IoT services through a sovereign cloud environment hosted at Oman Data Park.


Global IoT Billing and Monetization Software Market Report Scope
The IoT Billing and Monetization Software Market Report is Segmented by Component (Software Solutions, and Services), Deployment Mode (Cloud-Based, and On-Premises), Organization Size (Large Enterprises, and Small and Medium-Sized Enterprises), Application (Connected Vehicle and Fleet Services, Industrial IoT and Predictive Maintenance, Smart Utilities and Meter-to-Cash, Smart Cities and Smart Buildings, Connected Healthcare and Medical Devices, Retail, Payments and Connected Commerce, and Other Applications), End User (Telecom Operators, Enterprises, Managed Service Providers, Government, and Public-Sector Organizations) and Geography (North America, South America, Europe, Asia-Pacific, Middle East, and Africa). The Market Forecasts are Provided in Terms of Value (USD).
| Software Solutions |
| Services |
| Cloud-Based |
| On-Premises |
| Large Enterprises |
| Small and Medium-Sized Enterprises |
| Connected Vehicle and Fleet Services |
| Industrial IoT and Predictive Maintenance |
| Smart Utilities and Meter-to-Cash |
| Smart Cities and Smart Buildings |
| Connected Healthcare and Medical Devices |
| Retail, Payments, and Connected Commerce |
| Other Applications |
| Telecom Operators |
| Enterprises |
| Managed Service Providers |
| Government and Public-Sector Organizations |
| North America | United States |
| Canada | |
| Mexico | |
| South America | Brazil |
| Argentina | |
| Rest of South America | |
| Europe | Germany |
| United Kingdom | |
| France | |
| Italy | |
| Rest of Europe | |
| Asia-Pacific | China |
| Japan | |
| India | |
| South Korea | |
| Australia | |
| Rest of Asia-Pacific | |
| Middle East | United Arab Emirates |
| Saudi Arabia | |
| Rest of Middle East | |
| Africa | South Africa |
| Nigeria | |
| Rest of Africa |
| By Component | Software Solutions | |
| Services | ||
| By Deployment Mode | Cloud-Based | |
| On-Premises | ||
| By Organization Size | Large Enterprises | |
| Small and Medium-Sized Enterprises | ||
| By Application | Connected Vehicle and Fleet Services | |
| Industrial IoT and Predictive Maintenance | ||
| Smart Utilities and Meter-to-Cash | ||
| Smart Cities and Smart Buildings | ||
| Connected Healthcare and Medical Devices | ||
| Retail, Payments, and Connected Commerce | ||
| Other Applications | ||
| By End User | Telecom Operators | |
| Enterprises | ||
| Managed Service Providers | ||
| Government and Public-Sector Organizations | ||
| By Geography | North America | United States |
| Canada | ||
| Mexico | ||
| South America | Brazil | |
| Argentina | ||
| Rest of South America | ||
| Europe | Germany | |
| United Kingdom | ||
| France | ||
| Italy | ||
| Rest of Europe | ||
| Asia-Pacific | China | |
| Japan | ||
| India | ||
| South Korea | ||
| Australia | ||
| Rest of Asia-Pacific | ||
| Middle East | United Arab Emirates | |
| Saudi Arabia | ||
| Rest of Middle East | ||
| Africa | South Africa | |
| Nigeria | ||
| Rest of Africa | ||


Key Questions Answered in the Report
What is the IoT billing and monetization software market size?
The IoT billing and monetization software market size is estimated at USD 2.76 billion in 2026 and is projected to reach USD 6.08 billion by 2031 at a 17.11% CAGR.
What is driving demand for IoT billing and monetization software?
More connected devices, consumption pricing, cloud BSS modernization, and the need for real-time billing accuracy are supporting demand.
Which component has the largest share?
Software solutions led with 71.98% share in 2025 because rating and charging systems are embedded in recurring billing operations.
Which deployment model leads adoption?
Cloud-based deployment accounted for 67.11% share in 2025, supported by scalability and faster configuration of connected-service offers.
Which application is expanding fastest?
Connected healthcare and medical devices are projected to advance at an 18.95% CAGR through 2031, supported by telemetry-linked billing requirements.
Which region is expanding fastest?
Africa is projected to record the fastest regional CAGR of 18.84% through 2031, supported by enterprise IoT deployment and expanding 5G availability.
Page last updated on:





