Ion Exchange Resin Market Size and Share
Market Overview
| Study Period | 2021 - 2031 |
|---|---|
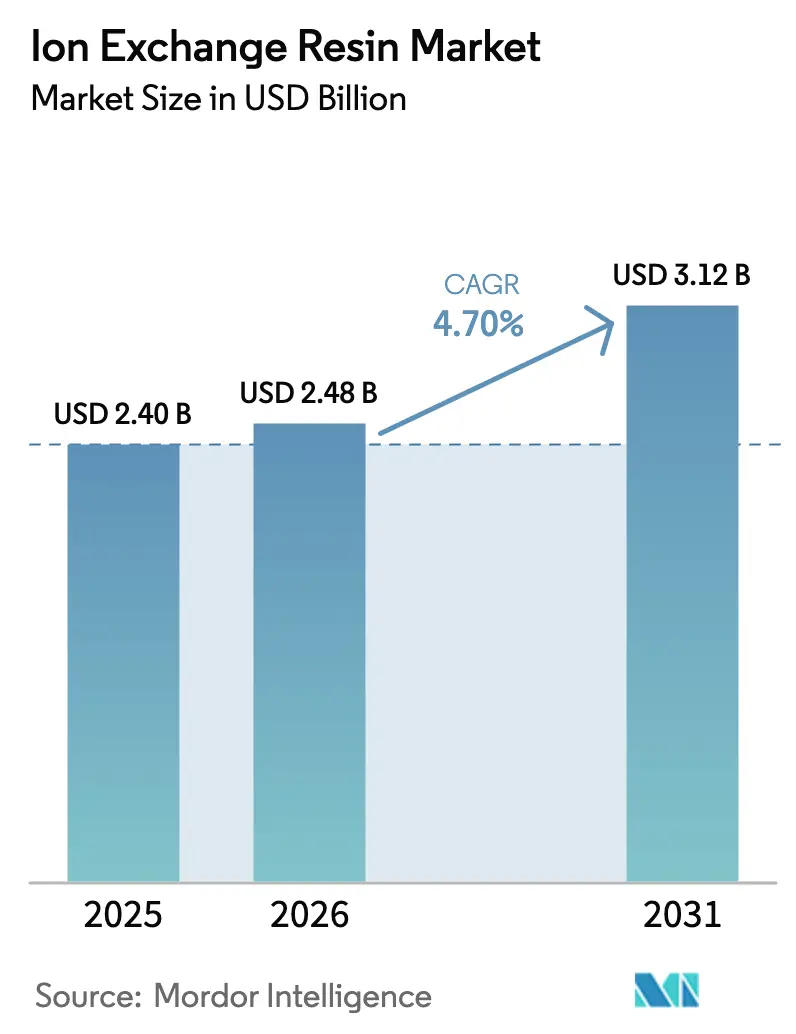
| Market Size (2026) | USD 2.48 Billion |
| Market Size (2031) | USD 3.12 Billion |
| Growth Rate (2026 - 2031) | 4.70% CAGR |
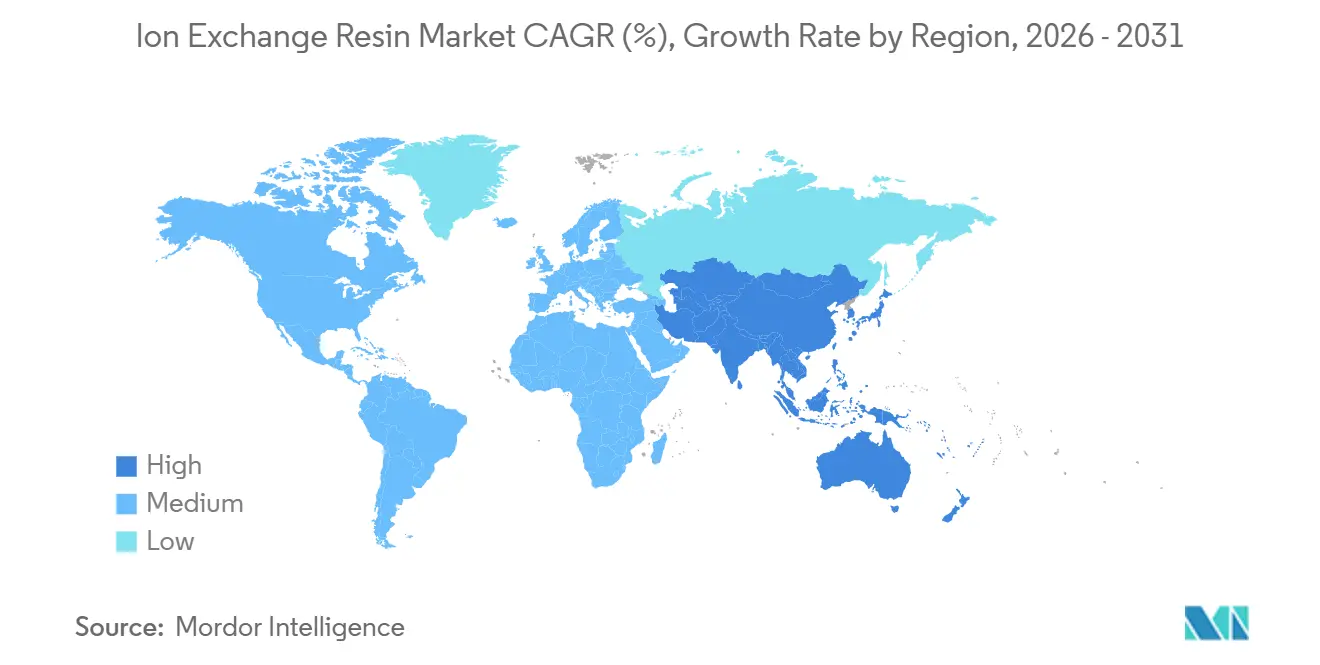
| Fastest Growing Market | Asia Pacific |
| Largest Market | Asia Pacific |
| Market Concentration | Medium |
Major Players *Disclaimer: Major Players sorted in no particular order Image © Mordor Intelligence. Reuse requires attribution under CC BY 4.0. | |
Ion Exchange Resin Market Analysis by Mordor Intelligence
The Ion Exchange Resin Market size was valued at USD 2.40 billion in 2025 and is estimated to grow from USD 2.48 billion in 2026 to reach USD 3.12 billion by 2031, at a CAGR of 4.70% during the forecast period (2026-2031). Regulatory tightening around PFAS, semiconductor-grade ultrapure-water demand, and direct-lithium-extraction projects are reallocating capital from commodity softening beads toward highly engineered chemistries. Specialty grades command premium pricing that offsets raw-material inflation, while mixed-bed systems for zero-liquid-discharge desalination and PEM electrolyzers are unlocking incremental value pools. Competitive intensity remains moderate: five multinational suppliers still control roughly 40% of installed capacity, yet Asian challengers are eroding price leadership in commodity segments through lower capital costs and faster scale-up.
Key Report Takeaways
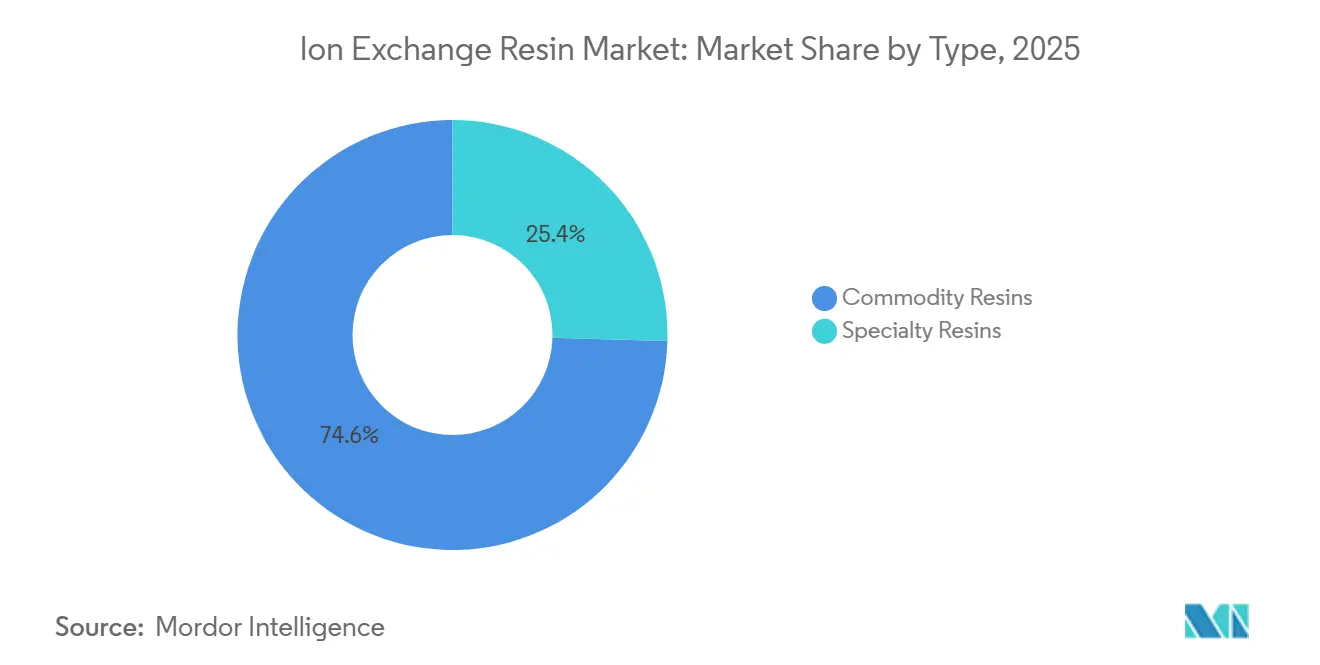
- By type, commodity resins held a 74.35% ion exchange resin market share in 2025, whereas specialty grades are advancing at a 5.23% CAGR through 2031.
- By application function, softening and demineralization captured 58.42% of 2025 revenue, while ultrapure water removal is expanding at a 6.09% CAGR through 2031.
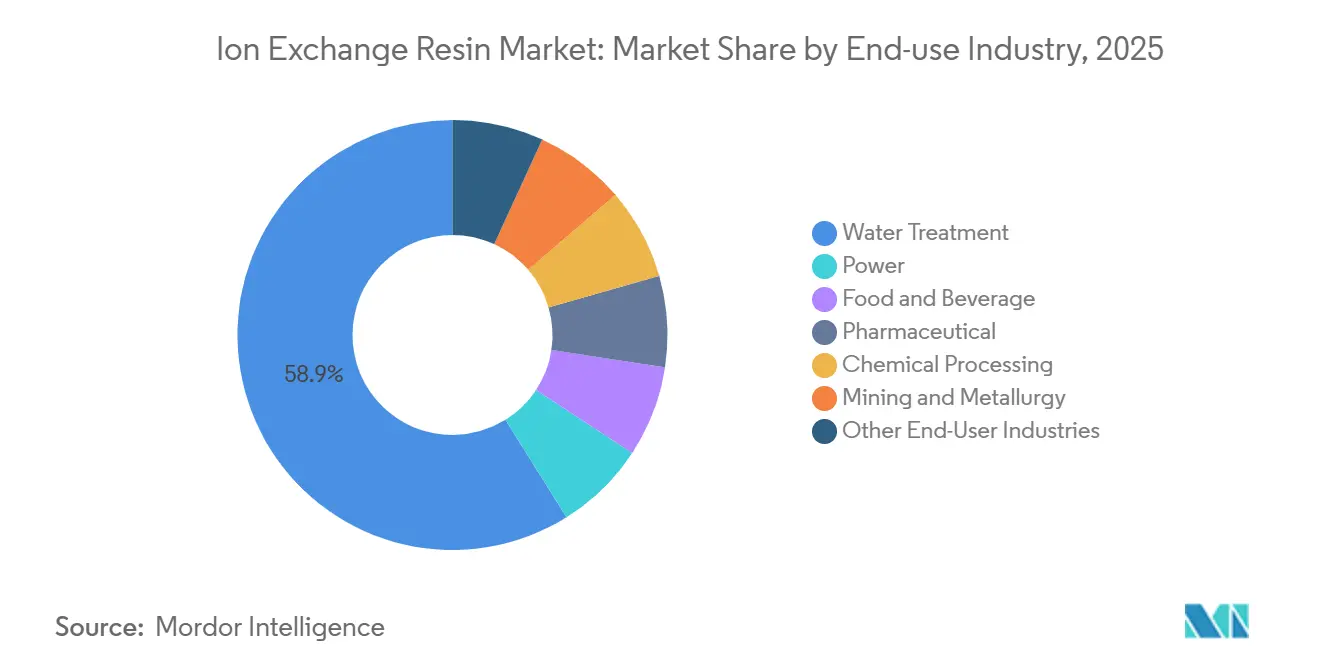
- By end-use industry, water treatment led with 52.43% of 2025 revenue; the Semiconductor and Electronics segment is forecast to grow 6.97% annually to 2031.
- By geography, Asia-Pacific commanded 34.59% of the 2025 value and is set to compound at 5.54% through 2031.
Note: Market size and forecast figures in this report are generated using Mordor Intelligence’s proprietary estimation framework, updated with the latest available data and insights as of January 2026.
Global Ion Exchange Resin Market Trends and Insights
Drivers Impact Analysis*
| Driver | (~) % Impact on CAGR Forecast | Geographic Relevance | Impact Timeline |
|---|---|---|---|
| Semiconductor-Grade Ultrapure Water Demand in Asia-Pacific | +1.2% | Asia-Pacific core (China, South Korea, Taiwan), spillover to Japan | Medium term (2-4 years) |
| PFAS and Heavy-Metal Discharge Limits Boosting Chelating Resins in North America | +1.0% | North America, EU secondary | Short term (≤ 2 years) |
| Desalination and ZLD Megaprojects in the Middle East Raising Mixed-Bed Uptake | +0.8% | Middle East (Saudi Arabia, UAE), North Africa | Medium term (2-4 years) |
| Hydrogen-Electrolyzer Incentives Lifting PFSA Ion-Exchange Membranes in Europe | +0.6% | Europe (Germany, Netherlands, Spain), North America secondary | Long term (≥ 4 years) |
| Sugar-Decolorization Boom Driving Food-Grade Resins in South America | +0.5% | South America (Brazil, Argentina) | Short term (≤ 2 years) |
| Source: Mordor Intelligence | |||


Semiconductor-Grade Ultrapure Water Demand in Asia-Pacific
Fabricating sub-3 nm logic chips requires water with total organic carbon below 1 ppb and resistivity above 18.2 MΩ·cm, a specification met only by nuclear-grade mixed-bed resins. Mitsubishi Chemical disclosed a 15% Diaion capacity expansion in April 2026, aimed at Taiwanese and South Korean foundries now ramping 2 nm production. SEMI standards mandate ion-exchange polishers as the final barrier before photolithography tools, displacing stand-alone membrane loops. China installed more than 200 ultrapure-water systems in 2025, each consuming 10-15 m³ of mixed-bed resin per gigawatt of fab capacity, creating supply-chain risk whenever typhoons delay styrene shipments across East Asia.
PFAS and Heavy-Metal Discharge Limits Boosting Chelating Resins in North America
The U.S. EPA finalized maximum contaminant levels of 4 ppt for PFOA and 10 ppt for PFOS in April 2024, with compliance required by 2029[1]U.S. Environmental Protection Agency, “Final PFAS National Primary Drinking Water Regulation,” epa.gov . Type II strong-base anion resins emerged as the best available technology for simultaneous removal of legacy and short-chain PFAS. Utilities in Michigan, New Jersey, and California awarded contracts exceeding USD 300 million in 2025 to retrofit granular-bed systems, even though spent-resin disposal remains unresolved. Parallel Clean Water Act updates tightened lead, cadmium, and chromium limits, accelerating uptake of iminodiacetic- and aminophosphonic-functional resins. Specialty grades now sell at 40–60% price premiums over commodity softening beads.
Desalination and ZLD Megaprojects in the Middle East Raising Mixed-Bed Uptake
Saudi Arabia’s NEOM and the UAE’s Taweelah expansion specify zero-liquid-discharge lines that combine RO, mixed-bed ion exchange, and brine crystallization. Mixed-bed units push TDS below 0.1 mg/L, enabling 98% water recovery and compliance with strict discharge bans. A 2025 Nature Water study pegged ZLD cost at USD 2.50–4.00 per m³ but noted that avoiding brine-disposal penalties offsets the premium within 5–7 years in arid regions. Resin life in Gulf seawater averages 3–4 years because high silica and organics accelerate fouling, creating repeat-purchase revenue for suppliers.
Hydrogen-Electrolyzer Incentives Lifting PFSA Membranes in Europe
Proton-exchange-membrane electrolyzers use perfluorosulfonic acid films—ion-exchange membranes that shuttle protons while blocking gas crossover. Germany installed 1.2 GW of PEM capacity in 2025, consuming about 180,000 m² of Nafion-equivalent membrane. The EU’s Horizon Europe program is funding non-PFAS alternatives, yet incumbent PFSA chemistry still delivers more than 0.1 S/cm proton conductivity at 80 °C. Membrane costs account for 12–15% of the electrolyzer stack, so any durability breakthrough in hydrocarbon ionomers could reshape the cost curve after 2028.
Restraints Impact Analysis*
| Restraint | (~) % Impact on CAGR Forecast | Geographic Relevance | Impact Timeline |
|---|---|---|---|
| Volatile Styrene and Acrylic Monomer Prices | -0.7% | Global, acute in Asia-Pacific and Europe | Short term (≤ 2 years) |
| Bio-Based Adsorbents Undercutting Resin Economics | -0.4% | North America, EU pilot markets | Medium term (2-4 years) |
| European Union Landfill and Incineration Restrictions on Spent Resins | -0.3% | EU-27, UK | Long term (≥ 4 years) |
| Source: Mordor Intelligence | |||
Volatile Styrene and Acrylic Monomer Prices
Styrene-divinylbenzene copolymers constitute more than 80% of global output, yet styrene traded between USD 1,150 and USD 1,450 t⁻¹ in Asia during 2024-2025, lifting finished-resin costs 6–8%. Acrylic resins used in pharma and food lines face similar volatility after European acrylic-acid prices rose 22% year-on-year in H1 2025. Smaller producers in India and China, reliant on spot feedstock, saw margins compress to 7–9%, forcing consolidation and occasional plant shutdowns.
European Union Landfill and Incineration Restrictions on Spent Resins
Amended EU Waste Framework Directive classifies spent resin with heavy metals as hazardous, pushing disposal costs to EUR 800–1,500 t⁻¹ and introducing extended producer responsibility[2]European Union, “Waste Framework Directive 2008/98/EC,” eur-lex.europa.eu . LANXESS and Purolite have built take-back programs across Germany, France, and the Netherlands, but smaller firms lack scale, increasing market entry barriers and nudging some end users toward membrane alternatives.
*Our forecasts treat driver/restraint impacts as directional, not additive. The impact forecasts reflect baseline growth, mix effects, and variable interactions.
Segment Analysis
By Type: Specialty Grades Gain on Compliance and Purity Mandates
Commodity resins delivered 74.35% of 2025 revenue, anchored by boiler-feed softening systems priced at USD 8–12 L⁻¹. However, specialty resins are projected to grow 5.33% annually, eclipsing commodity expansion by 63 bps. Lithium-selective resins launched by Sunresin and LANXESS in 2024-2025 provide Mg:Li selectivity above 100:1, enabling direct extraction from Argentine and Chilean brines. Food-grade variants that meet NSF/ANSI 61 carry USD 3–5 L⁻¹ additional cost yet prevent off-flavor recalls in beverage lines.
Macroporous beads with permanent porosity now dominate sugar-decolorization and antibiotic purification because they resist osmotic shock, extending service life. Continued migration toward compliance-driven chemistries will narrow commodity revenue share by 2031.

By Application Function: PFAS Mitigation Reshapes Demand Mix
Softening and demineralization contributed 58.42% of 2025 turnover, yet demand is plateauing as membrane alternatives gain traction in residential appliances. Driven by the rapid expansion of semiconductor fabs, sterile pharmaceutical manufacturing, and high-precision electronics assembly, the market for ion-exchange resins used in ultrapure water (UPW) production is projected to grow at a rate of approximately 6.09% through 2031. Heavy-metal removal and PFAS mitigation will expand at a moderate rate through 2031, driven by U.S. EPA and EU discharge limits. Anion beds can concentrate PFAS 10,000–50,000×, transferring liability to waste handlers and creating a secondary treatment market. Catalysis and chromatographic separations remain high-margin niches, fetching USD 60–100 L⁻¹ for thiourea-functionalized gold-recovery resins.


By End-use Industry: Semiconductor and Electronics Segment Leads Growth
Water treatment kept 52.43% of end-use revenue in 2025, underpinned by municipal, industrial boiler, and wastewater circuits. Driven by chip-fabrication node miniaturization and stringent ultrapure-water polishing requirements, the semiconductor and electronics sector is set to grow at a brisk pace, achieving a 6.97% CAGR through 2031, underscoring the industry's heightened demand for sub-ppb ionic contamination control. The pharmaceutical industry benefits from USP (1231) requirements that specify conductivity below 1.3 µS cm⁻¹. Single-use chromatography resins priced at USD 8,000–15,000 L⁻¹ are replacing stainless columns, cutting cleaning validation and cross-contamination risk. Power generation’s transition away from steam-cycle coal plants tempers resin demand, limiting growth through 2031. Mining and metallurgy garner incremental traction via lithium and rare-earth extraction, whereas food-and-beverage volumes move in tandem with sugar pricing cycles.
Geography Analysis
Asia-Pacific held 34.59% of 2025 revenue and should log a 5.54% CAGR through 2031, paced by semiconductor fabs and lithium-brine projects. China added more than 200 ultrapure-water systems in 2025, each deploying 10–15 m³ of mixed-bed resin per gigawatt of capacity. India’s pharmaceutical boom and revised Schedule M water codes are catalyzing mixed-bed upgrades, while ASEAN markets such as Vietnam and Malaysia are attracting greenfield electronics investments. Volatile styrene feedstock—26% price swing peak-to-trough in 2024-2025—compresses margins for producers without vertical integration.
In North America, EPA PFAS rules mean 6–10% of U.S. public water systems will require anion-exchange retrofits by 2029. Canada’s oil-sands projects rely on ion exchange to polish produced water, but capex cuts in Alberta curb incremental demand. Mexico’s near-shoring inflow is pushing electronics-coating lines that require ultrapure water, expanding the ion exchange resin market across the USMCA corridor.
Europe trails in growth as landfill restrictions raise lifecycle costs, yet the bloc retains a technology edge. EU hydrogen targets of 40 GW electrolyzer capacity by 2030 imply cumulative PFSA membrane demand of 6–8 million m², though AEM pilots could partially cannibalize PFSA volumes. South America concentrates in Brazil and Argentina, where sugar refining and mining projects drive food-grade and chelating resin adoption. The Middle East and Africa drive demand as desalination and zero-liquid-discharge mandates rolled out across Saudi Arabia, the UAE, and Qatar.

Competitive Landscape
The ion exchange resin industry exhibits moderate concentration, with LANXESS, DuPont, Mitsubishi Chemical, Ecolab, and Samyang Corporation collectively holding an estimated 55% of global capacity. Chinese challengers such as Sunresin and Suqing Group expand specialty output at capital costs 40–50% lower than Western peers, eroding commodity margins. DuPont filed 14 patents in 2024-2025 for PFAS-free membranes targeting electrolyzer applications. LANXESS partnered with Veolia in January 2026 to supply Lewatit chelating beads for a Saudi Aramco ZLD facility, illustrating a pivot toward lifecycle-service contracts. ResinTech and Eichrom carve out analytical niches, selling ultra-pure beads at USD 200 L⁻¹. Bio-based adsorbents and electrodeionization units pose long-run substitution threats, but current durability gaps confine them to pilots.
Ion Exchange Resin Industry Leaders
DuPont
LANXESS
Mitsubishi Chemical Group Corporation
Ecolab
Samyang Corporation
- *Disclaimer: Major Players sorted in no particular order


Recent Industry Developments
- October 2025: IEI inaugurated a new resin manufacturing facility in Roha, Maharashtra, as part of its expansion strategy. The Greenfield plant, designed for a total capacity of 42,600 m³ per annum, began operations with an initial phase capacity of 3,696 m³.
- October 2024: The Mitsubishi Chemical Group Corporation increased the production capacity of ion exchange resins used in the production of ultrapure water for semiconductor manufacturing processes. This expansion took place at Mitsubishi Chemical’s Kyushu-Fukuoka Plant in Kitakyushu City, Fukuoka Prefecture, Japan.


Research Methodology Framework and Report Scope
Market Definitions and Key Coverage
Our study defines the ion exchange resin market as the value generated from the sale of new, synthetic cationic, anionic, and mixed-bed resins that work through reversible ion displacement to purify, separate, or decontaminate liquid streams across municipal and industrial settings, including ultrapure water circuits, food processing, power plant condensate polishing, hydrometallurgy, and emerging PFAS removal. According to Mordor Intelligence, revenues tied to off-site regeneration services, on-site operating contracts, or chromatography resins formulated specifically for bioprocessing are not included.
Scope Exclusion: Spent-resin disposal and resale, in-house regenerated media, and single-use chromatography beads fall outside the present sizing.
Segmentation Overview
- By Type
- Commodity Resins
- Specialty Resins
- By Application Function
- Softening and Demineralization
- Ultrapure Water Production
- Heavy-Metal Removal and PFAS Mitigation
- Catalysis and Separation (Non-Water)
- Sugar Decolorization and Food and Beverage Purification
- Precious-Metal Recovery and Hydrometallurgy
- By End-use Industry
- Water Treatment
- Power
- Food and Beverage
- Pharmaceutical
- Chemical Processing
- Mining and Metallurgy
- Other End-User Industries
- By Geography
- Asia-Pacific
- China
- India
- Japan
- South Korea
- ASEAN Countries
- Rest of Asia-Pacific
- North America
- United States
- Canada
- Mexico
- Europe
- Germany
- United Kingdom
- Italy
- France
- Rest of Europe
- South America
- Brazil
- Argentina
- Rest of South America
- Middle East and Africa
- Saudi Arabia
- South Africa
- Rest of Middle East and Africa
- Asia-Pacific
Detailed Research Methodology and Data Validation
Primary Research
Mordor analysts then interview resin formulators, water engineers, power plant chemists, and Southeast Asian distributors across China, India, the United States, Germany, and the Gulf. These conversations stress-test desk findings, surface real ASP movements, and reveal adoption curves for PFAS-focused and hydrogen-electrolyzer grades, enabling us to fine-tune penetration inputs and replacement cycles.
Desk Research
We start by mapping demand pools using reliable, openly available datasets such as UN Comtrade resin tariff codes, U.S. Geological Survey ion-exchange mineral substitutes, China Water Risk inventory updates, and Eurostat discharge limit revisions. Trade association material from WEFTEC, International Water Association, and Semiconductor Equipment and Materials International adds regulatory and technological context. Company 10-Ks, investor decks, and patent families (via Questel) help align average selling prices, capacity expansions, and grade mix shifts. Dow Jones Factiva screens track quarterly volume guidance and contract awards. This list is illustrative; a wider range of public and paid sources was reviewed to ground every assumption.
Market-Sizing & Forecasting
A top-down reconstruction begins with production and import-export tonnage, which are converted to value through region-specific blended ASPs. Results are corroborated with selective bottom-up checks, sampled supplier roll-ups and channel audits, to align totals. Key variables in our model include municipal desalination build-outs, semiconductor fab capacity additions, power-sector condensate polishing demand, PFAS regulatory rollout timelines, typical resin service life, and styrene-acrylic cost trajectories. Forecasts draw on a multivariate regression that couples these drivers with GDP and industrial water spending outlooks, while scenario analysis adjusts for raw-material cost swings or delayed hydrogen incentives. Where bottom-up gaps appear, proxy volumes from adjacent adsorbents are scaled using validated substitution ratios.
Data Validation & Update Cycle
Outputs pass a three-step peer review, variance checks against third-party shipment trackers, and anomaly discussions with senior chemists before sign-off. Reports refresh each year, and material events, such as sudden monomer price spikes or new discharge norms, trigger interim updates, ensuring clients receive our latest view.
Why Mordor's Ion Exchange Resin Baseline Stands Up to Scrutiny
Published market numbers often diverge because firms pick different resin families, geographic mixes, and price anchors, which pushes totals up or down.
Key gap drivers include varying inclusion of chromatography beads, differing weight on service revenue, inconsistent ASP escalation, and conversion currencies that are not harmonized to purchase-power parities. Mordor's disciplined scope and annual refresh cadence minimize these distortions.
Benchmark comparison
| Market Size | Anonymized source | Primary gap driver |
|---|---|---|
| USD 2.47 B (2025) | Mordor Intelligence | |
| USD 2.13 B (2024) | Global Consultancy A | Focuses mainly on water and power end uses and relies strictly on shipment data, missing specialty resin demand |
| USD 2.76 B (2024) | Industry Journal B | Adds chromatography and service revenues, inflating total value |
| USD 1.95 B (2024) | Regional Consultancy C | Uses conservative ASPs, excludes niche grades, and converts currencies at pre-pandemic rates |
Taken together, the comparison shows that when the right scope, current price benchmarks, and multi-variable forecasts are combined, Mordor delivers a balanced, transparent baseline that decision-makers can replicate and trust.


Key Questions Answered in the Report
What is the current value of the ion exchange resin market?
The ion exchange resin market size is USD 2.48 billion in 2026 and is on course for USD 3.12 billion by 2031.
Which region leads demand growth for ion-exchange resins?
Asia-Pacific leads, capturing 34.59% of 2025 revenue and posting a forecast 5.54% CAGR through 2031.
Which application is expanding fastest?
Ultrapure Water Production is growing 6.09% annually, outpacing all other functions.
Why are specialty resins gaining share?
Regulatory mandates in semiconductors, pharma, and PFAS remediation favor high-purity, selective chemistries that command premium pricing.
Page last updated on:


