Internet Of Nano Things Market Size and Share
Market Overview
| Study Period | 2020 - 2031 |
|---|---|
| Market Size (2026) | USD 28.7 Billion |
| Market Size (2031) | USD 87.06 Billion |
| Growth Rate (2026 - 2031) | 24.85% CAGR |
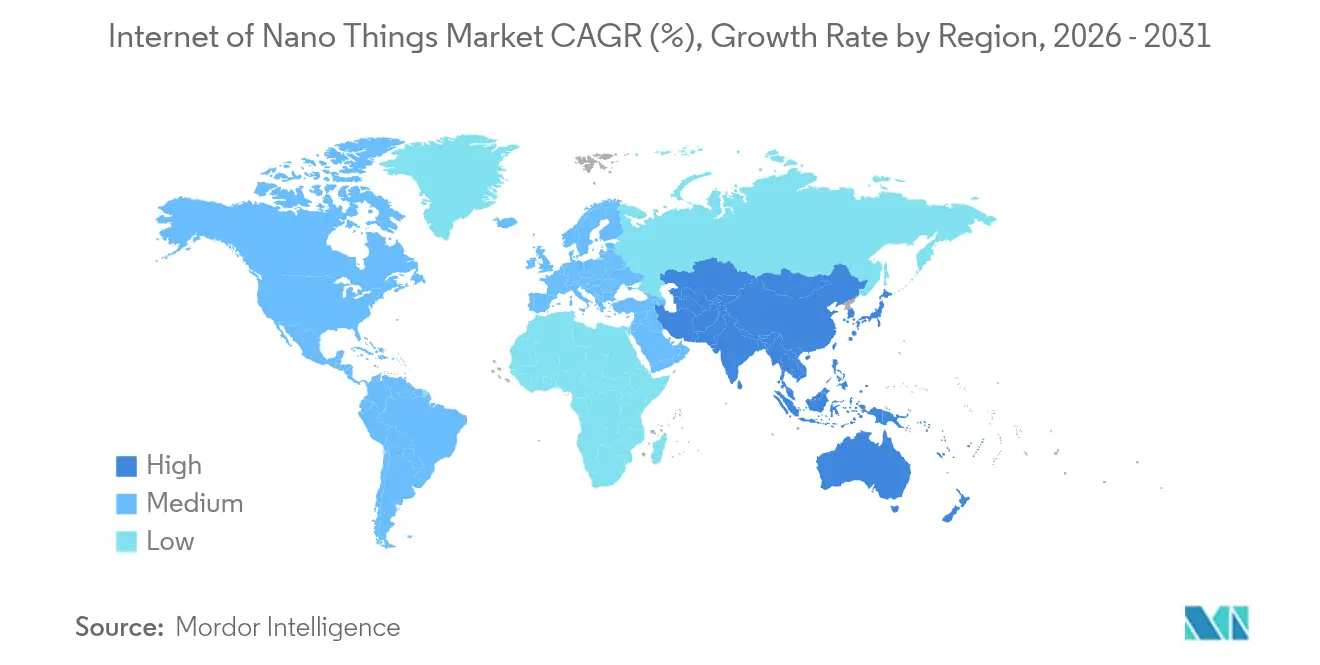
| Fastest Growing Market | Asia Pacific |
| Largest Market | North America |
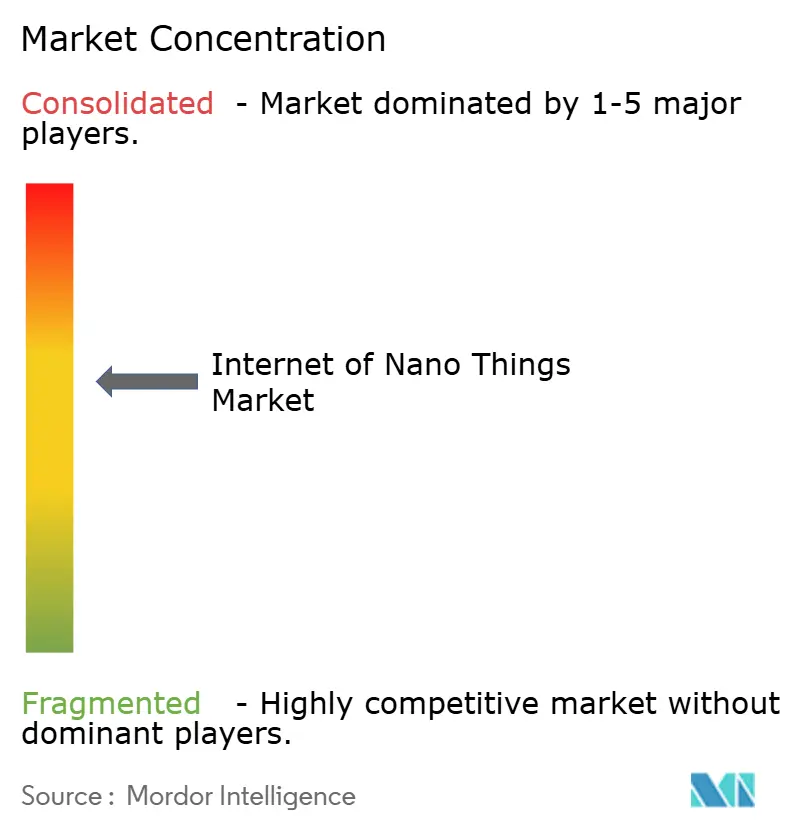
| Market Concentration | Medium |
Major Players *Disclaimer: Major Players sorted in no particular order Image © Mordor Intelligence. Reuse requires attribution under CC BY 4.0. | |
Internet Of Nano Things Market Analysis by Mordor Intelligence
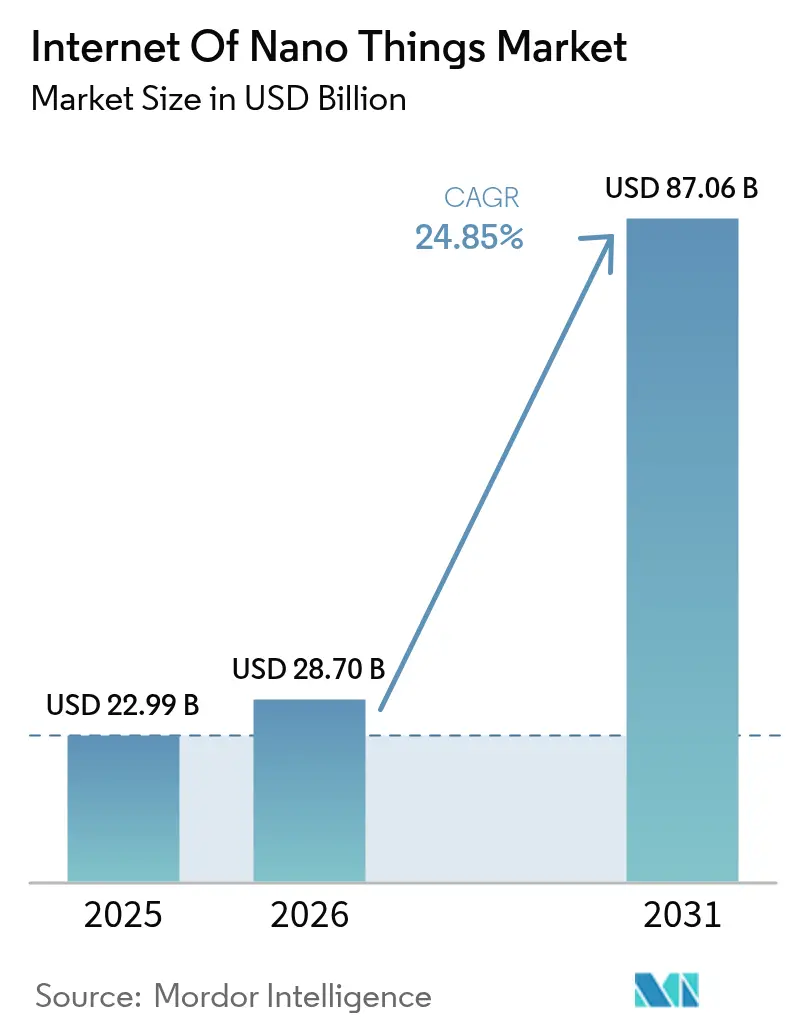
The Internet of Nano Things Market size in 2026 is estimated at USD 28.7 billion, growing from 2025 value of USD 22.99 billion with 2031 projections showing USD 87.06 billion, growing at 24.85% CAGR over 2026-2031. The surge reflects the commercialisation of terahertz‐band nano-antenna designs, the roll-out of ultra-low power carbon-nanotube sensors, and the rapid convergence of nanoscale communication protocols with mainstream wireless networks. Governments are funding pandemic surveillance frameworks built on nanosensors, while private investment is accelerating AI-driven orchestration platforms that translate molecular-level data into actionable insight. Hardware continues to account for almost half of all spending, but software platforms are expanding at a markedly faster pace as enterprises prioritise analytics over devices. Regionally, North America leads on account of federal research grants and early terahertz spectrum allocation, yet Asia-Pacific exhibits the strongest growth as semiconductor hubs embed nanosensor networks into Industry 4.0 roadmaps. Competitive pressure is intensifying as semiconductor majors leverage existing fabs while start-ups introduce disruptive molecular communication stacks, but steep fabrication costs and fragmented spectrum policies remain notable headwinds.
Key Report Takeaways
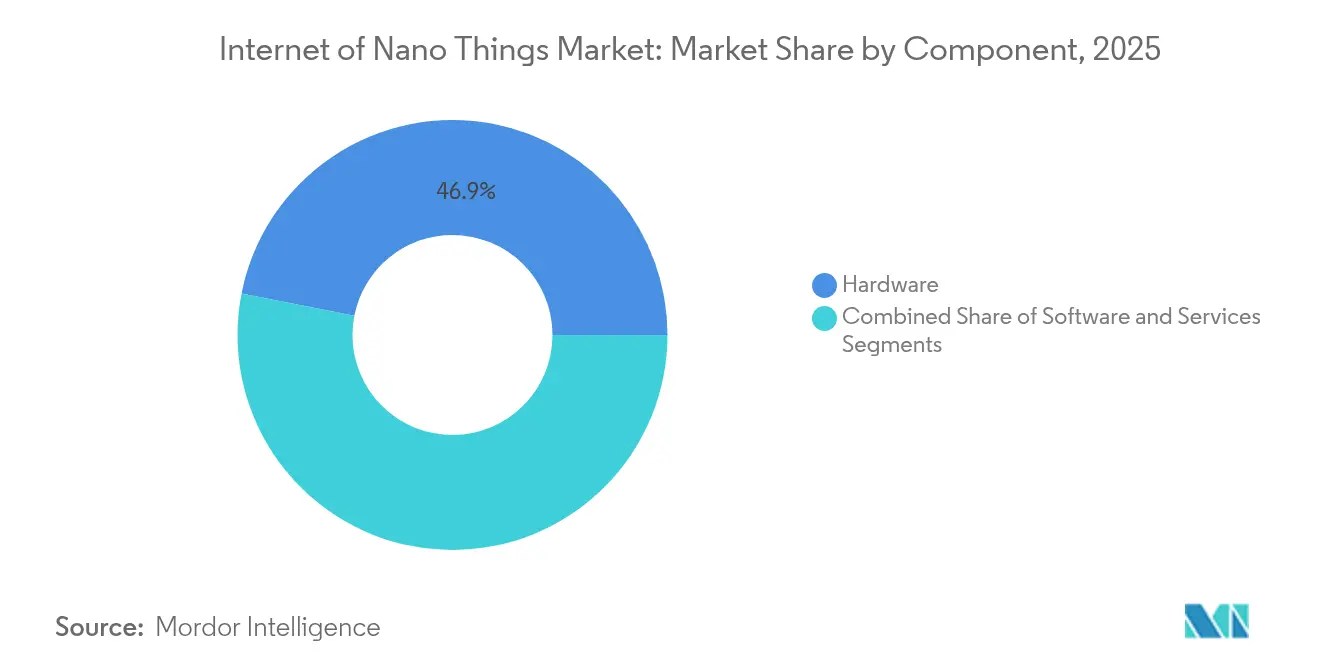
- By component, hardware dominated with 46.90% of the Internet of Nano Things market share in 2025, whereas software is projected to post a 28.12% CAGR to 2031.
- By end-user, healthcare held 29.90% revenue share in 2025; smart cities and infrastructure are forecast to expand at a 27.05% CAGR through 2031.
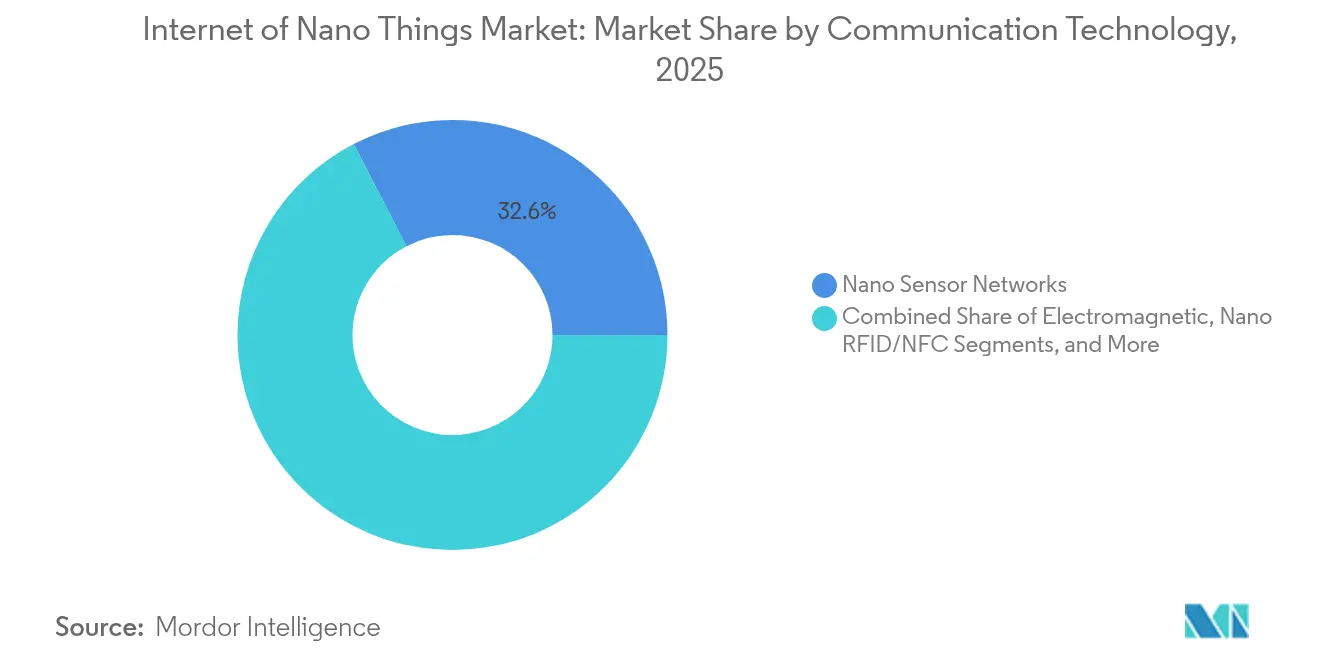
- By communication technology, nano sensor networks captured 32.60% of the Internet of Nano Things market size in 2025, and molecular communication will grow the fastest at 27.95% CAGR to 2031.
- By deployment model, cloud solutions commanded a 54.10% share of the Internet of Nano Things market size in 2025, while hybrid architectures should record a 28.42% CAGR to 2031.
- By geography, North America led with 38.10% of the Internet of Nano Things market share in 2025; Asia-Pacific is projected to be the fastest-growing region at 27.62% CAGR.
Note: Market size and forecast figures in this report are generated using Mordor Intelligence’s proprietary estimation framework, updated with the latest available data and insights as of 2026.
Global Internet Of Nano Things Market Trends and Insights
Drivers Impact Analysis*
| Driver | ( ~ ) % Impact on CAGR Forecast | Geographic Relevance | Impact Timeline |
|---|---|---|---|
| Rapid advancements in nanotechnology enabling ultra-low power sensors | +6.2% | Global, with concentration in North America and Asia-Pacific | Medium term (2-4 years) |
| Growing demand for real-time health monitoring wearables | +5.8% | Global, led by North America and Europe | Short term (≤ 2 years) |
| Increasing adoption of Industry 4.0 and smart manufacturing | +4.9% | Asia-Pacific core, spill-over to North America and Europe | Medium term (2-4 years) |
| Proliferation of 5G/6G and edge computing infrastructure | +4.1% | Global, with early deployment in developed markets | Long term (≥ 4 years) |
| Emerging terahertz-band nano-antenna breakthroughs reducing signal attenuation | +3.7% | North America and Europe, expanding to Asia-Pacific | Long term (≥ 4 years) |
| Government-funded pandemic surveillance networks leveraging nanosensors | +2.1% | Global, with government-led initiatives | Short term (≤ 2 years) |
| Source: Mordor Intelligence | |||


Rapid Advancements in Nanotechnology Enabling Ultra-Low Power Sensors
Carbon-nanotube-based devices now harvest ambient energy, removing conventional battery constraints and slashing maintenance cycles. MIT engineers demonstrated plant-powered nanosensors that self-energize through photosynthesis, validating energy autonomy for remote deployments. [1]Matt Sparks, “Plant-Based Nanosensors Harvest Energy From Photosynthesis,” technologyreview.com Boron nitride nanotube fibres provide heat-tolerant networks that withstand harsh industrial settings without degradation. Coupled with AI-accelerated materials discovery, exemplified by Materials Nexus’ rare-earth-free permanent magnet breakthrough, innovation cycles have shrunk from years to months. These advances unlock applications ranging from precision agriculture to hazardous-environment monitoring, underpinning the long-term growth of the Internet of Nano Things market.
Growing Demand for Real-Time Health Monitoring Wearables
FDA clearance of Nanowear’s nanosensor cardiac patch underscores regulatory validation for nano-enabled medical devices. [2]Source: US Food and Drug Administration, “510(k) Clearance Database,” fda.gov Continuous glucose monitors built on carbon-nanotube films now rival laboratory accuracy while retaining discreet, skin-patch form factors. Multi-analyte patches track electrolytes, lactate, and cortisol simultaneously, supporting preventive care models that lower chronic-disease costs. Hospitals integrating these devices report earlier sepsis detection and shorter ICU stays, reinforcing healthcare’s contribution to the Internet of Nano Things market expansion. The sector’s 30.3% revenue share in 2024 signals entrenched demand that other verticals must challenge.
Increasing Adoption of Industry 4.0 and Smart Manufacturing
Manufacturers embed nanosensors in capital assets to capture molecular-scale friction signatures, enabling prediction of bearing failures weeks ahead; Nanoprecise clients report up to 70% reductions in unplanned downtime. TSMC employs nanosensor grids inside fabs to detect sub-nanometre particle contamination, safeguarding yield at advanced nodes. Molecular communication protocols create self-organising sensor swarms that adapt to shifting production schedules without manual re-programming. These capabilities improve overall equipment effectiveness by as much as 25% and underpin the 4.9% positive CAGR contribution attributed to smart-manufacturing adoption.
Proliferation of 5G/6G and Edge Computing Infrastructure
5G roll-outs offer sub-10 ms latency, a baseline for real-time nanosensor feedback loops. Emerging 6G concepts allocate terahertz bands specifically for nano-device traffic, eliminating antenna-size constraints and enabling direct device-to-device exchanges. Qualcomm’s multi-link management patents target extended-reality workloads powered by distributed nanosensor arrays. At the edge, customised inference chips process molecular data locally, cutting response times to microseconds. The infrastructure evolution is especially critical for autonomous robots and hazard-detection systems, where latency gaps risk operational safety.
Restraints Impact Analysis*
| Restraint | (~) % Impact on CAGR Forecast | Geographic Relevance | Impact Timeline |
|---|---|---|---|
| Severe data security and privacy risks at nanoscale | -4.3% | Global, with heightened concerns in Europe and North America | Short term (≤ 2 years) |
| High capital costs and complexity of nano-fabrication | -3.8% | Global, particularly affecting emerging markets | Medium term (2-4 years) |
| Biocompatibility and long-term cytotoxicity concerns in human body deployments | -2.1% | Global, with stricter regulations in developed markets | Long term (≥ 4 years) |
| Lack of standardized terahertz spectrum regulations causing deployment delays | -1.9% | Global, with regional variations in regulatory frameworks | Medium term (2-4 years) |
| Source: Mordor Intelligence | |||
Severe Data Security and Privacy Risks at Nanoscale
Nanosensors lack the compute headroom for traditional encryption, exposing attack surfaces that could compromise hospital, factory, or municipal networks. Implantable medical nanosensors are especially vulnerable; a hijacked glucose monitor can falsify readings, endangering patients. GDPR treats nanosensor data as high-risk, mandating explicit consent that is difficult to implement on autonomous sub-millimetre devices. Quantum-resistant lightweight ciphers remain at proof-of-concept stages, widening the security gap and exerting a negative 4.3% pull on forecast CAGR for the Internet of Nano Things market.
High Capital Costs and Complexity of Nano-Fabrication
State-of-the-art nano fabs exceed USD 1 billion in upfront investment, with yields hampered by defect density above 30%. Entegris generated USD 773 million in Q1 2025 sales from contamination-control tools that are now indispensable for nanosensor production. Skilled-labour shortages extend equipment ramp-up to 24 months, stretching payback periods and restraining supply. Consequently, smaller entrants rely on foundry partnerships or focus on design IP, tempering competitive diversity despite strong end-market demand.
*Our forecasts treat driver/restraint impacts as directional, not additive. The impact forecasts reflect baseline growth, mix effects, and variable interactions.
Segment Analysis
By Component: Software Acceleration Outpaces Hardware Dominance
Hardware generated 46.90% of 2025 revenue, anchoring the Internet of Nano Things market in essential physical devices, antennas, and gateways. Yet the software segment is racing ahead at a 28.12% CAGR as analytics platforms capitalise on torrents of molecular data. Services remain nascent but record double-digit growth because enterprises require consulting expertise to integrate nano-devices with legacy systems. Dow’s collaboration with Carbice on thermal interface materials shows how specialised know-how is turning into high-margin service lines.
The software boom is redefining value capture: hardware margins compress as commoditisation sets in, while orchestration stacks that manage billions of endpoints command premium licences. Cloud vendors embed nano-device APIs, drawing developers into unified platforms that bundle security, AI, and lifecycle management. Over the forecast horizon, the Internet of Nano Things market size linked to software revenues is projected to narrow the gap on hardware, recalibrating competitive strategies across the ecosystem.


By End-user: Healthcare Leadership Challenged by Smart Cities Surge
Healthcare contributed 29.90% of 2025 revenue and remains the largest adopter, leveraging nanosensors for continuous vitals monitoring, implant surveillance, and smart drug delivery. Smart-city programmes, however, will expand at 27.05% CAGR to 2031 as municipalities deploy nanosensor meshes for air-quality analytics, water-leak detection, and intelligent traffic control. In manufacturing, nanosensors embedded on production lines feed real-time molecular data into predictive-maintenance engines, while logistics firms fit nanosensors inside containers to verify cold-chain compliance.
Environmental agencies adopt nanosensor buoys that detect pollutants at parts-per-billion resolution, a capability classical sensors lack. Agriculture outfits scatter plant-tissue nanosensors that signal nutrient deficits early, cutting fertiliser usage and water waste. These deployments illustrate how vertical diversification is accelerating overall Internet of Nano Things market penetration across the real economy.
By Communication Technology: Molecular Communication Disrupts Traditional Protocols
Nano sensor networks led with a 32.60% share in 2025, adapting classical RF protocols for pico-watt budgets. Molecular communication, though still emergent, will post a 27.95% CAGR to 2031 as biochemical signalling overcomes RF propagation limits inside human tissue or subterranean infrastructure. Electromagnetic links retain primacy where bandwidth demands are high, notably in industrial automation and smart grids. Passive Nano RFID tags support asset tracking, whereas nano satellite gateways offer global backhaul for environmental deployments.
Hybrid multi-radio chips dynamically toggle between terahertz, molecular, and RFID pathways, selecting the lowest-energy route based on context. Samsung’s AI-enabled scheduler evidences the trend toward orchestrated multi-modal stacks that underpin the Internet of Nano Things market expansion.
By Deployment Model: Hybrid Architectures Bridge Cloud-Edge Divide
Cloud platforms owned 54.10% of 2025 spending because nanosensor traffic requires elastic compute and large-scale analytics. Yet hybrid models will grow fastest at 28.42% CAGR as firms localise time-critical inference near machines and send aggregated insight to the cloud. AWS and Orbital Materials are co-designing AI workloads for greener data centres, reflecting pressure to host nano workloads sustainably.
On-premise variants serve defence, healthcare, and regulated industries that cannot offload sensitive molecular data to public clouds. Edge boxes integrate tamper-resistant modules and quantum-safe ciphers, addressing privacy worries highlighted earlier. Over time, reference architectures will standardise workload placement, giving enterprises blueprints to scale Internet of Nano Things market deployments without breaching latency or sovereignty thresholds.
Geography Analysis
North America retained 38.10% revenue share in 2025, buoyed by federal grants, early terahertz spectrum allocation, and entrenched semiconductor fabs capable of nano-class production. The NIST IoT Advisory Board provides clarity around standards, accelerating commercial pilots. However, high labour costs and capital outlays squeeze margins, and the talent pipeline struggles to supply nano-manufacturing technicians. The United States focuses on defence, aerospace, and advanced healthcare implants, while Canada channels resources into environmental monitoring for natural-resource stewardship.
Asia-Pacific will post a 27.62% CAGR to 2031, reflecting aggressive Industry 4.0 incentives, deep electronics supply chains, and expansive 5G footprints. China drives manufacturing uptake, embedding nanosensors inside fabs and chemical plants to boost yield and safety, while Japan’s med-tech firms pioneer bio-compatible nano implants. South Korea exploits telecom leadership to pilot 6G-ready nano-mesh networks. Regional governments subsidise nano R&D, compressing time-to-market and intensifying competition. The resulting scale advantages will narrow the Internet of Nano Things market size gap between Asia-Pacific and North America by decade end.
Europe remains influential, championing data privacy and sustainability frameworks that shape global norms. Horizon Europe has earmarked EUR 100 million for edge-AI and IoT research, with part allocated to nano-device interoperability. Germany deploys nanosensors in precision manufacturing, and the United Kingdom tests graphene-based health patches. Emerging regions in South America and the Middle East, and Africa invest selectively in environmental and infrastructure monitoring, capitalising on nanosensors’ ability to deliver high granularity at lower lifecycle costs.

Regulatory Landscape
The Internet of Nano Things (IoNT) regulatory environment is shaped by nanomaterials safety requirements and data-privacy obligations that apply to nano-enabled sensing, particularly in healthcare and smart infrastructure. In the European Union, the European Chemicals Agency (ECHA) regulates nanomaterials under REACH and CLP, with nanoform reporting obligations in place since January 1, 2020. By April 2026, REACH registration dossiers for nanoforms reached 1,109 submissions across 186 registered substances, indicating tighter compliance scrutiny across the supply chain.
Standardization is still fragmented by region and use case. IEEE Std 1906.1 is a widely cited framework for nanoscale communications, while IEEE 62659 supports nanomanufacturing practices that help vendors align interoperability and process controls for commercial deployments. Regulators and policy bodies continue to flag security and governance gaps for IoT systems that become more pronounced at nanoscale, which has reinforced procurement preference for vendors that can document privacy-by-design and safety across materials, device behavior, and data handling.
Value Chain Analysis
The IoNT value chain begins with nanomaterials and nano-fabrication inputs (carbon nanotubes, graphene and related nanostructures, specialty chemicals, and contamination-control consumables), then progresses to equipment-intensive manufacturing for nanosensors, nano-antennas, and nano-enabled modules. Midstream players include semiconductor and device OEMs, along with specialist nano-component firms, while downstream value capture increasingly shifts to software platforms that orchestrate nanoscale data, device identity, and lifecycle management across cloud, edge, and hybrid deployments.
Systems integration and connectivity bridge nano-networking to mainstream telecom and enterprise IT through nano-gateways and protocol stacks that draw on standards such as IEEE 1906.1 for nanoscale and molecular communications. Bottlenecks remain concentrated around fabrication cost, yield sensitivity, and interoperability gaps, and network-lifetime constraints keep energy management and routing optimization central to solution design. Recent research on the ENCORE framework for dense 3D wireless nano-sensor networks reflects the importance of extending network lifetime where post-deployment energy replenishment is limited, which in turn supports partnerships among materials specialists, foundries, telecom integrators, and analytics vendors.
Competitive Landscape
The Internet of Nano Things market is moderately fragmented: top semiconductor houses such as Intel, Samsung, and STMicroelectronics leverage billion-dollar fabs, while start-ups like Nanoscribe and Nanoprecise specialise in photonic nanoprinting and predictive-maintenance sensors. The race centres on material innovations, AI-enabled orchestration, and vertical integration. Seoul National University’s patent for a scalable nano computing device underscores academic contributions that incubate commercial breakthroughs. [4]Seoul National University R&DB Foundation, “Nano Computing Device Patent Application,” uspto.report
Strategic alliances are common. 3M joined the US-JOINT consortium to pool R&D on advanced packaging, strengthening die-stacking know-how critical for nanosensor modules. Dow and Carbice merged silicone chemistry with carbon-nanotube thermal interfaces, solving heat issues that limit sensor density. Tool vendors Veeco and Lam Research enjoy backlog growth as deposition and etch intensity rise for nano-scale geometries. Meanwhile, materials specialist Materials Nexus unveiled rare-earth-free magnets, signalling a drive to lower bill-of-materials costs and diversify supply risk.
Regulation shapes strategy. Firms with early compliance with GDPR-class privacy and terahertz spectrum guidelines secure procurement advantages. Start-ups often license IP to incumbents instead of scaling capex-heavy manufacturing, fostering a layered ecosystem of device OEMs, foundries and software orchestrators. This dynamic balances innovation velocity with supply-chain resilience as the Internet of Nano Things market matures.
Internet Of Nano Things Industry Leaders
IBM Corporation
Intel Corporation
Cisco Systems, Inc.
Qualcomm Technologies, Inc.
Siemens AG
- *Disclaimer: Major Players sorted in no particular order

Market Opportunities and Future Outlook
Compliance-driven redesign and materials traceability are creating near-term opportunities for suppliers that can certify nano-enabled electronics and nanosensor modules for export markets. The European Commission revision to RoHS Annex II, restricting specific nanomaterials (nano-scale titanium dioxide, zinc oxide, silver, and carbon quantum dots) in electrical and electronic equipment effective January 1, 2027, raises demand for bill-of-materials transparency, alternative material stacks, and test and reporting services across wearable, smart-home, and embedded sensing products sold into the EU.
On the technology side, the clearest opportunity set is shifting toward software-defined, AI-integrated IoNT (AIoNT) and longer-life nanonetwork operations rather than differentiation at the device level. Research published in 2026 on routing and clustering approaches such as ENCORE for dense 3D wireless nano-sensor networks points to a practical route to extend network lifetime in deployments where energy replenishment is constrained, including industrial and environmental use cases. Standards such as IEEE Std 1906.1.1-2020 (YANG data model for nanoscale communication systems) also support configurable, interoperable simulation-to-operation workflows, widening the space for orchestration platforms that convert molecular-level telemetry into enterprise analytics and automated control policies.
Recent Industry Developments
- April 2026: Cisco introduced the Cisco Universal Quantum Switch as a research prototype with sub-nanosecond switching and reconfiguration, developed at its quantum labs in Santa Monica. The effort sits within a full-stack quantum networking program and includes collaboration with IBM, reinforcing an ecosystem approach to next-generation network architectures that can influence how future high-speed and ultra-low-latency backbones interface with emerging device classes.
- May 2025: 3M joined the US-JOINT Consortium, a 12-member group focused on advancing semiconductor packaging. Improved packaging capability supports denser, higher-performance nano-enabled modules and can reduce integration friction for IoNT hardware moving from pilots into scaled manufacturing.
- October 2024: Versarien Plc secured a licensing deal with Montana Quimica for graphene production in Brazil while expanding its graphene pipeline. Wider regional availability of graphene-related material options can support localization of nano-enabled sensor and electronics supply chains for applications that depend on advanced nanomaterials.


Research Methodology Framework and Report Scope
Market Definition and Coverage
For this methodology, the internet of nano things (IoNT) market is measured as revenue generated from nano-scale connected systems, covering enabling hardware, software, and connectivity or service spending used to sense, communicate, and act on data across defined end uses.
Scope exclusions: Consumer IoT devices that do not rely on nano-scale sensing or nano-communication layers, and pure nanomaterials sales that are not tied to a connected IoNT use case, are not counted.
Segmentation Overview
- By Component
- Hardware
- Software
- Services
- By End-user
- Healthcare
- Logistics and Transportation
- Defense and Aerospace
- Manufacturing
- Energy and Power
- Environmental Monitoring
- Retail
- Agriculture
- Smart Cities and Infrastructure
- Other End-users
- By Communication Technology
- Electromagnetic
- Molecular Communication
- Nano RFID/NFC
- Nano Sensor Networks
- Nano Satellite Communication
- Others
- By Deployment Model
- On-Premise
- Cloud
- Hybrid
- By Geography
- North America
- United States
- Canada
- Mexico
- South America
- Brazil
- Argentina
- Chile
- Rest of South America
- Europe
- Germany
- United Kingdom
- France
- Italy
- Spain
- Russia
- Rest of Europe
- Asia-Pacific
- China
- India
- Japan
- South Korea
- Singapore
- Malaysia
- Australia
- Rest of Asia-Pacific
- Middle East and Africa
- Middle East
- United Arab Emirates
- Saudi Arabia
- Turkey
- Rest of Middle East
- Africa
- South Africa
- Nigeria
- Egypt
- Rest of Africa
- Middle East
- North America
Data Sources, Market Sizing, and Validation
Desk Research
Desk research was used to set the base demand logic and to keep assumptions anchored to measurable signals that can be tracked each year. We referenced public and official sources such as telecom and spectrum releases from regulators, standards and technical publications from bodies such as IEEE and ISO, health and safety references from agencies such as the FDA and CDC, and research literature indexed through open academic repositories.
On the commercial side, we also reviewed company annual reports, investor presentations, patent filings, and peer-reviewed journals on nanosensors and nano-communication, alongside reputed press coverage on pilots and deployments. Where helpful, paid subscriptions were used for company financials and news intelligence, and for patent search workflows to map activity levels and technology directions. The desk sources listed above are illustrative only, and many other references were also used for data collection, validation, and clarification.
Primary Interviews and Surveys
Primary work was carried out through expert interviews and structured surveys with component providers, system integrators, researchers, and buyers involved in healthcare, logistics, defense, manufacturing, and energy use cases across major regions. Respondent input was used to confirm what is commercially deployed versus still in lab-scale trials, and to tighten price ranges, adoption timing, and the practical role of connectivity options by geography.
Distribution of primary research fieldwork respondents
| Company type | Respondent position | Region |
|---|---|---|
| Top tier: 36% | CXOs: 15% | APAC: 48% |
| Mid tier: 46% | Functional/Unit leaders: 33% | EMEA: 33% |
| Smaller Players: 18% | Managers: 52% | Americas: 19% |
Market-Sizing & Forecasting
Sizing was built using a mix of top-down and bottom-up checks so the totals remain explainable and tied to real adoption signals. The top-down approach reconstructs the addressable spend by mapping IoNT penetration into priority end-use workflows, then translating it into a spend pool using typical deployment intensity and replacement cycles. Those totals are then corroborated using selective bottom-up approximations, such as sampled supplier revenue ranges, program-level channel checks, and volume times ASP builds for commonly deployed nano-sensing nodes.
Key inputs used in the model include the pace of nanosensor and nano-actuator commercialization, the share of pilot programs moving into paid deployments, the communication technology mix (for example, electromagnetic versus molecular communication where relevant), typical split across hardware, software, and connectivity services, and region-wise budget appetite in defense, healthcare, and industrial monitoring. For forecasting, scenario analysis was used because this market can move in steps when pilots scale, and assumptions were stress tested using expert views on timelines and expected price progression. Where bottom-up inputs were sparse, gaps were handled by using conservative adoption ramps and keeping implied spend per deployment aligned with interview-confirmed ranges.
Data Validation & Update Cycle
Validation was done through repeated variance checks across independent signals, and then reviewed in a clear step-by-step analyst workflow before numbers were finalized. We compared outputs against component mix expectations, implied deployment volumes, and the reasonableness of region splits, and re-worked any outliers until the math and narrative aligned.
When a large swing was seen, respondents were re-contacted to confirm whether it came from pricing, timing, or scope interpretation, then assumptions were updated and logged. Reports are refreshed annually, with interim updates triggered by material events such as a regulatory change, a large deployment announcement, or a step change in manufacturing readiness. Before delivery, an analyst performs a fresh pass so clients receive the latest updated view.
Mordor Intelligence's Internet of Nano Things Market Size Versus Other Published Estimates
Published market sizes for IoNT often vary because the space is still early stage, and different studies mix research prototypes with commercial deployments, or count adjacent nano-enabled categories that are not always connected. Differences also come from how each publisher treats service revenue, how quickly ASPs are assumed to fall, and which regions are treated as active demand today versus future potential.
Standalone nanosensors and nanomaterials that are sold without a connected networking use case sit outside Mordor Intelligence's scope, which can pull some published totals upward even for the same year. Another recurring gap is the use of aggressive uptake curves for smart infrastructure scenarios without checking whether deployments have moved beyond pilots, and that can shift the market value materially.
Benchmark comparison
| Source | Market Size | Gaps in Research Methodology |
|---|---|---|
| Mordor Intelligence | USD 28.70 B (2026) | |
| Global Consultancy A | USD 11.10 B (2025) | Uses an earlier base year and a narrower near-term demand pool focused on currently priced deployments, which can understate later-stage scale up that appears in subsequent years. |
| Industry Publisher B | USD 14.70 B (2026) | Applies a faster adoption curve and broader industry mapping, which can pull in adjacent nano-enabled solutions and higher service attach assumptions, thereby inflating totals versus a connected IoNT-only spend view. |
Taken together, the spread mainly comes from what is counted as IoNT-ready spend, plus how quickly pilots are converted into recurring deployments and services. By keeping the model tied to observable deployment signals, component mix, and interview-checked pricing ranges, the resulting number stays traceable to clear inputs and can be repeated when new evidence appears.


Key Questions Answered in the Report
How big is the Internet Of Nano Things Market?
The Internet Of Nano Things Market size is expected to reach USD 28.7 billion in 2026 and grow at a CAGR of 24.85% to reach USD 87.06 billion by 2031.
What is the current value of the Internet of Nano Things market?
The market generated USD 28.7 billion in 2026 and is forecast to reach USD 87.06 billion by 2031.
Which segment is growing fastest within the Internet of Nano Things market?
Smart cities and infrastructure lead growth, advancing at a projected 27.05% CAGR through 2031.
Why are hybrid deployment models gaining traction?
They balance the need for real-time edge processing with cloud-based analytics, delivering low latency while meeting data-sovereignty rules.
Which region will see the highest growth?
Asia-Pacific is expected to expand at 27.62% CAGR due to strong Industry 4.0 investment and robust 5G infrastructure.
What is the primary security challenge for nanosensor networks?
Resource-constrained devices struggle to run robust encryption, exposing them to data-privacy and cyber-attack risks.
How are material innovations influencing the market?
Breakthroughs such as rare-earth-free magnets and carbon-nanotube thermal interfaces reduce cost and improve performance, accelerating commercial adoption in multiple sectors.
Page last updated on:


