
International Payments Market Size and Share
Market Overview
| Study Period | 2020 - 2031 |
|---|---|
| Market Size (2026) | USD 222.43 Trillion |
| Market Size (2031) | USD 303.46 Trillion |
| Growth Rate (2026 - 2031) | 6.41 % |
| Fastest Growing Market | Asia-Pacific |
| Largest Market | Europe |
| Market Concentration | High |
Major Players *Disclaimer: Major Players sorted in no particular order Image © Mordor Intelligence. Reuse requires attribution under CC BY 4.0. | |
International Payments Market Analysis by Mordor Intelligence
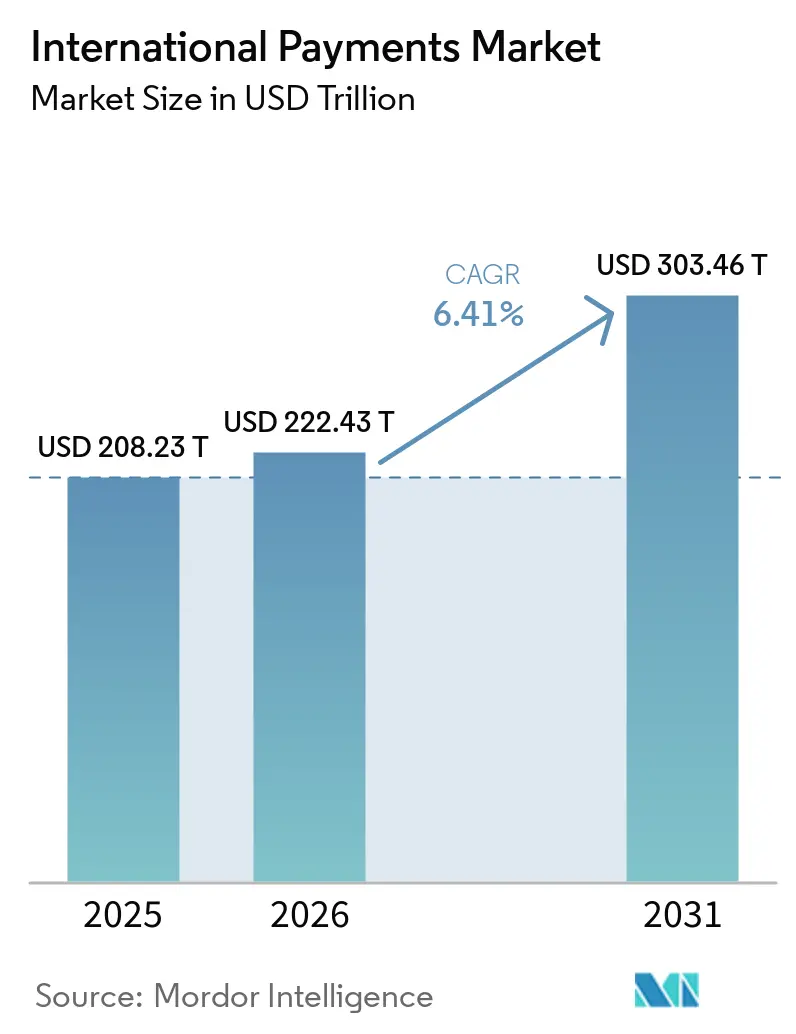
The international payments market size was valued at USD 208.2 trillion in 2025 and is estimated to grow from USD 222.4 trillion in 2026 to reach USD 303.5 trillion by 2031, at a CAGR of 6.4% during the forecast period (2026-2031). The international payments market is being reshaped by the move from batch processing through correspondent banks toward real-time, API-based settlement. SWIFT recorded its fastest traffic growth in 15 years during 2025, when FIN messages exceeded 13.4 billion and daily traffic reached 68 million messages. The November 2025 migration to ISO 20022 gave payment providers richer data that can support screening, pricing, and reconciliation. Yet users have not received all the expected benefits because global remittance costs rose to 4% in 2025, compared with 3.2% in 2023. This gap leaves room for providers that can reduce friction while giving customers clear foreign exchange pricing and payment status.
Key Report Takeaways
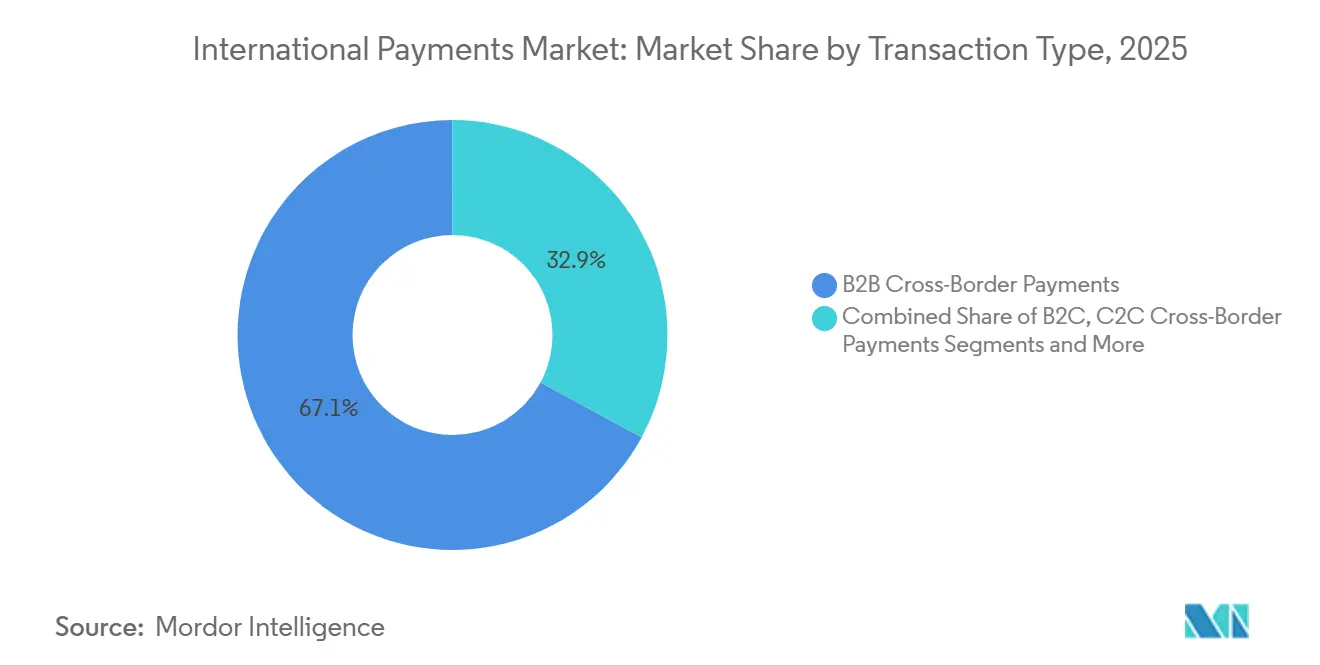
- By transaction type, B2B cross-border payments held 67.1% of the international payments market share in 2025, while C2B cross-border payments are forecast to record the highest CAGR of 9.8% through 2031.
- By payment method, bank transfers accounted for 56.6% of the international payments market share in 2025, while real-time payments and account-to-account transfers are expected to grow at an 11.3% CAGR through 2031.
- By end user, large enterprises held 41.7% of the international payments market share in 2025, while SMEs are projected to expand at a 10.4% CAGR through 2031.
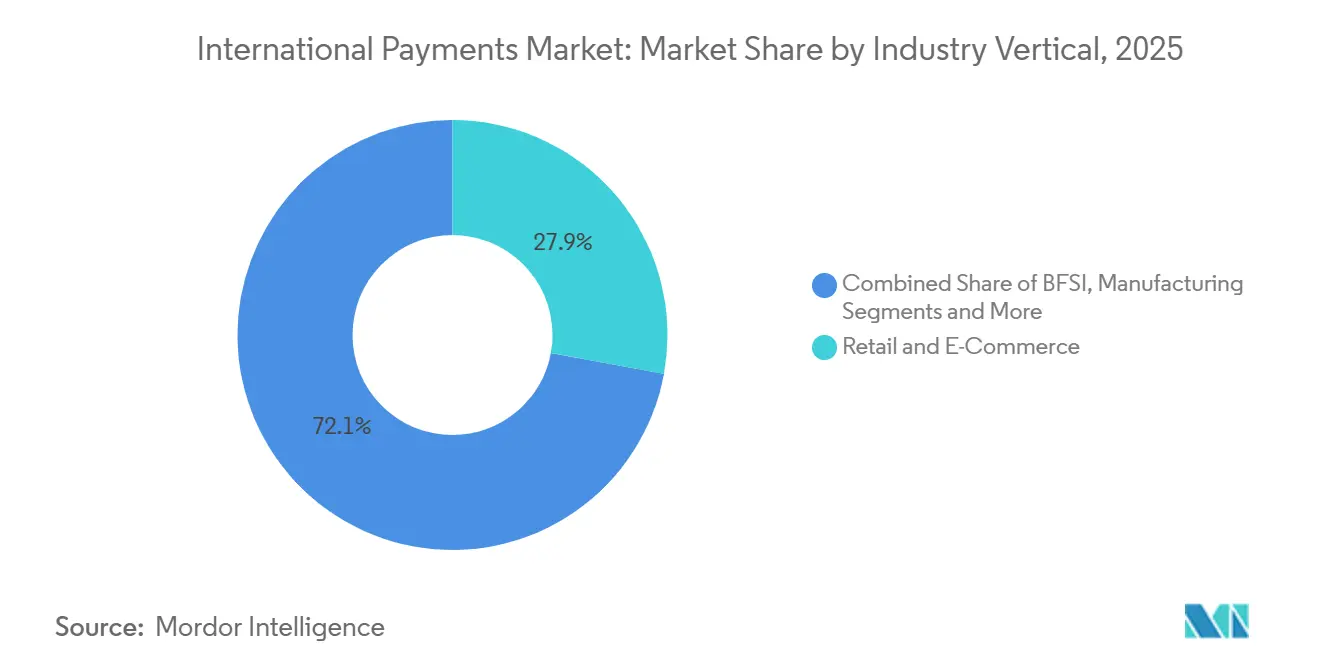
- By industry vertical, retail and e-commerce held 27.9% of the international payments market share in 2025 and is also the fastest-growing vertical through 2031.
- By geography, Europe held 31.6% of the international payments market share in 2025, while Asia-Pacific is forecast to grow at an 8.9% CAGR through 2031.
Note: Market size and forecast figures in this report are generated using Mordor Intelligence’s proprietary estimation framework, updated with the latest available data and insights as of January 2026.
Global International Payments Market Trends and Insights
Drivers Impact Analysis*
| Driver | (~) % Impact on CAGR Forecast | Geographic Relevance | Impact Timeline |
|---|---|---|---|
| Real-Time Cross-Border Payment Demand in Trade and Commerce | +1.8% | Global, concentrated in Asia-Pacific, Europe, and North America | Short term (≤ 2 years) |
| Embedded Payments in Digital Commerce Ecosystems | +0.9% | Global, led by Asia-Pacific and North America | Medium term (2-4 years) |
| Demand for Cost Transparency, FX Visibility, and Traceability | +0.7% | Global, especially high-volume corridors in North America and Europe | Medium term (2-4 years) |
| API-Enabled Infrastructure and Alternative Settlement Networks | +0.8% | Global, with early adoption in Asia-Pacific and Europe | Medium term (2-4 years) |
| Cross-Border Payouts for Global Workforces and Creators | +0.6% | Asia-Pacific, with spillover to Middle East and Africa and South America | Medium term (2-4 years) |
| Enterprise Multi-Currency Treasury and Liquidity Solutions | +0.5% | North America, Europe, Singapore, and Hong Kong | Long term (≥ 4 years) |
| Source: Mordor Intelligence | |||
Real-Time Cross-Border Payment Demand Reshapes Trade Settlement
Demand for near-instant settlement has moved beyond consumer remittances and into trade finance. The international payments market is responding to this demand with linked instant-payment systems. More than 80 countries had deployed domestic fast-payment systems, and cross-border links between those systems exceeded 500 in 2025. The European Central Bank found that linking fast-payment systems can increase bilateral trade by 4%[1]European Central Bank, “Unlocking Trade Potential: The Benefits of Improving Cross-Border Payments,” ECB Economic Bulletin, ecb.europa.eu. SWIFT reported that 80% of cross-border payment travel time occurs after a payment leaves its network, during processing by the beneficiary institution. Bank of America announced in June 2026 a real-time solution that connects SPEI in Mexico, Faster Payments in the United Kingdom, and UPI in India, showing why last-mile interoperability has become a central area of competition.
Embedded International Payments Deepen in Digital Commerce
The integration of cross-border payments into software platforms, marketplaces, and SaaS tools is widening the group of firms that compete for transaction revenue. Worldpay reported broad embedded-finance adoption among global e-commerce merchants in 2026, with more merchants using platform-native payment layers instead of separate gateways. This model allows platforms to retain foreign exchange income, float, and transaction data that formerly stayed with specialist payment providers. The international payments market is thus becoming more dependent on software distribution and local acquiring capabilities. Providers are building services that combine account holding, acquiring, and foreign exchange conversion in one API layer. Merchants need localized methods, currencies, and payment confirmation when they sell across borders.
Cost Transparency and FX Visibility Drive Competitive Differentiation
Cost visibility remains a material concern for companies and consumers sending funds across borders, and the international payments market is under pressure to make each charge visible before funds are sent. Nearly one-third of cross-border payments cost more than 3% of the transaction value, and only 40% of international B2B transactions settled within 1 working day in April 2025. The Financial Stability Board reported that remittance costs increased between 2023 and 2025 despite the broader modernization effort[2]Financial Stability Board, “Recommendations for Regulating and Supervising Bank and Non-Bank Payment Service Providers Offering Cross-Border Payment Services,” Financial Stability Board, fsb.org. Foreign exchange margins remain an important element of end-user cost, especially where the stated transaction fee is low. The international payments market rewards providers that show rates, fees, and delivery timing before a customer initiates a payment. Better transparency can improve SME cash-flow planning, and it helps explain why customers move activity away from established banks when alternatives show clearer rates.
API-Enabled Infrastructure and Alternative Settlement Networks
The international payments market is moving from correspondence-only models toward platforms that combine application programming interfaces, local payment rails, and alternative settlement options. Wise processed USD 243.5 billion in cross-border volume in fiscal year 2026, up 31% year on year, and reported net revenue of USD 2.5 billion. These results indicate the operating value of direct infrastructure rather than a model based only on payment routing. The international payments market will still require bank-grade controls because alternative settlement does not remove obligations related to customer identification, screening, and dispute management. Providers that integrate these controls into their APIs can serve both banks and nonbank clients without requiring them to build a separate compliance layer.
Restraints Impact Analysis*
| Restraint | (~) % Impact on CAGR Forecast | Geographic Relevance | Impact Timeline |
|---|---|---|---|
| Fragmented Global Regulatory and Compliance Frameworks | -0.8% | Global, most acute in Middle East and Africa, Asia-Pacific corridor countries, and cross-Atlantic flows | Long term (≥ 4 years) |
| Foreign Exchange Volatility and Pricing Pressure | -0.7% | Global, intensified in emerging markets and tariff-affected corridors | Medium term (2-4 years) |
| Fraud, AML, and Sanctions Compliance Risks | -0.6% | Global, with high compliance burdens in the EU, United States, and correspondent corridors | Medium term (2-4 years) |
| Legacy Correspondent Banking Dependence in Certain Corridors | -0.5% | Middle East and Africa, Pacific Island countries, and selected South American corridors | Long term (≥ 4 years) |
| Source: Mordor Intelligence | |||
Fragmented Global Regulatory and Compliance Frameworks
Fragmented regulation remains a persistent constraint on the international payments market because each corridor can involve separate licensing, data, and conduct rules. The Financial Stability Board issued recommendations in December 2024 for a more consistent approach to regulating bank and nonbank providers, but national adoption schedules continue to differ. Japan’s amended Payments Settlement Act took effect in 2026 and treats some cross-border collection agency services as foreign exchange transactions that require money transfer registration. The EU Instant Payments Regulation offers a more common rulebook, although its receiving mandate for several non-eurozone countries began only on April 9, 2026. Large banks can spread legal and systems costs across more corridors, while smaller providers face a higher cost per transaction. This difference can slow entry in lower-volume routes even where there is clear demand for faster payments.
Escalating Fraud, AML, and Sanctions Compliance Risks
Financial crime exposure grows as cross-border payment volume rises and settlement cycles become shorter. SWIFT tested artificial intelligence and privacy-enhancing technologies with 13 global banks using 10 million test transactions in 2025, and found collaborative detection models were twice as effective as approaches run by a single institution. The Financial Action Task Force revised its standards in June 2025 to require stronger originator and beneficiary information for certain transfers above USD 1,000 or EUR 1,000. The EU instant-payments framework restricts transaction-level sanctions screening for covered instant transfers because repeated screening could slow the payment. Institutions must instead strengthen customer screening and monitoring before funds move. This raises onboarding costs and can exclude smaller businesses or underbanked customers when providers cannot assess risk efficiently.
*Our forecasts treat driver/restraint impacts as directional, not additive. The impact forecasts reflect baseline growth, mix effects, and variable interactions.
Segment Analysis
By Transaction Type: B2B Retains Volume Leadership as C2B Expands
B2B cross-border payments accounted for 67.1% of the international payments market share in 2025, making it the core transaction type for trade settlement, supply-chain finance, and corporate treasury activity. This part of the international payments market remains central to global trade operations. Large enterprises and financial institutions continue to use bank-led correspondent networks for high-value transfers where controls and credit arrangements matter. The international payments industry still relies on this structure because direct account relationships remain valuable. Smaller businesses are shifting more quickly to providers that offer local account details, direct payment-system access, transparent foreign exchange pricing, and simpler reconciliation.
C2B cross-border payments are forecast to be the fastest-growing transaction type, with a 9.8% CAGR from 2026 to 2031. Its growth comes from consumers in Asia-Pacific and South America purchasing digital services and goods from merchants in Europe and North America. Cross-border UPI transactions rose 20-fold to more than 755,000 in India’s fiscal year 2025 and reached 601,000 during the first 4 months of fiscal year 2026. By then, India had expanded UPI acceptance to 7 countries. B2C supports e-commerce and international payroll, while C2C remains important for remittances and may be an early setting for stablecoin use.


By Payment Method: Bank Transfers Lead While Real-Time Rails Gain Ground
Bank transfers held 56.6% of the international payments market share in 2025, reflecting their role in wholesale, interbank, and corporate settlement. Correspondent banking remains important for high-value payments where participants need established credit and liquidity arrangements. Cards and digital wallets remain important for C2B and C2C activity, while local acquiring and wallet integrations reduce dependence on a single card network.
Real-time payments and account-to-account transfers are projected to grow at an 11.3% CAGR through 2031, the highest rate among the payment methods. Their expansion changes the service mix within the international payments market. Their use is supported by regulation and demand for immediate confirmation. SEPA Instant Credit Transfer volumes rose from 16% of credit transfers in the second half of 2024 to 35% in the first quarter of 2026[3]Société Générale, “Instant Payments in Europe: Who to Take Inspiration From,” Société Générale Wholesale Banking, wholesale.banking.societegenerale.com. Lower infrastructure charges place pressure on revenue per payment. Incumbents must invest in the new rails while revising pricing models that were designed for slower processes.
By End User: Large Enterprises Lead While SMEs Gain Access
Large enterprises held 41.7% of the international payments market share in 2025 because they manage high-value trade, hedging, and multi-currency treasury requirements. They remain important customers across the international payments market. They can use dedicated treasury systems and bank relationships to obtain specialized pricing and operational support. Kyriba serves more than 4,000 multinationals and partnered with Merge in July 2026 to connect treasury customers to regulated stablecoin payment infrastructure[4]Kyriba, “Kyriba & Merge: Regulated Stablecoin Payments for Treasury,” Kyriba, kyriba.com. Financial institutions also generate substantial volume through correspondent banking, funds, insurance, and other institutional activities.
SMEs are projected to grow at a 10.4% CAGR through 2031 and represent an increasingly important commercial group. Mastercard expects SME cross-border payment value to increase 54% from USD 13.8 trillion in 2024 to USD 21.2 trillion by 2032. India’s Payment Aggregator Cross-Border licensing has supported activity in South Asia, where MSME exports rose from USD 43.9 billion in fiscal year 2021 to USD 137.6 billion in fiscal year 2025. The number of MSME exporters more than tripled over the same period. Fintech providers compete by offering local accounts, direct payment access, foreign exchange visibility, and faster settlement without requiring multiple banks.
By Industry Vertical: Retail and E-Commerce Combines Scale and Growth
Retail and e-commerce accounted for 27.9% of the international payments market share in 2025 and will maintain strong growth momentum through 2031. This vertical touches consumer purchases, merchant payouts, wallets, cards, and account-to-account transfers across many countries. The international payments market benefits when merchants add payment methods that fit customer preferences in each country. Local currency presentation, payment confirmation, and wallet connections remain practical requirements for cross-border checkout.
BFSI generates large volumes from interbank settlement, insurance payouts, and asset management, although revenue pools face fee pressure. Manufacturing demand is linked to supply chains and foreign exchange hedging when tariff measures affect currencies. Reuters reported in April 2025 that U.S. multinationals extended currency hedges in response to tariff-related volatility. IT and telecommunications create frequent, lower-value flows from SaaS subscriptions, API fees, and cloud services. Travel, hospitality, and media add needs through wallet payments, content licensing, streaming, and creator payouts.
Geography Analysis
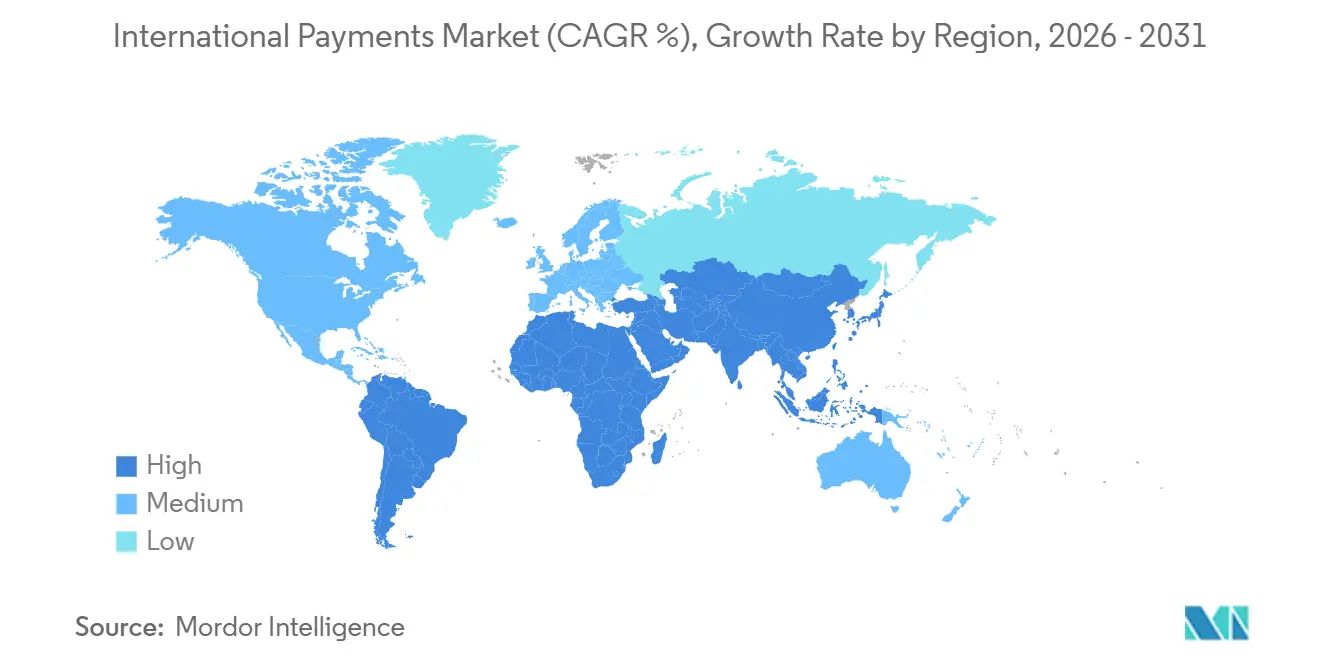
Europe held 31.6% of the international payments market share in 2025, supported by SEPA, intra-regional trade, and established wholesale hubs in the United Kingdom, Germany, and France. SEPA Instant Credit Transfer represented 35% of total credit transfers in the first quarter of 2026. Wero and national account-to-account systems such as Bizum, Blik, and Bancomat are strengthening domestic-first options for retail flows. The international payments market in Europe is moving toward closer interoperability between instant-payment systems. EU rules will also affect how nonbank providers build compliance and settlement operations across the region.
North America generates the second-largest share of international payment flows, with the United States remaining central to USD settlement for corporate and consumer transfers. The USD accounted for more than 50% of SWIFT international payment value in 2025, its highest share since SWIFT changed its methodology in mid-2023. Canada’s planned real-time system could create a domestic rail that later supports connections to the United States. Mexico’s SPEI system has strategic importance for corporate and remittance payments along the U.S.-Mexico corridor. Bank of America’s June 2026 announcement connected this corridor to other fast-payment systems. South America has a smaller absolute role, but Brazil’s Pix provides a large domestic base for potential bilateral links with trade partners. The international payments market can grow where mature domestic systems gain practical cross-border interoperability.
Asia-Pacific is forecast to grow at an 8.9% CAGR through 2031, giving the region the fastest expansion among geographic areas in the international payments market. Its domestic payment links give the international payments market a wider base for regional connectivity. Retail cross-border outflows from the region reached USD 13.5 trillion in 2025 and are forecast to reach USD 24 trillion by 2033. China’s CIPS processed CNY 175.49 trillion, equivalent to USD 24.45 trillion, in 2024 and expanded its participant institutions to 1,683 by May 2025, while India’s UPI-Singapore PayNow link supports remittances, merchant payments, and travel spending. Africa’s payment traffic grew by more than 8% annually on average between 2018 and 2024, with the United Arab Emirates and Saudi Arabia acting as important hubs for South Asia remittances and intra-GCC corporate flows.

Competitive Landscape
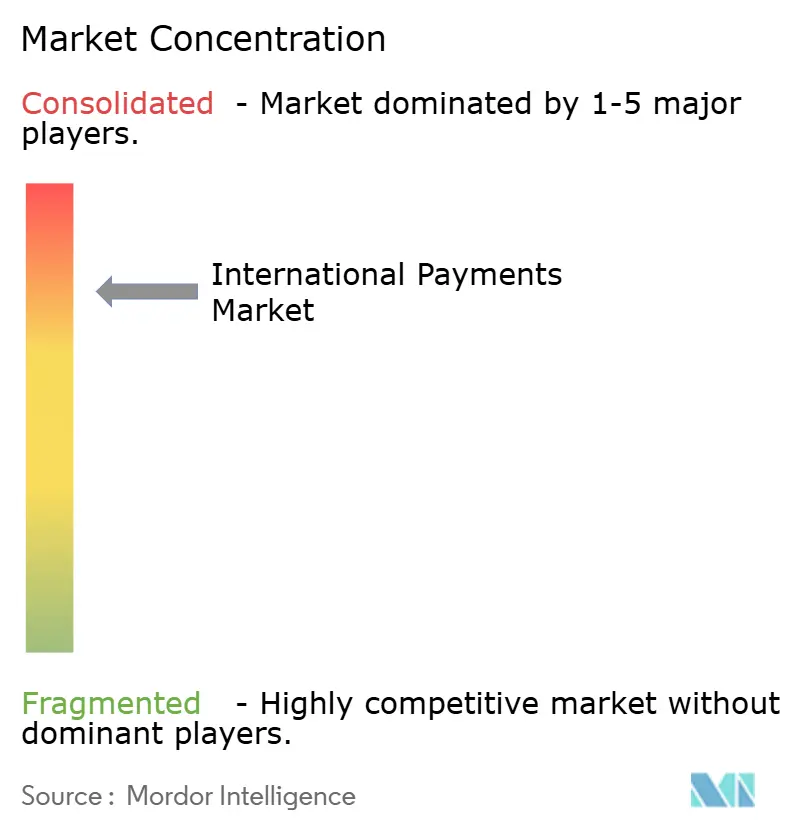
The international payments market is moderately concentrated in wholesale banking and fragmented in retail and SME services. JPMorgan Chase, Citi, HSBC, BNY Mellon, and Standard Chartered have established roles in high-value corporate and institutional flows through correspondent networks and treasury services. Visa and Mastercard continue to control important consumer-facing card and payout rails used in C2B and C2C transactions. ISO 20022 is now a baseline capability because more than 97% of SWIFT messages had migrated to the standard in 2025, shifting competition toward services built on that data, including sanctions screening, foreign exchange pricing, and automated reconciliation. Citi launched 24/7 USD Clearing with Citi Token Services in July 2026, enabling near-real-time cross-border USD settlement for Siam Commercial Bank.
Fintech competitors focus most directly on SMEs and mid-sized corporates that want account access, local payment connections, and visible pricing through one interface. Airwallex had nearly 90 regulatory licenses across 50 markets and direct local-network connections in more than 120 countries in 2026. Wise’s fiscal 2026 results showed 31% growth in cross-border volume, and its April 2026 Capitec partnership extended instant cross-border payment capabilities to a large South African bank customer base. Visa and UnionPay International agreed in February 2026 to enable money movement to the Chinese Mainland through Visa Direct. These moves show that competitive positions depend both on consumer reach and on access to regulated domestic payment infrastructure.
The strongest opportunity areas remain regulated stablecoin settlement for treasury activity, bank-to-wallet instant payments, and API-based foreign exchange hedging for smaller companies, especially where correspondent-banking access has declined, or wallet use has outpaced bank interoperability. Ant International, Standard Chartered, and SWIFT started production trials in August 2025 for a bank-to-wallet ISO 20022 payment service through Alipay+. Nium and Circle partnered in May 2026 to connect USDC settlement with local-currency payouts across more than 190 countries and 100 currencies. These examples show that banks, networks, and fintech firms increasingly work together where each party controls a different part of the payment chain.
International Payments Industry Leaders
Visa Inc.
Mastercard Incorporated
Western Union Holdings, Inc.
MoneyGram International, Inc.
Wise PLC
- *Disclaimer: Major Players sorted in no particular order

Recent Industry Developments
- July 2026: Citigroup Inc. and Siam Commercial Bank went live with Citi's integrated 24/7 USD Clearing and Citi Token Services solution, with SCB becoming Citi's first global financial institution client for the service. The system tokenizes deposits across Citi's network and enables near-real-time USD settlement around the clock
- June 2026: Bank of America announced a cross-border real-time payments solution for corporate, commercial, and financial institution clients, connecting to SPEI in Mexico, Faster Payments in the United Kingdom, and UPI in India. The service supports high-volume, low-value international payments through SWIFT or CashPro APIs
- May 2026: Nium (payments infrastructure) and Circle (stablecoin platform) partnered to connect USDC stablecoin settlement with last-mile payouts in more than 190 countries across 100 currencies.
- April 2026: Wise Platform entered South Africa through a partnership with Capitec, extending instant cross-border payment capabilities to more than half of South Africa's adult population.


Global International Payments Market Report Scope
International Payments Market is the global ecosystem that enables individuals, businesses, and financial institutions to transfer, receive, and settle funds across national borders, encompassing remittances, cross-border e-commerce, international trade payments, corporate transfers, and other transactions through banks, card networks, payment processors, fintechs, and digital payment platforms.
The International Payments Market is segmented by Transaction Type (B2B Cross-Border Payments and More), Payment Method (Bank Transfers, Cards, and More), End User (Large Enterprises, SMEs, Financial Institutions, Consumers), Industry Vertical (Retail/E-Commerce, BFSI, Manufacturing, and More), and Geography (North America, South America, Europe, APAC, MEA). The Market Forecasts are Provided in Terms of Value (USD).
| B2B Cross-Border Payments |
| B2C Cross-Border Payments |
| C2C Cross-Border Payments |
| C2B Cross-Border Payments |
| Bank Transfers |
| Cards |
| Digital Wallets |
| Real-Time Payments and Account-to-Account Payments |
| Other Payment Methods |
| Large Enterprises |
| Small and Medium Enterprises |
| Financial Institutions |
| Individual Consumers |
| Retail and E-Commerce |
| BFSI |
| Manufacturing |
| IT and Telecommunications |
| Travel and Hospitality |
| Media and Entertainment |
| Other Industry Verticals |
| North America | United States |
| Canada | |
| Mexico | |
| South America | Brazil |
| Argentina | |
| Rest of South America | |
| Europe | United Kingdom |
| Germany | |
| France | |
| Italy | |
| Spain | |
| Rest of Europe | |
| Asia-Pacific | China |
| Japan | |
| India | |
| South Korea | |
| Australia | |
| Indonesia | |
| Thailand | |
| Malaysia | |
| Singapore | |
| Vietnam | |
| Rest of Asia-Pacific | |
| Middle East and Africa | Saudi Arabia |
| United Arab Emirates | |
| Turkey | |
| South Africa | |
| Egypt | |
| Rest of Middle East and Africa |
| By Transaction Type | B2B Cross-Border Payments | |
| B2C Cross-Border Payments | ||
| C2C Cross-Border Payments | ||
| C2B Cross-Border Payments | ||
| By Payment Method | Bank Transfers | |
| Cards | ||
| Digital Wallets | ||
| Real-Time Payments and Account-to-Account Payments | ||
| Other Payment Methods | ||
| By End User | Large Enterprises | |
| Small and Medium Enterprises | ||
| Financial Institutions | ||
| Individual Consumers | ||
| By Industry Vertical | Retail and E-Commerce | |
| BFSI | ||
| Manufacturing | ||
| IT and Telecommunications | ||
| Travel and Hospitality | ||
| Media and Entertainment | ||
| Other Industry Verticals | ||
| By Geography | North America | United States |
| Canada | ||
| Mexico | ||
| South America | Brazil | |
| Argentina | ||
| Rest of South America | ||
| Europe | United Kingdom | |
| Germany | ||
| France | ||
| Italy | ||
| Spain | ||
| Rest of Europe | ||
| Asia-Pacific | China | |
| Japan | ||
| India | ||
| South Korea | ||
| Australia | ||
| Indonesia | ||
| Thailand | ||
| Malaysia | ||
| Singapore | ||
| Vietnam | ||
| Rest of Asia-Pacific | ||
| Middle East and Africa | Saudi Arabia | |
| United Arab Emirates | ||
| Turkey | ||
| South Africa | ||
| Egypt | ||
| Rest of Middle East and Africa | ||


Key Questions Answered in the Report
What is driving growth in international payments?
Real-time settlement demand, embedded payment services, local payment methods, and stronger foreign exchange visibility are expanding usage across trade and digital commerce.
How large is the international payments market?
It is estimated at USD 222.4 trillion in 2026 and is forecast to reach USD 303.5 trillion by 2031 at a 6.4% CAGR.
Which transaction type leads cross-border payment activity?
B2B led with a 67.1% share in 2025 because trade settlement, supply-chain finance, and corporate treasury create substantial payment volume.
Which payment method is growing fastest?
Real-time payments and account-to-account transfers are forecast to grow at an 11.3% CAGR through 2031.
Why are SMEs changing cross-border payment providers?
SMEs seek clearer foreign exchange pricing, quicker settlement, local account access, and simpler payment management across countries.
Which region is growing fastest for international payment services?
Asia-Pacific is forecast to grow at an 8.9% CAGR through 2031, supported by instant-payment links, mobile wallets, and expanding.
Page last updated on:





