
Intermodal Container Drayage Market Size and Share
Market Overview
| Study Period | 2020 - 2031 |
|---|---|
| Market Size (2026) | USD 141.85 Billion |
| Market Size (2031) | USD 180.35 Billion |
| Growth Rate (2026 - 2031) | 4.92 % |
| Fastest Growing Market | Asia-Pacific |
| Largest Market | North America |
| Market Concentration | Low |
Major Players *Disclaimer: Major Players sorted in no particular order Image © Mordor Intelligence. Reuse requires attribution under CC BY 4.0. | |
Intermodal Container Drayage Market Analysis by Mordor Intelligence
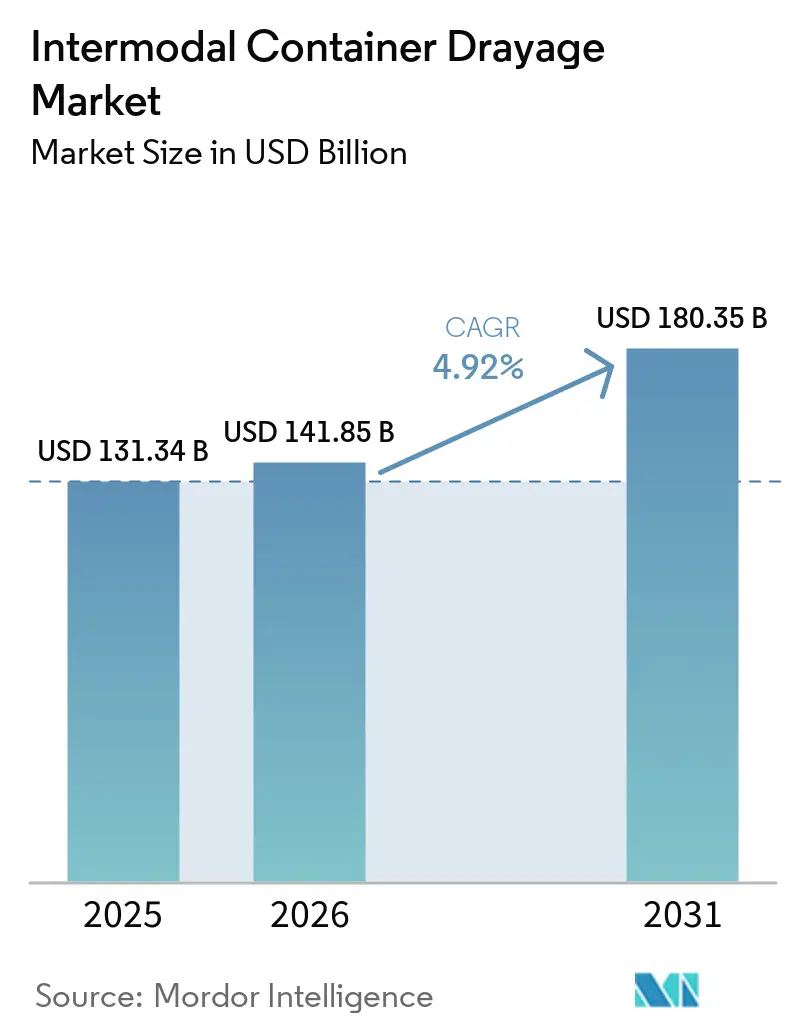
The intermodal container drayage market size was valued at USD 131.34 billion in 2025 and is estimated to grow from USD 141.85 billion in 2026 to reach USD 180.35 billion by 2031, at a CAGR of 4.92% during the forecast period from 2026 to 2031.
Rising truckload rates and diesel costs are encouraging shippers to move suitable highway freight onto rail. This shift increases the need for drayage at both port gates and inland rail ramps. J.B. Hunt reported 10% growth in intermodal volume during Q2 2026, while its Eastern network loads rose 16%, which the company linked to freight conversion rather than underlying demand growth. The intermodal container drayage market, therefore, depends on the availability of trucks, drivers, and chassis for the first and final legs of a rail move. Carriers are responding through owned capacity, visibility tools, and lower-emission fleet investments, while cross-border and temperature-controlled operations create room for specialized providers.
Key Report Takeaways
- By service type, port drayage held 31.80% of the intermodal container drayage market share in 2025, while expedited drayage is projected to record the highest CAGR at 6.72% through 2031.
- By container type, dry containers accounted for 73.60% of the intermodal container drayage market size in 2025, while refrigerated containers are forecast to expand at a 6.35% CAGR through 2031.
- By distance, short haul accounted for 61.70% of the intermodal container drayage market share in 2025, while long haul is forecast to register at a 6.58% CAGR through 2031.
- By end user industry, wholesale and retail trade accounted for 30.70% of the intermodal container drayage market size in 2025 and is forecast to register at a 6.39% CAGR through 2031
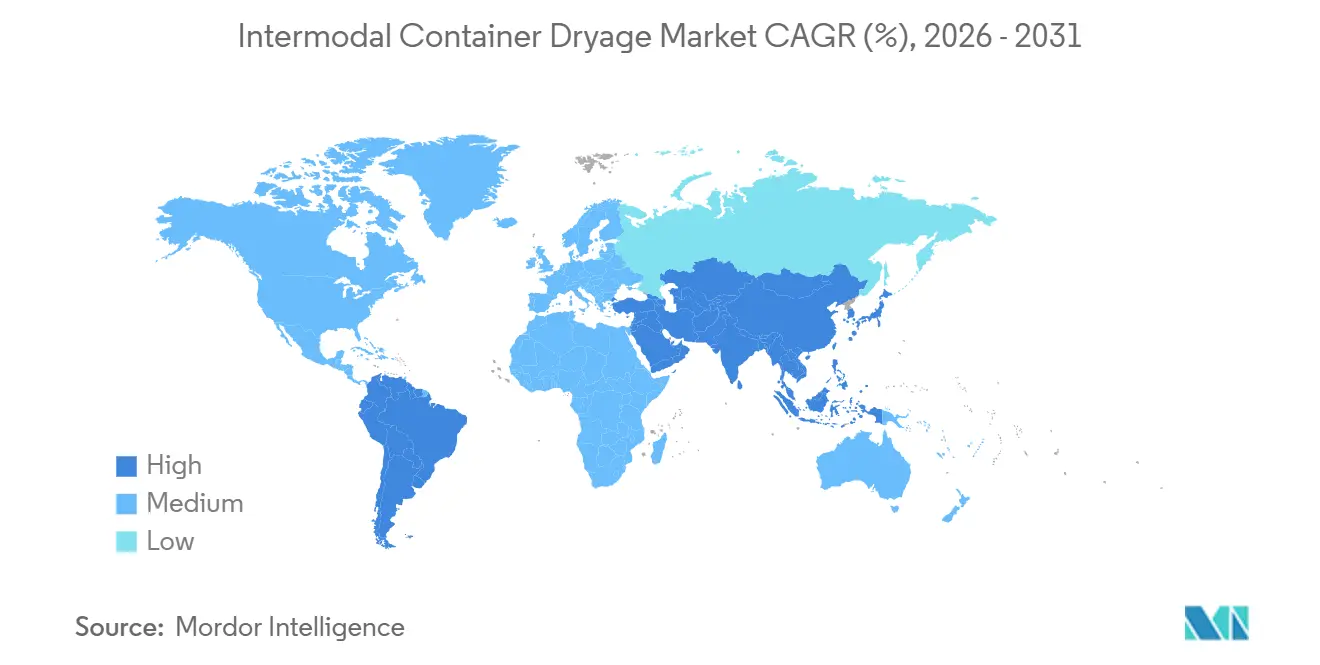
- By geography, North America held 25.30% of the intermodal container drayage market size in 2025, while Asia-Pacific is forecast to grow at a 6.83% CAGR through 2031.
Note: Market size and forecast figures in this report are generated using Mordor Intelligence’s proprietary estimation framework, updated with the latest available data and insights as of January 2026.
Global Intermodal Container Drayage Market Trends and Insights
Drivers Impact Analysis*
| Driver | (~) % Impact on CAGR Forecast | Geographic Relevance | Impact Timeline |
|---|---|---|---|
| Growth in Containerized Trade and Intermodal Freight Volumes | +1.4% | Global, with concentrated gains in North America and the Asia-Pacific core markets | Medium term (2-4 years) |
| E-Commerce and Omnichannel Fulfillment Requirements | +0.9% | North America, Asia-Pacific, and Europe, with spillover to Southeast Asia, the Middle East, and Africa | Short term (≤ 2 years) |
| Port, Rail Ramp, and Inland Terminal Modernization | +0.7% | North America, Asia-Pacific, and European hubs, including Rotterdam, Hamburg, and Antwerp | Medium term (2-4 years) |
| Nearshoring and Cross-Border Manufacturing Corridors | +0.8% | North America, Asia-Pacific, and Eastern Europe | Long term (≥ 4 years) |
| Digital Appointment, Visibility, and Freight-Matching Adoption | +0.4% | Global, led by North America and mature European markets | Short term (≤ 2 years) |
| Corridor-Level Electrification and Low-Emission Fleet Deployment | +0.3% | California, Europe, the Gulf Coast, and early-adoption markets in the Asia-Pacific | Long term (≥ 4 years) |
| Source: Mordor Intelligence | |||
Growth in Containerized Trade and Intermodal Freight Volumes
Containerized freight provides the base demand for the Intermodal container drayage market because every rail or port container needs local truck movement. C.H. Robinson reported that North American intermodal volumes were 10% above the 5-year average in early Q2 2026[1]C.H. Robinson, “Intermodal and U.S. Ports Freight Market Update, July 2026,” C.H. Robinson, July 2026, chrobinson.com. The company also reported faster increases in West Coast outbound committed intermodal pricing. J.B. Hunt identified 7 million to 11 million potential loads that could move from highway to rail, with much of that opportunity in Eastern United States corridors. This opportunity raises truck demand at both ends of an intermodal journey, rather than only at the seaport. Each additional container movement also requires at least 2 drayage moves, which links drayage activity closely to freight volumes.
E-Commerce and Omnichannel Fulfillment Requirements
E-commerce has changed the timing and location of demand in the Intermodal container drayage market. Distribution hubs serving same-day and next-day fulfillment require shorter drayage windows than conventional warehouse networks. Retailers and logistics providers are locating regional facilities in industrial corridors near Savannah, Charleston, and the Los Angeles Basin. This approach limits the port-to-warehouse distance while retaining access to container flows. Higher port volumes can place pressure on warehousing, drayage, and less-than-truckload capacity at the same time. Inland rail ramps also gain importance when shippers divide container loads into smaller regional shipments near final consumers.
Port, Rail Ramp, and Inland Terminal Modernization
Terminal investment affects the Intermodal container drayage market by changing the time and cost required to collect or return containers. Automated gates at Los Angeles and Long Beach have improved on-dock processing, although off-dock chassis access remains a constraint. NFI Industries announced a partnership with BNSF Railway for the planned Barstow International Gateway in August 2026, where NFI set to provide drayage, transportation, warehousing, and distribution services. Inland terminals can move activity away from congested coastal locations and create additional drayage demand in interior corridors. Digital appointments and visibility systems can also reduce missed pickups and improve planning when terminal conditions change. California clean-truck requirements further shape fleet replacement decisions and terminal equipment planning.
Nearshoring and Cross-Border Manufacturing Corridors
Nearshoring is creating new freight corridors for the Intermodal container drayage market, especially between Mexico and the United States. Automotive, electronics, and consumer goods production in Mexico needs dependable truck movements between manufacturing sites, border crossings, rail terminals, and distribution centers. Hub Group stated that its Mexico intermodal volume increased 302% in Q2 2025 after its joint venture with EASO. Cross-border service requires carrier compliance, FAST program enrollment, and bilingual dispatch capability. These requirements narrow the pool of qualified providers and favor carriers with established operating networks. Marten Transport stated that tighter enforcement of non-domiciled commercial driver licenses and English-language standards affected available carrier capacity in early 2026[2]Marten Transport, “Q2 2026 Investor Presentation,” Marten Transport, July 2026, marten.com.
Restraints Impact Analysis*
| Restraint | (~) % Impact on CAGR Forecast | Geographic Relevance | Impact Timeline |
|---|---|---|---|
| Driver Shortages and Owner-Operator Capacity Attrition | -0.4% | North America, with spillover to Europe and Asia-Pacific | Medium term (2-4 years) |
| Port Congestion, Chassis Imbalances, and Terminal Dwell Time | -0.3% | North America, European ports, and selected Asia-Pacific gateways | Short term (≤ 2 years) |
| Fragmented Carrier Networks and Interoperability Gaps | -0.2% | Global, with greater pressure in South America, the Middle East, and Africa | Long term (≥ 4 years) |
| Zero-Emission Equipment Cost and Uneven Charging Infrastructure | -0.2% | California and European corridors, with broader effects as mandates expand | Long term (≥ 4 years) |
| Source: Mordor Intelligence | |||
Driver Shortages and Owner-Operator Capacity Attrition
Driver availability remains a central operational constraint for the Intermodal container drayage market. Drayage work requires terminal knowledge, TWIC credentials, chassis management, and the ability to work around detention risk. These requirements make it harder to add qualified capacity quickly. C.H. Robinson reported that enforcement changes in 2025 and 2026 reduced the supply of eligible drivers in some regional markets. J.B. Hunt, Schneider, and Knight-Swift have increased their use of in-house drayage capacity to protect service quality during tight periods. J.B. Hunt has also used pay increases, sign-on bonuses, and support for new drivers as it seeks to add capacity.
Port Congestion, Chassis Imbalances, and Terminal Dwell Time
Port congestion limits the number of trips a driver can complete and reduces the effective capacity of the Intermodal container drayage market. Chassis shortages and mismatched equipment can delay container release even when a driver and tractor are available. C.H. Robinson reported waits of 3 to 5 hours at NS Landers in Chicago during February 2026 after gate and appointment-system changed. It also reported chassis shortages and metered releases at NS Sharon in Cincinnati. A chassis split adds another handling step and can cause missed appointments and additional charges. Extended terminal dwell can remove the cost advantage of intermodal service for freight with tight delivery schedules.
*Our forecasts treat driver/restraint impacts as directional, not additive. The impact forecasts reflect baseline growth, mix effects, and variable interactions.
Segment Analysis
By Service Type: Port and Expedited Drayage Support Different Service Needs
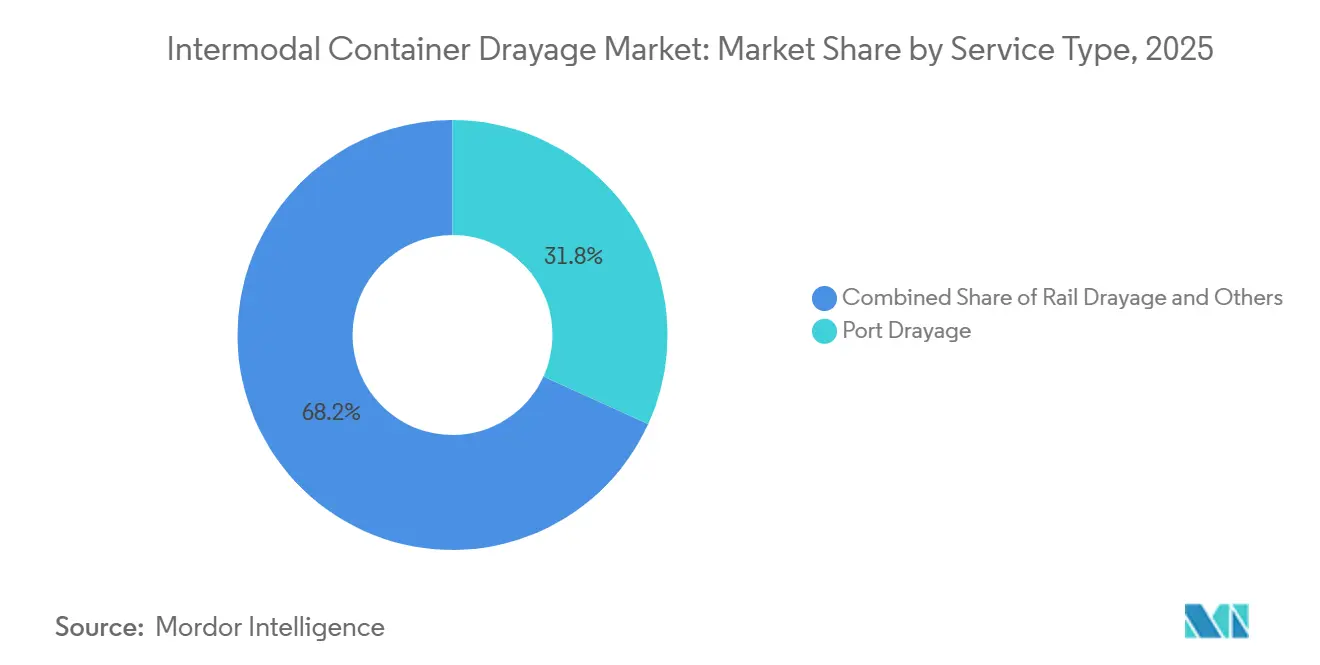
Port drayage held 31.80% of the intermodal container drayage market share in 2025. Port drayage is the largest service type because containers discharged from vessels need a truck move before entering inland supply chains. The service is tied to the activity of coastal gateways and the warehouse networks surrounding them. Rail drayage and inter-carrier drayage support movements between inland terminals and customer locations. Intra-carrier drayage supports connected carrier networks where a provider manages more of the transportation chain. The Intermodal container drayage market continues to rely on these service types because rail service cannot replace the local truck movement at either end of a shipment. Their operating results are shaped by terminal access, driver supply, chassis availability, and appointment reliability.
Expedited drayage is forecast to record a 6.72% CAGR through 2031. Expedited drayage is growing faster because shippers need more reliable timing for high-priority freight. Schneider introduced Fast Track in November 2025, combining priority rail placement, expedited drayage, control-tower management, and an asset-based recovery option. The offering shows how service providers are adapting intermodal transport for shipments that cannot tolerate long handoffs. Schneider also reported that more than 90% of its domestic dray moves were completed by company drivers in early 2026, supporting consistent execution. Shuttle drayage and door-to-door drayage serve smaller but developing requirements in distribution networks. Door-to-door service can simplify shipment coordination for customers who want one provider across local pickup, rail, and final delivery. Clean-fleet requirements remain relevant across service types because fleets working in California must plan equipment purchases around the applicable rules. The intermodal container drayage industry is consequently separating basic port services from higher-control offerings for time-sensitive freight.



By Container Type: Dry Containers Retain Scale While Reefer Demand Expands
Dry containers accounted for 73.60% of the intermodal container drayage market size in 2025, making them the largest container segment. Their scale reflects the large range of general manufacturing, retail, and industrial products moved in standard containers. Dry container activity moves with import flows and the volume of goods moving through port and rail networks. The intermodal container drayage market size for this category is supported by broad demand across many end-user groups. Standard equipment and established operating practices also make dry container services available across a wide set of corridors. Tank containers and specialized containers have smaller roles, but they serve chemical, energy, project cargo, and other freight with specific handling needs. These services need suitable equipment, carrier knowledge, and safety procedures. Their customer base is narrower, but the service requirement can make the business more durable for qualified operators.
Refrigerated containers are forecast to register at a 6.35% CAGR through 2031. Temperature-controlled freight requires equipment, monitoring, and operating procedures that differ from standard container handling. Hub Group completed its acquisition of Marten Transport Intermodal assets for USD 51.8 million in September 2025. The acquisition added 1,200 refrigerated containers and made Hub Group the second-largest provider of temperature-controlled intermodal solutions in North America. Pharmaceutical cold-chain activity through Savannah and Miami supports the need for specialized chassis and telematics monitoring. Food and beverage freight also requires dependable movement between terminals, cold storage sites, and customers. Reefer drayage is therefore becoming a more specialized service area within the intermodal container drayage market. Providers that can manage temperature, timing, and equipment availability have a clearer route to serve these shipments.
By Distance: Short Haul Holds Volume While Long Haul Grows Faster
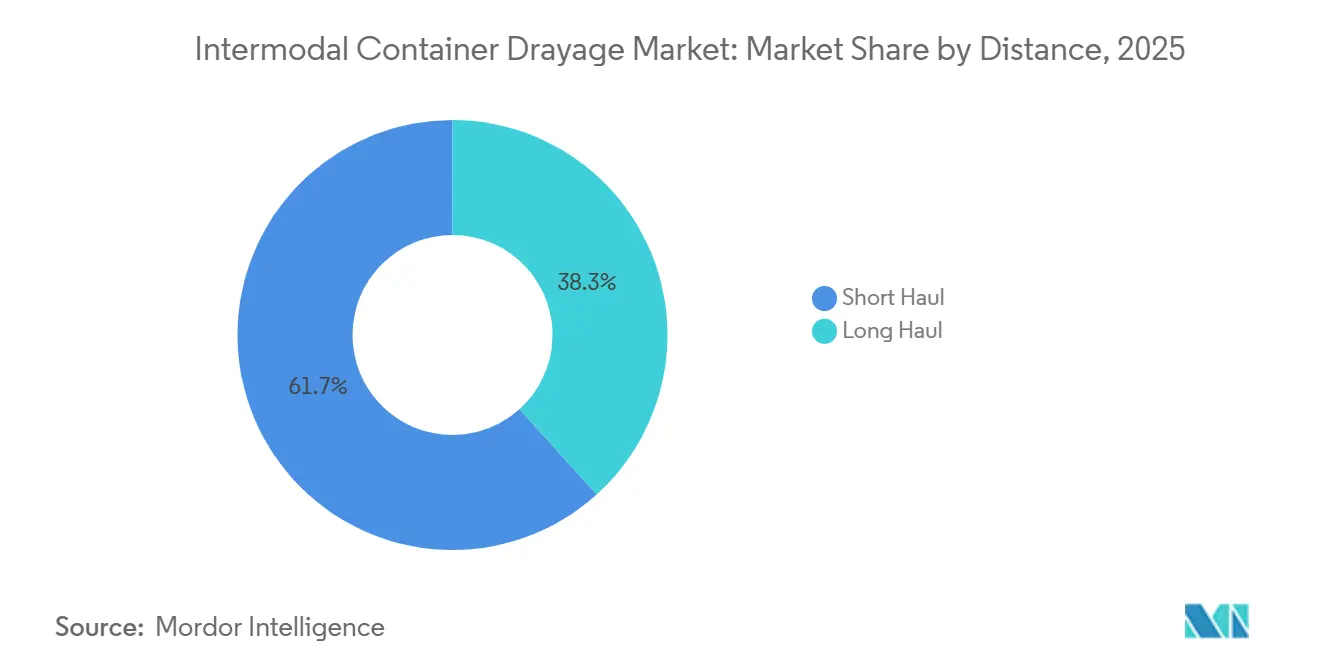
Short haul held 61.70% of the intermodal container drayage market share in 2025, which made it the largest distance category in the intermodal container drayage market. These moves generally connect ports or rail ramps with nearby warehouses, distribution centers, and local customers. High container discharge volumes at large coastal gateways sustain this category. Port-adjacent industrial areas also concentrate the warehouses that receive import cargo. Short-haul work depends on the number of trips that drivers can complete during a shift. Gate delays, appointment systems, and chassis availability, therefore, have a direct effect on capacity. It remains the basic operational layer of intermodal transport because each shipment still needs a local first or final truck move. The large share of short movements also explains why local carrier relationships remain important.
Long haul is forecast to register at a 6.58% CAGR through 2031. Shippers are extending intermodal service beyond traditional gateway distances as rail becomes more attractive than highway-only transport on longer corridors. C.H. Robinson reported 10.3% year-over-year North American intermodal volume growth in early 2025, with expansion concentrated in longer Eastern network lanes. Longer routes can create drayage activity at inland ramps that previously handled fewer local moves. Large shippers can use rail lanes with stronger fuel economics when they extend the overall transport distance. This supports the Intermodal container drayage industry by improving the economics of coordinated rail and truck service. Carriers with balanced networks can benefit when they can match equipment and drivers across both ends of these longer corridors. The growth of Long haul service depends on reliability, since delayed local moves can reduce the advantage of the rail linehaul.
By End User Industry: Retail Leads Demand While Manufacturing Broadens Corridor Use
Wholesale and retail trade held 30.70% of the intermodal container drayage market size in 2025 and is forecast to register at a 6.39% CAGR through 2031. Retail leads because consumer goods supply chains generate large volumes of import containers. Inventory replenishment and omnichannel fulfillment continue to require movement from ports and rail ramps to regional distribution centers. The intermodal container drayage market serves these flows through scheduled port pickups, rail transfers, and warehouse deliveries. Retail demand also favors service providers that can offer dependable time slots and shipment visibility. This customer group places strong value on predictable delivery because warehouse and store operations depend on timely inventory arrival. The scale of retail freight makes it important for carrier network planning. Its growth rate also reflects the expansion of fulfillment networks beyond traditional port warehouses.
Manufacturing is the second-largest end-user vertical and is gaining relevance in cross-border corridors. Nearshoring of automotive and electronics production in Mexico is adding container flows on the United States-Mexico intermodal routes. Agricultural, fishing, and forestry shipments contribute to reefer demand in export-oriented Gulf Coast corridors. C.H. Robinson reported pronounced capacity pressure in Gulf Coast export markets in October 2025. Oil and gas, mining and quarrying, and construction also require specialized transportation for equipment and project cargo. Construction activity near ports adds demand, where new industrial parks and fulfillment centers create both import and export movements. These sectors provide the intermodal container drayage market with cargo that differs from the standard retail container flow. A broader mix of end users can support specialized drayage services when carriers have the right equipment and local operating capabilities.
Geography Analysis
North America held 25.30% of 2025 revenue, the largest regional revenue share. Its rail network, led by BNSF, Union Pacific, Norfolk Southern, and CSX, provides the long-distance network that requires local trucking at each end. Los Angeles, New York, and New Jersey, Savannah, Houston, and Chicago rail ramps create recurring freight density for drayage providers. These gateways connect large import volumes with extensive warehouse and distribution networks. The United States-Mexico corridor is adding a cross-border layer to North American activity. Hub Group reported 302% growth in Mexico intermodal volume during Q2 2025 after its EASO joint venture. Canada and Mexico also support the regional network by handling cross-border freight and related capacity needs.
Asia-Pacific is forecast to be the fastest-growing region, at a 6.83% CAGR through 2031. China provides a large base through its container ports and road-rail connections between coastal and inland locations. India is strengthening rail-linked freight movement through its Dedicated Freight Corridor network, which connects Delhi, Mumbai, and major port cities. The National Logistics Policy of India seeks to reduce logistics costs from 14% to 8% of GDP, supporting inland container depot and rail-linked logistics park investment. These developments can reduce the distance and complexity of container movements between rail facilities and customers. Vietnam’s Ho Chi Minh City-to-Binh Duong manufacturing corridor is also generating port-to-inland container demand. Japan and South Korea contribute stable, high-value volumes through automated port and cold-chain networks.
Europe, South America, the Middle East, and Africa make up the remaining regional revenue base. European carriers face fleet investment pressure from emissions rules, especially on the Hamburg-Rhine, Rotterdam, and Antwerp corridors. GEODIS opened its first multi-service port hub in Le Havre in June 2026, bringing drayage, freight forwarding, and port logistics together under one platform. South American port modernization can create temporary congestion, while improved terminals can later support greater container throughput. The Middle East and Africa are developing inland drayage networks around large maritime gateways. Jebel Ali handles more than 14 million TEUs annually, while port expansions in Saudi Arabia are supporting a wider logistics role. The Intermodal container drayage market in these regions has lower drayage intensity per container than mature markets, but added inland connectivity supports further service demand.

Competitive Landscape
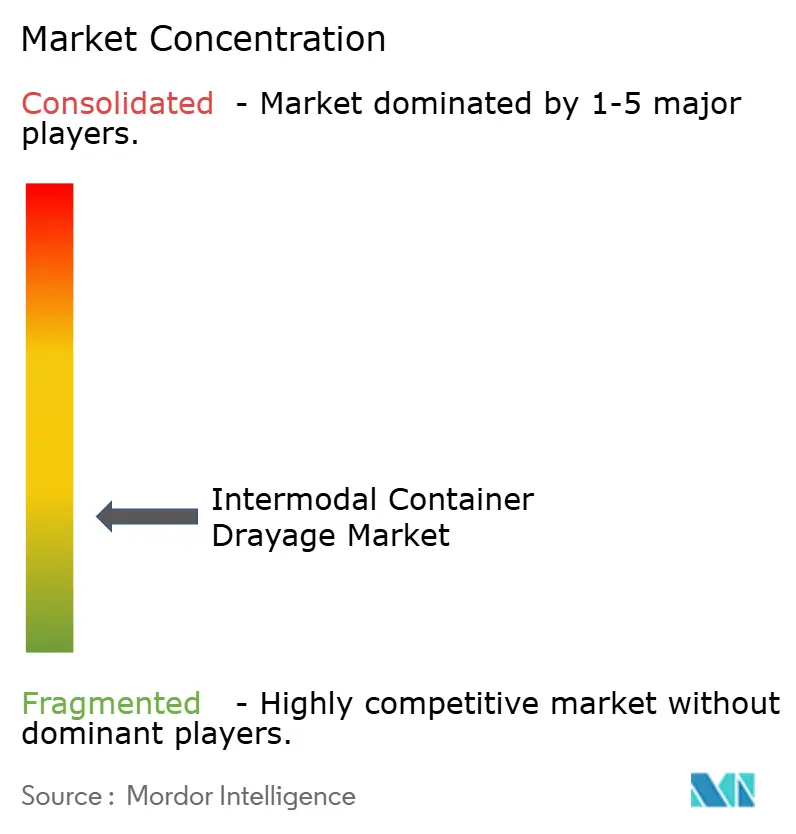
The Intermodal container drayage market is fragmented among leading carriers and highly fragmented across regional and owner-operator providers. J.B. Hunt holds a clear revenue lead in intermodal and drayage services, while Hub Group, Schneider, Evans Network of Companies, and other providers compete in selected networks. Large carriers use owned tractors, containers, chassis, and company drivers to improve service consistency. J.B. Hunt reported that intermodal volume grew 10% in Q2 2026, supported by freight conversion activity in its network. This strategy can limit dependence on third-party capacity during periods when drivers are difficult to secure. Smaller carriers continue to compete through local terminal knowledge, port relationships, and chassis access. The market structure leaves room for both nationwide providers and local specialists.
Vertical integration is a common competitive approach in the Intermodal container drayage market. J.B. Hunt, Schneider, and Knight-Swift use more internal capacity to manage service quality and protect execution. Hub Group expanded its temperature-controlled offering through the acquisition of Marten Transport Intermodal assets in September 2025[3]Hub Group, “Hub Group Closes on the Acquisition of Marten Transport Intermodal,” Hub Group, September 2025, nasdaq.com. Schneider introduced Fast Track in November 2025 to provide expedited drayage and priority rail service for time-sensitive shipments. C.H. Robinson launched BidBoardX in June 2026 to give carriers access to committed freight opportunities, including local, short-haul, and dedicated work. These actions show that carriers and logistics providers are pursuing capacity, service reliability, and network visibility. Cross-border drayage and refrigerated intermodal remain areas where specialized capability can differentiate providers.
Technology and fleet compliance are becoming more important competitive factors. ITS ConGlobal’s Aviro360 platform received SOC 2 Type II certification in June 2025, covering gate automation, inventory reconciliation, and storage optimization for intermodal terminals[4]ITS ConGlobal, “Aviro360 Visibility Platform Achieves SOC 2 Type II Certification,” ITS ConGlobal, June 2025, conglobal.com. Evans Network deployed OpenTrack in April 2026 to provide container visibility, predictive arrival estimates, and exception monitoring across ocean, terminal, rail, and drayage activity. IMC Logistics is using hydrogen and battery-electric equipment in California as part of its lower-emission fleet strategy. Carriers that cannot meet zero-emission requirements may face a weaker position in regulated port corridors. Large operators can invest in technology and equipment more easily than small fleets. However, regional carriers can retain business where local operations and customer relationships matter more than network scale.
Intermodal Container Drayage Industry Leaders
C.H. Robinson Worldwide, Inc.
XPO, Inc.
J.B. Hunt Transport Services, Inc.
Schneider National, Inc.
Hub Group, Inc.
- *Disclaimer: Major Players sorted in no particular order

Recent Industry Developments
- September 2026: IMC Logistics partnered with Hyroad Energy to fuel and service its Class 8 hydrogen fuel cell truck fleet at its Fontana, California, facility. The partnership supports a blended zero-emission strategy that includes battery-electric and other emerging technologies.
- August 2026: NFI Industries announced a partnership with BNSF Railway at the planned Barstow International Gateway project in California. NFI is set to provide integrated port drayage, transportation, warehousing, and distribution services within the development.
- June 2026: C.H. Robinson acquired DeSpir Logistics for USD 77.8 million in cash, adding a specialized network of security-vetted carriers and cargo escort capabilities for high-value freight across North America. DeSpir reported USD 62 million in 2025 revenue.
- March 2026: GEODIS completed the acquisition of Transports Malherbe in France, consolidating its full and partial truckload capabilities and strengthening coverage in agri-food and mass distribution.


Global Intermodal Container Drayage Market Report Scope
| Port Drayage |
| Rail Drayage |
| Inter-Carrier Drayage |
| Intra-Carrier Drayage |
| Expedited Drayage |
| Shuttle Drayage |
| Door-to-Door Drayage |
| Others |
| Dry Containers |
| Refrigerated Containers (Reefer) |
| Tank Containers |
| Specialized Containers |
| Short Haul |
| Long Haul |
| Agriculture, Fishing, and Forestry |
| Construction |
| Manufacturing |
| Oil and Gas, Mining and Quarrying |
| Wholesale and Retail Trade |
| Others |
| North America | United States |
| Canada | |
| Mexico | |
| South America | Brazil |
| Argentina | |
| Peru | |
| Chile | |
| Rest of South America | |
| Europe | Germany |
| United Kingdom | |
| France | |
| Italy | |
| Spain | |
| Russia | |
| Nordics (Denmark, Finland, Iceland, Norway, and Sweden) | |
| Rest of Europe | |
| Asia-Pacific | China |
| India | |
| Japan | |
| South Korea | |
| Australia | |
| Southeast Asia (ASEAN) | |
| Rest of Asia-Pacific | |
| Middle East and Africa | Saudi Arabia |
| United Arab Emirates | |
| Qatar | |
| South Africa | |
| Nigeria | |
| Egypt | |
| Rest of Middle East and Africa |
| By Service Type | Port Drayage | |
| Rail Drayage | ||
| Inter-Carrier Drayage | ||
| Intra-Carrier Drayage | ||
| Expedited Drayage | ||
| Shuttle Drayage | ||
| Door-to-Door Drayage | ||
| Others | ||
| By Container Type | Dry Containers | |
| Refrigerated Containers (Reefer) | ||
| Tank Containers | ||
| Specialized Containers | ||
| By Distance | Short Haul | |
| Long Haul | ||
| By End User Industry | Agriculture, Fishing, and Forestry | |
| Construction | ||
| Manufacturing | ||
| Oil and Gas, Mining and Quarrying | ||
| Wholesale and Retail Trade | ||
| Others | ||
| By Geography | North America | United States |
| Canada | ||
| Mexico | ||
| South America | Brazil | |
| Argentina | ||
| Peru | ||
| Chile | ||
| Rest of South America | ||
| Europe | Germany | |
| United Kingdom | ||
| France | ||
| Italy | ||
| Spain | ||
| Russia | ||
| Nordics (Denmark, Finland, Iceland, Norway, and Sweden) | ||
| Rest of Europe | ||
| Asia-Pacific | China | |
| India | ||
| Japan | ||
| South Korea | ||
| Australia | ||
| Southeast Asia (ASEAN) | ||
| Rest of Asia-Pacific | ||
| Middle East and Africa | Saudi Arabia | |
| United Arab Emirates | ||
| Qatar | ||
| South Africa | ||
| Nigeria | ||
| Egypt | ||
| Rest of Middle East and Africa | ||


Key Questions Answered in the Report
What is driving demand for intermodal container drayage services?
Higher truckload and diesel costs are encouraging highway-to-rail conversion. Container activity and fulfillment requirements also increase demand for truck movements between terminals, warehouses, and customers. The Intermodal container drayage market grows when port or rail volumes connect with dense distribution networks and dependable local capacity.
How large is the intermodal container drayage market?
The intermodal container drayage market size was USD 131.34 billion in 2025 and is estimated at USD 141.85 billion in 2026. It is forecast to reach USD 180.35 billion by 2031, reflecting a 4.92% CAGR. The forecast reflects demand for first-mile and final-mile trucking around intermodal rail and container flows.
Which service type has the largest revenue share?
Port drayage led with 31.80% of revenue in 2025 because imported containers require a local move from the port into the supply chain. The Intermodal container drayage market depends on these port-to-warehouse freight flows. Performance is affected by gate access, chassis availability, driver capacity, and the schedules of receiving facilities.
Which container category is growing fastest?
Refrigerated containers are forecast to grow at a 6.35% CAGR through 2031. The Intermodal container drayage market requires specialized equipment, monitoring, and dependable transfer between terminals and temperature-controlled facilities for these shipments. The service supports food, beverage, and pharmaceutical freight that cannot absorb avoidable delays or equipment shortages.
Why are drayage drivers difficult to secure?
Drivers need terminal experience, TWIC credentials, chassis-management skills, and the ability to manage delays at port and rail facilities. These requirements make it difficult for providers to add qualified capacity quickly. Long dwell times also reduce the number of productive trips that a driver can complete in a shift.
Which region is growing fastest?
Asia-Pacific is forecast to register at a 6.83% CAGR through 2031. Rail-port integration, manufacturing corridors, inland container depots, and logistics parks support the region’s container movement requirements. China provides a large base, while India and Southeast Asia are broadening the region’s sources of demand.
Page last updated on:


 Your data is secure and never sold or shared.


