Electrostatic Precipitator Market Size and Share
Market Overview
| Study Period | 2020 - 2030 |
|---|---|
| Market Size (2025) | USD 8.98 Billion |
| Market Size (2030) | USD 12.25 Billion |
| Growth Rate (2025 - 2030) | 6.40% CAGR |
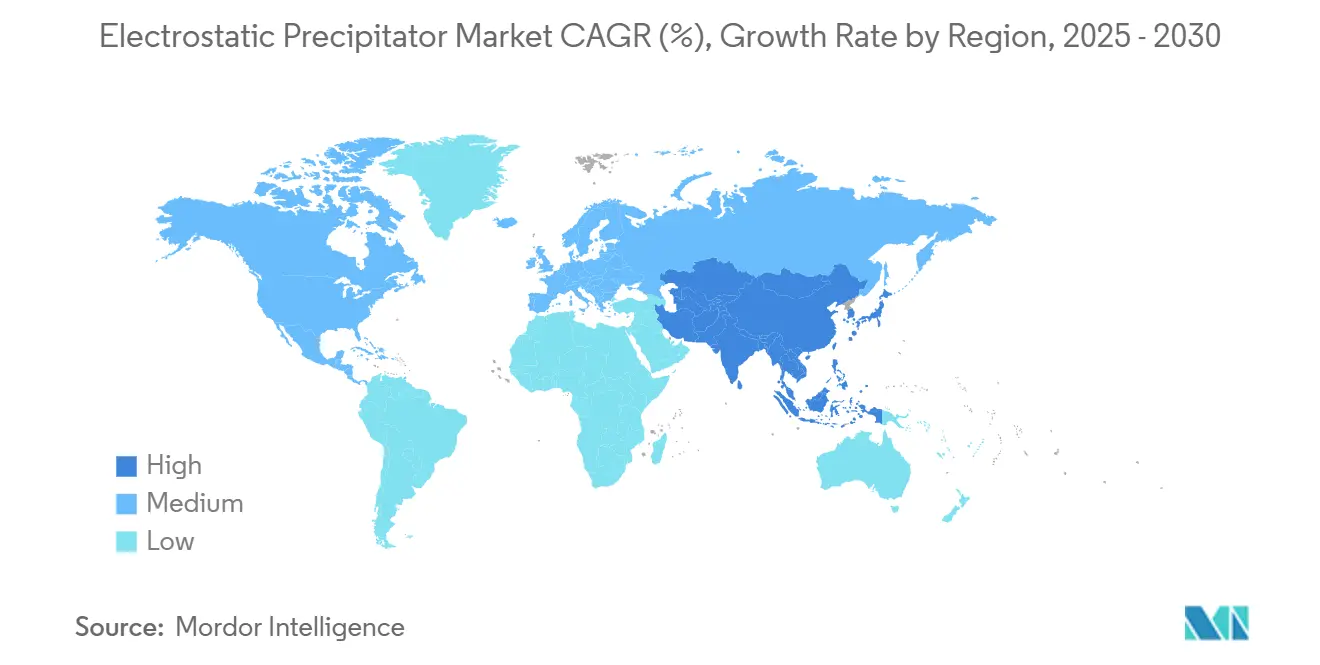
| Fastest Growing Market | Asia Pacific |
| Largest Market | Asia Pacific |
| Market Concentration | Medium |
Major Players
*Disclaimer: Major Players sorted in no particular order Image © Mordor Intelligence. Reuse requires attribution under CC BY 4.0. |
|

Electrostatic Precipitator Market Analysis by Mordor Intelligence
The Electrostatic Precipitator Market size is estimated at USD 8.98 billion in 2025, and is expected to reach USD 12.25 billion by 2030, at a CAGR of 6.40% during the forecast period (2025-2030).
Intensifying particulate-matter regulations, the resurgence of biomass and waste-to-energy (WtE) projects, and rapid digitalization through IoT monitoring collectively anchor demand momentum. Hybrid precipitation-scrubber configurations are gaining favor because they capture sticky aerosols and fine acid mists more effectively than legacy systems, while hardware suppliers increasingly bundle software licenses to secure recurring revenue streams. Competitive rivalry is intensifying as fabric-filter vendors tout removal efficiencies exceeding 99.9% for particles larger than 5 µm; yet plant operators still view electrostatic solutions as the lower-cost option for large gas volumes and high temperatures. Asia-Pacific remains the epicenter of installation activity, propelled by China’s strict coking-chemicals standards and India’s new clinker capacity, whereas North America and Europe concentrate on WtE retrofits paired with carbon-capture units.
Key Report Takeaways
- By technology, dry systems held 70% of the Electrostatic Precipitator market share in 2024, while hybrid designs are projected to expand at a 6.9% CAGR to 2030.(1)ANDRITZ AG, “ANDRITZ Strengthens Environmental Offering With Acquisition of LDX Solutions,” andritz.com
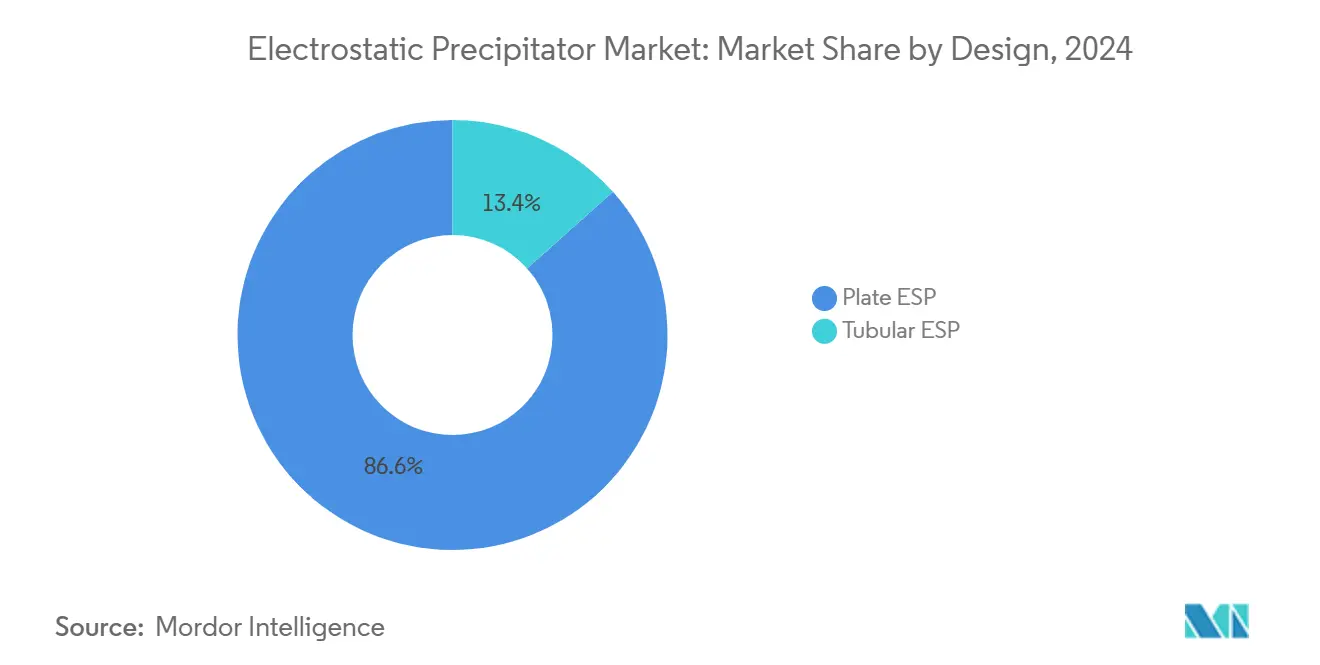
- By design, plate configurations controlled 86.6% of installations in the Electrostatic Precipitator Market in 2024; tubular units record the fastest growth at 8.4% CAGR through 2030.
- By component, hardware represented 65.1% of 2024 revenue in the Precipitator Market, but software is projected to climb at a 7.5% CAGR to 2030, driven by the adoption of predictive maintenance.
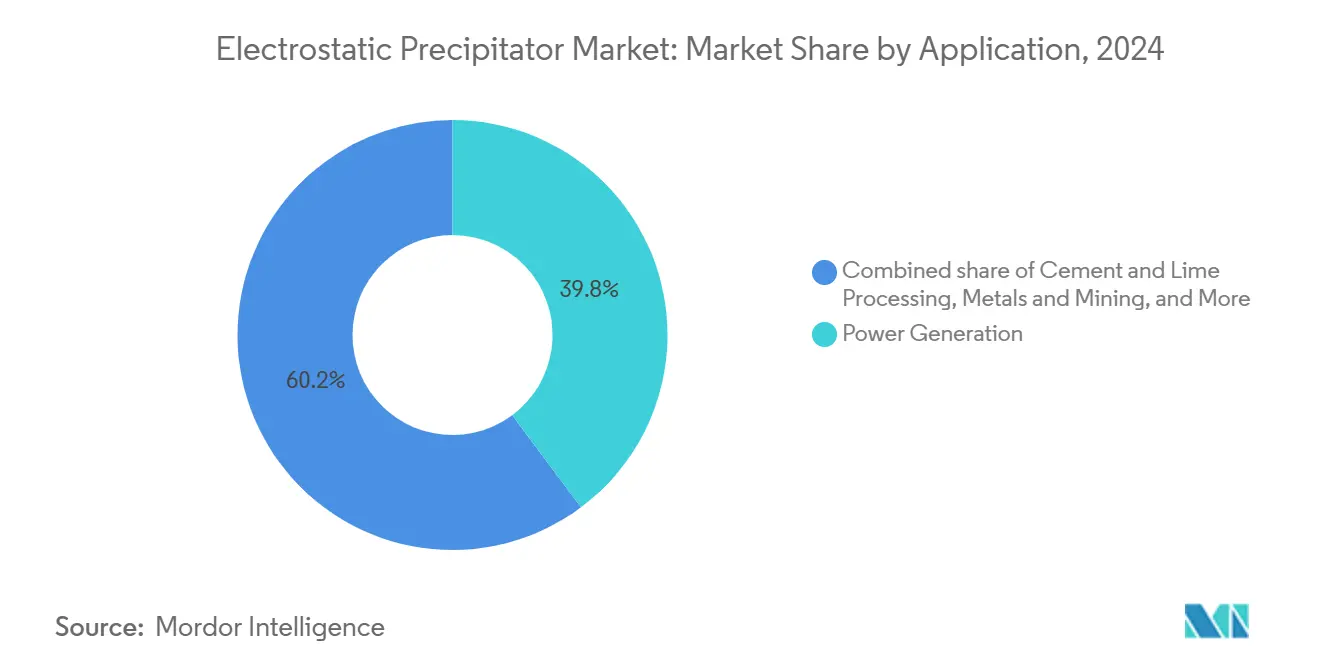
- By application, power generation led with 39.8% of 2024 demand; cement and lime plants are accelerating at a 7.8% CAGR over 2025-2030
- By geography, Asia-Pacific captured 40.5% of 2024 revenue in the Electrostatic Precipitator Market and is charting a 6.8% CAGR to 2030, driven by China’s and India’s stricter particulate caps.(2).
Global Electrostatic Precipitator Market Trends and Insights
Drivers Impact Analysis*
| Driver | (~) % Impact on CAGR Forecast | Geographic Relevance | Impact Timeline |
|---|---|---|---|
| Tightening particulate-matter regulations in emerging economies | 1.20% | Asia-Pacific core, spill-over to MEA | Medium term (2-4 years) |
| Revival of biomass & WtE projects | 0.80% | Global, early gains in Europe, North America | Short term (≤ 2 years) |
| Integration of IoT-enabled monitoring cuts O&M cost | 0.60% | North America & EU, expanding to APAC | Long term (≥ 4 years) |
| Shift toward hybrid ESP-scrubber solutions for sticky aerosols | 0.40% | Global industrial applications | Medium term (2-4 years) |
| Decarbonization retrofits drive ESP upgrades in coal plants | 0.70% | APAC core, selective EU markets | Medium term (2-4 years) |
| Source: Mordor Intelligence | |||
Tightening Particulate-Matter Regulations in Emerging Economies
China’s coking-chemicals standard, mandatory for new facilities from April 2025 and for legacy sites by January 2027, forces operators to replace cyclone separators with high-efficiency precipitators to hit PM limits of ≤ 20 mg/Nm³. South Korea’s dust-management regime similarly catalyzes technology trials in sub-micron collection, a trend mirrored by EPA’s 40 CFR cap of 0.18 g/dscm for diverse U.S. industrial stacks.(3)U.S. Environmental Protection Agency, “40 CFR 60.52—Standard for Particulate Matter,” ecfr.gov The spill-over effect extends to Southeast Asia, as Vietnam and Indonesia draft PM2.5 thresholds modeled on Chinese precedents. Notably, financing for upgrades is being facilitated through green-bond channels aligned with ESG reporting, thereby shortening payback periods. Resultant demand pushes “Electrostatic Precipitator market” tender volumes higher across cement and steel projects, underpinning robust order backlogs for OEMs.
Revival of Biomass & Waste-to-Energy Projects
Heightened landfill diversion mandates across the EU are driving the addition of WtE capacity that integrates carbon capture, thereby reshaping flue-gas profiles. Babcock & Wilcox’s FEED award for Alberta’s first WtE-CCS plant exemplifies the broader pipeline of facilities requiring ultra-low-emission ESP modules with corrosion-resistant alloys. Middle-East projects—Kuwait’s 26 MW WtE plant processing 460,000 t/y of MSW—further propel the need for specialized collectors that handle variable ash chemistries.(4)Al-Ajmi, "Incineration Innovation: A Path to Efficient and Sustainable Municipal Solid Waste Management in Kuwait," doi.org Carbon credits tied to biogenic CO₂ removal enhance project economics, strengthening order flow in the Electrostatic Precipitator market. OEMs respond by pairing wet stages for acid-gas abatement with dry plates upstream to minimize water load, illustrating the rise of multi-pollutant architectures.
Integration of IoT-Enabled Monitoring Cuts O&M Cost
Real-time voltage optimization platforms reduce power draw by up to 35% and increase compliance uptime to 100%, as documented in ultra-low-emission coal plants that employ edge analytics. Predictive algorithms flag electrode misalignment before arcing events occur, a critical boon amid global shortages of high-voltage technicians. Korea’s filter-free public air purifier deployment demonstrates how electrostatic modules embedded with 5G sensors achieve over 90% PM1 removal while maintaining ozone levels under 0.003 ppm. The success of such pilots accelerates the “Electrostatic Precipitator market” transition from capex-only sales to OPEX-linked service contracts, deepening vendor lock-ins and smoothing revenue cycles.
Shift Toward Hybrid ESP-Scrubber Solutions for Sticky Aerosols
Hybrid collectors that pre-charge particles before liquid absorption lift PM2.5 capture from 86.3% to 92.1% and boost SO₃ removal by 4.9 percentage points. Two-stage designs also mitigate sparks caused by tar condensates in petrochemical vents, broadening applicability. Switching-integrated rectifiers lower energy demand by 12% compared with traditional thyristor supplies. With regulators now targeting condensable organics, hybrid units become indispensable, anchoring long-run growth in the Electrostatic Precipitator market despite baghouse competition.
Restraints Impact Analysis*
| Restraint | (~) % Impact on CAGR Forecast | Geographic Relevance | Impact Timeline |
|---|---|---|---|
| High CAPEX and long payback period | -0.90% | Global, particularly emerging markets | Short term (≤ 2 years) |
| Competition from high-efficiency fabric filters | -0.60% | North America & EU, expanding globally | Medium term (2-4 years) |
| Skilled-labor shortage for high-voltage maintenance | -0.40% | Global industrial regions | Long term (≥ 4 years) |
| Wet-ESP wastewater challenges under PFAS rules | -0.30% | North America & EU regulatory zones | Medium term (2-4 years) |
| Source: Mordor Intelligence | |||
High CAPEX and Long Payback Period
Typical utility-scale installations require USD 2-5 million for hardware alone, which doubles when structural retrofits are needed, discouraging cash-constrained cement kilns in Southeast Asia. Lending windows often cap at 7 years, yet ROI for ESPs stretches beyond 10 years under current electricity prices, slowing order conversion. Emerging green-finance mechanisms are beginning to ease this hurdle, but smaller enterprises still tend to gravitate toward cyclones or entry-level baghouses. Hence, capital intensity subtracts 0.9 percentage points from the Electrostatic Precipitator market CAGR despite a robust regulatory push.
Competition from High-Efficiency Fabric Filters
Baghouses now guarantee sub-2 mg/Nm³ emissions on variable loads without the need for high-voltage electronics. Maintenance simplicity attracts U.S. biomass plants converting from ESPs during boiler refurbishments, siphoning incremental orders away from Electrostatic precipitator market vendors. Although electrostatic units retain superiority for very large gas volumes, their share declines in segments like WtE, where dioxin control is paramount, trimming 0.6 percentage points off forecast growth.
*Our forecasts treat driver/restraint impacts as directional, not additive. The impact forecasts reflect baseline growth, mix effects, and variable interactions.
Segment Analysis
By Technology: Dry Systems Retain Core Advantage
Dry collectors commanded a 70% share and generated the largest slice of the Electrostatic Precipitator market size in 2024, with segment revenue on track to post a 6.9% CAGR into 2030. Their ability to tolerate 400 °C flue streams without water-handling suits makes them suitable for coal boilers and cement pre-heaters. Wet variants, while niche, achieve sub-1 mg/Nm³ on acid mists, winning orders at nickel smelters and WtE stacks. Hybrid offerings are capturing share, pairing dry inlets for coarse dust with wet finals for aerosols, reflecting utilities’ quest for single-train compliance. Membrane-electrode prototypes unveiled in 2025 promise greater than 95% ultrafine capture at one-third the ozone footprint, but commercialization lags.
Innovations focus on self-cleaning rapping mechanisms and modular switched-mode power supplies that raise corona current while trimming losses, breathing new life into mature designs. OEMs package software dashboards with new builds to preserve their aftermarket share as revenue shifts from capital expenditures to services. Despite fabric-filter headwinds, technology diversification supports steady accretion of the Electrostatic Precipitator market size across multiple industrial verticals over the forecast period.
By Design: Plate Dominance Meets Tubular Upswing
Plate models controlled 86.6% of the 2024 Electrostatic Precipitator market share thanks to extensive references and easy plate-pull maintenance. Yet tubular cells enjoyed an 8.4% CAGR, energized by petrochemical and fertilizer plants grappling with sticky aerosols where circular gas paths prevent re-entrainment. Developers deploy gas-conditioning towers upstream to drive dust resistivity into the sweet spot of 5-100 × 10⁸ Ω-cm, thereby boosting plate efficiency by 3-5 percentage points. Conversely, compact axial-flow tubes are favored in retrofit spaces with a height of under 4 m. Both architectures now incorporate high-frequency transformers that operate above 20 kHz, thereby reducing spark incidents and conserving energy. The convergence of design improvements ensures capacity additions remain weighted toward plate collectors but leaves ample room for tubular penetration—advancing the overall Electrostatic Precipitator market.


By Component: Hardware Heavy, Software Swift
Hardware accounted for 65.1% of 2024 revenue, reflecting the capital-intensive nature of collecting plates, discharge wires, and rigorously insulated frames. However, software license sales and cloud subscriptions recorded a 7.5% CAGR and will comprise a growing slice of the Electrostatic Precipitator market size by 2030. Predictive-maintenance modules harness edge analytics to trim outage hours by up to 40%, compelling operators to sign multi-year service contracts. Services—installation, condition-monitoring, and performance tuning—expand as OEMs pitch outcome-based guarantees. The talent squeeze and emission-reporting obligations jointly elevate the value proposition of digital add-ons that precede expensive overhauls, nudging the revenue mix toward recurring income streams.
By Application: Power Generation Still Leads but Cement Accelerates
Power stations accounted for 39.8% of demand in 2024, primarily due to legacy coal fleets in China, India, and the United States. Yet clinker and lime kilns, spurred by the shift to calcined clay mixes, show the fastest gains at a 7.8% CAGR, creating an incremental Electrostatic Precipitator market size worth nearly USD 1 billion by 2030. Chemical complexes utilize corrosion-resistant electrodes to handle chlorides and fluorides; metals and mining operators employ high-frequency rapping to combat sintered dust. Food and pharmaceutical facilities, although smaller, specify GMP-compliant housings with polished interiors to prevent cross-contamination. WtE lines integrate ESP modules between boiler economizers and wet FGD stages to curtail fly-ash slip pre-carbon-capture, signaling fresh growth vectors for the broader Electrostatic Precipitator market.
Geography Analysis
The Asia-Pacific region retained a commanding 40.5% revenue share in 2024 in the Electrostatic Precipitator Market, and a 6.8% CAGR is expected to keep it the fastest-growing region through 2030. China’s push for “ultra-low emissions” below 10 mg/Nm³ across steel and power sectors sustains replacement cycles, while India’s production-linked incentives to build 110 Mt of new cement capacity amplify dust-control orders. South Korea pilots IoT-embedded collectors to address PM10 spikes, making the peninsula a showcase for data-driven compliance. Southeast Asia, led by Vietnam’s mega-WtE projects, adopts turnkey dry-wet hybrids to tackle high-chloride refuse fuels.
Europe, the second-largest customer, channels funding from the Innovation Fund into WtE-CCS consortia; stricter revisions to the Industrial Emissions Directive lock in orders for tubular wet stages on acid-gas streams. North America gravitates toward refurbishment, driven by the Inflation Reduction Act’s tax credits for carbon-capture retrofits that require tie-ins with upgraded precipitators. Canada’s first WtE-CCS facility sets a template for future municipal projects, enlarging the Electrostatic Precipitator market in the region.
South America invests in clinker capacity debottlenecking, especially in Brazil and Colombia, resulting in mid-sized plate packages. The Middle East & Africa region leans on Chinese EPC firms for bundled power-cement offerings, seeding a nascent but rapidly rising demand pool. Across all geographies, financial-closure velocity hinges on how readily operators monetize carbon and energy credits, factors that continue to steer the spatial distribution of Electrostatic Precipitator market growth over the next five years.

Competitive Landscape
The Electrostatic Precipitator market exhibits moderate concentration, with the five largest players accounting for roughly 55-60% of 2024 revenue, resulting in a market concentration score of 6. ANDRITZ’s acquisition of LDX Solutions in February 2025 added more than 2,000 installed wet units to its aftermarket dossier, thereby sharpening its bid competitiveness in North America. Mitsubishi Heavy Industries accelerates integration of its KM CDR carbon-capture process with in-house ESP technology to target steel and fertilizer clients. Babcock & Wilcox capitalizes on a reference list exceeding 300 WtE boilers, translating application know-how into premium pricing.
Emerging digital specialists, such as Mirani-Edge and CleanAir Engineering, leverage AI dashboards to win service contracts at legacy plants where OEM warranties have expired. Fabric-filter manufacturers intensify share-capture efforts, bundling baghouses with catalytic dioxin control, which pressures precipitator margins in WtE bids. To defend territory, incumbent ESP vendors co-develop switched-mode rectifiers with power-electronics firms, delivering 2-3 year ROI to operators. The contest thus pivots on holistic offerings that blend mechanical reliability with digital intelligence, setting the competitive tone across the Electrostatic Precipitator market through 2030.
Electrostatic Precipitator Industry Leaders
-
Thermax Ltd.
-
Mitsubishi Heavy Industries (MHI)
-
Babcock & Wilcox Enterprises
-
Fujian Longking Co., Ltd.
-
FLSmidth & Co. A/S
- *Disclaimer: Major Players sorted in no particular order


Recent Industry Developments
- January 2025: ANDRITZ has completed the acquisition of LDX Solutions, enhancing its wet-ESP expertise and expanding North American service coverage.
- January 2025: China’s environment ministry has enforced new PM limits for coking-chemicals, accelerating nationwide retrofit activity.
- September 2024: Babcock & Wilcox won FEED for Alberta’s first WtE plant with CCS, specifying advanced ESP modules.
- July 2024: ANDRITZ selected to integrate carbon capture at Finland’s Westenergy WtE facility, with existing ESP optimization in scope.


Global Electrostatic Precipitator Market Report Scope
| Dry ESP |
| Wet ESP |
| Hybrid/Integrated ESP |
| Membrane-based ESP |
| Plate ESP |
| Tubular ESP |
| Hardware |
| Software |
| Services |
| Power Generation |
| Cement and Lime Processing |
| Waste-to-Energy/Biomass |
| Chemical and Petrochemical |
| Metals and Mining |
| Food and Pharmaceutical Processing |
| Others |
| North America | United States |
| Canada | |
| Mexico | |
| Europe | Germany |
| United Kingdom | |
| France | |
| Italy | |
| NORDIC Countries | |
| Russia | |
| Rest of Europe | |
| Asia-Pacific | China |
| India | |
| Japan | |
| South Korea | |
| ASEAN Countries | |
| Rest of Asia-Pacific | |
| South America | Brazil |
| Argentina | |
| Rest of South America | |
| Middle East and Africa | Saudi Arabia |
| United Arab Emirates | |
| South Africa | |
| Egypt | |
| Rest of Middle East and Africa |
| By Product Type | Dry ESP | |
| Wet ESP | ||
| Hybrid/Integrated ESP | ||
| Membrane-based ESP | ||
| By Design | Plate ESP | |
| Tubular ESP | ||
| By Component | Hardware | |
| Software | ||
| Services | ||
| By Application | Power Generation | |
| Cement and Lime Processing | ||
| Waste-to-Energy/Biomass | ||
| Chemical and Petrochemical | ||
| Metals and Mining | ||
| Food and Pharmaceutical Processing | ||
| Others | ||
| By Geography | North America | United States |
| Canada | ||
| Mexico | ||
| Europe | Germany | |
| United Kingdom | ||
| France | ||
| Italy | ||
| NORDIC Countries | ||
| Russia | ||
| Rest of Europe | ||
| Asia-Pacific | China | |
| India | ||
| Japan | ||
| South Korea | ||
| ASEAN Countries | ||
| Rest of Asia-Pacific | ||
| South America | Brazil | |
| Argentina | ||
| Rest of South America | ||
| Middle East and Africa | Saudi Arabia | |
| United Arab Emirates | ||
| South Africa | ||
| Egypt | ||
| Rest of Middle East and Africa | ||


Key Questions Answered in the Report
What is the 2025 value of the Electrostatic Precipitator market?
The market stands at USD 8.98 billion in 2025.
How fast will global Electrostatic Precipitator market demand grow through 2030?
Revenue is projected to rise at a 6.4% CAGR to USD 12.25 billion.
Which technology commands the most installations?
Dry collectors account for 70% of active systems worldwide.
Why are cement plants adopting more ESPs?
Calcined-clay processes raise dust loads, prompting a 7.8% CAGR for precipitators in cement lines.
Which region buys the most ESP equipment?
Asia-Pacific holds 40.5% of global revenue and remains the fastest-growing market.
How are IoT tools changing ESP operations in electrostatic precipitator market?
Predictive-maintenance platforms lower energy use up to 35% and raise uptime to 100%, cutting O&M costs.
Page last updated on:


