
Indonesia Reverse Logistics Market Size and Share
Market Overview
| Study Period | 2020 - 2031 |
|---|---|
| Forecast Data Period | 2026 - 2031 |
| Base Year Market Size (2025) | USD 7.59 Billion |
| Market Size (2026) | USD 8.29 Billion |
| Market Size (2031) | USD 12.81 Billion |
| Growth Rate (2026 - 2031) | 9.09 % |
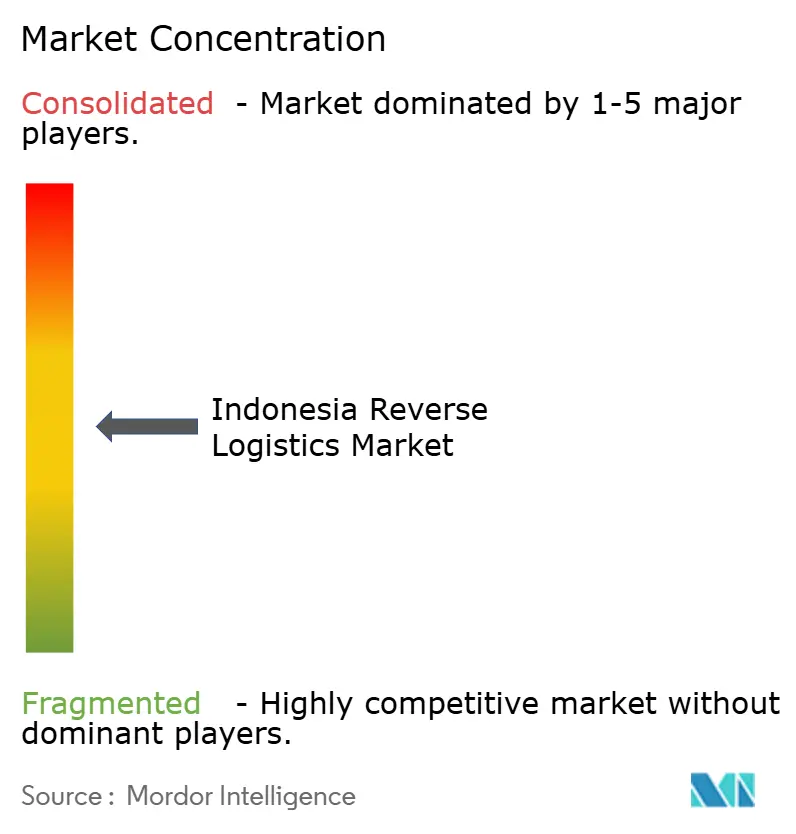
| Market Concentration | Medium |
Major Players
*Disclaimer: Major Players sorted in no particular order Image © Mordor Intelligence. Reuse requires attribution under CC BY 4.0. |
|
Indonesia Reverse Logistics Market Analysis by Mordor Intelligence
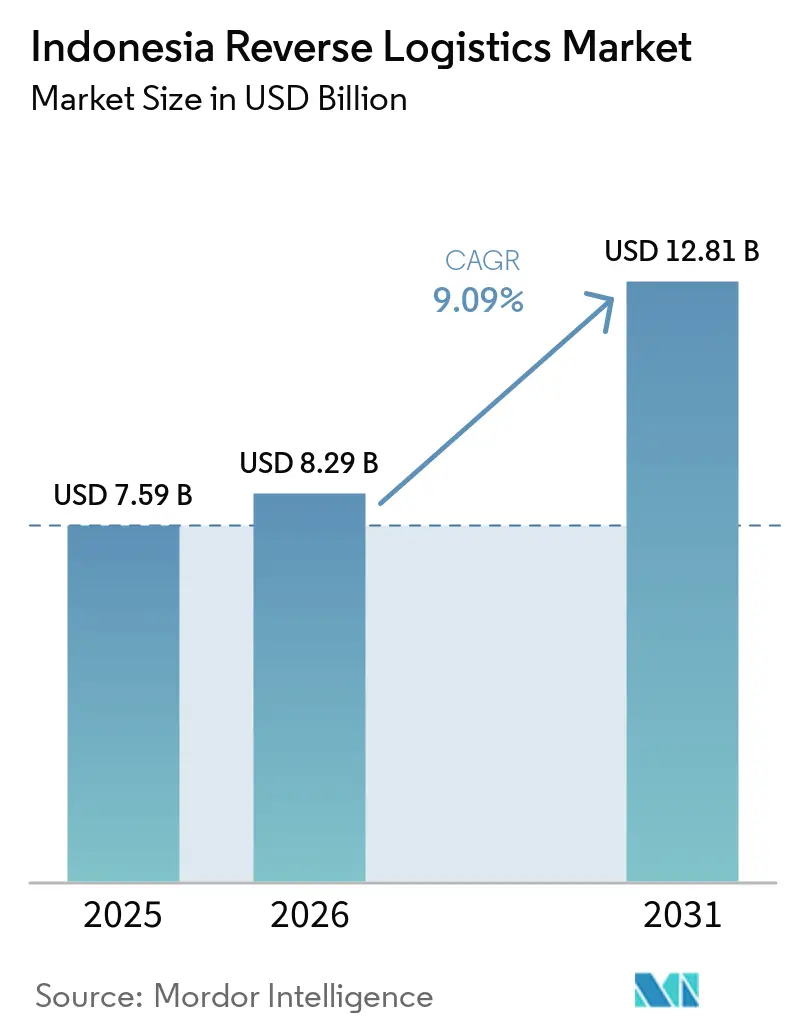
The Indonesia reverse logistics market size was valued at USD 7.59 billion in 2025 and is estimated to grow from USD 8.29 billion in 2026 to reach USD 12.81 billion by 2031, at a CAGR of 9.09% during the forecast period (2026-2031).
Indonesia’s island geography makes return collection, consolidation, and processing more difficult than in land-connected economies, since movements often cross several transport corridors. E-commerce activity increased the volume of unwanted, damaged, and undelivered goods entering reverse channels, while cash-on-delivery failures added a distinct source of returns. Providers are expanding collection, sorting, tracking, and value-recovery capabilities to handle these flows more consistently. Regulatory work on producer responsibility also supported a more organized approach to collection and recovery. The Indonesia reverse logistics market, therefore, combines large transport needs with growing demand for refurbishment, restocking, and compliant disposition services.
Key Report Takeaways
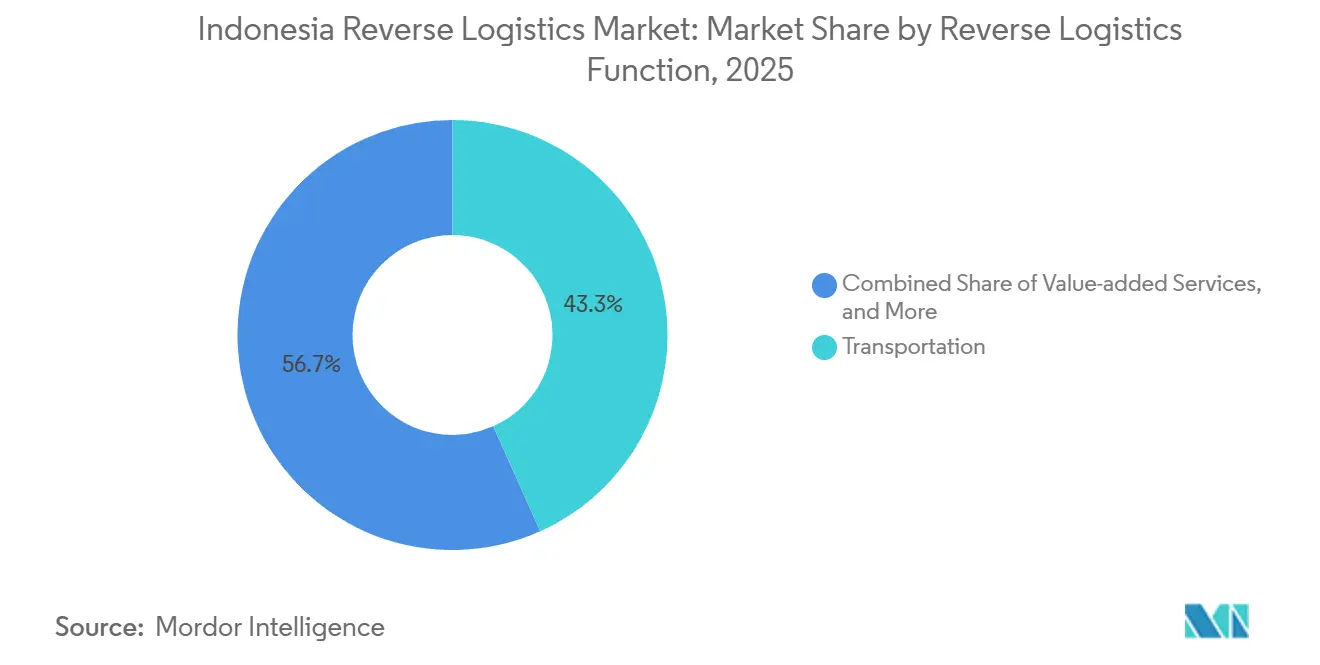
- By reverse logistics function, transportation held 43.25% of the Indonesia reverse logistics market share in 2025, while other value-added services recorded the highest projected CAGR at 12.45% through 2031.
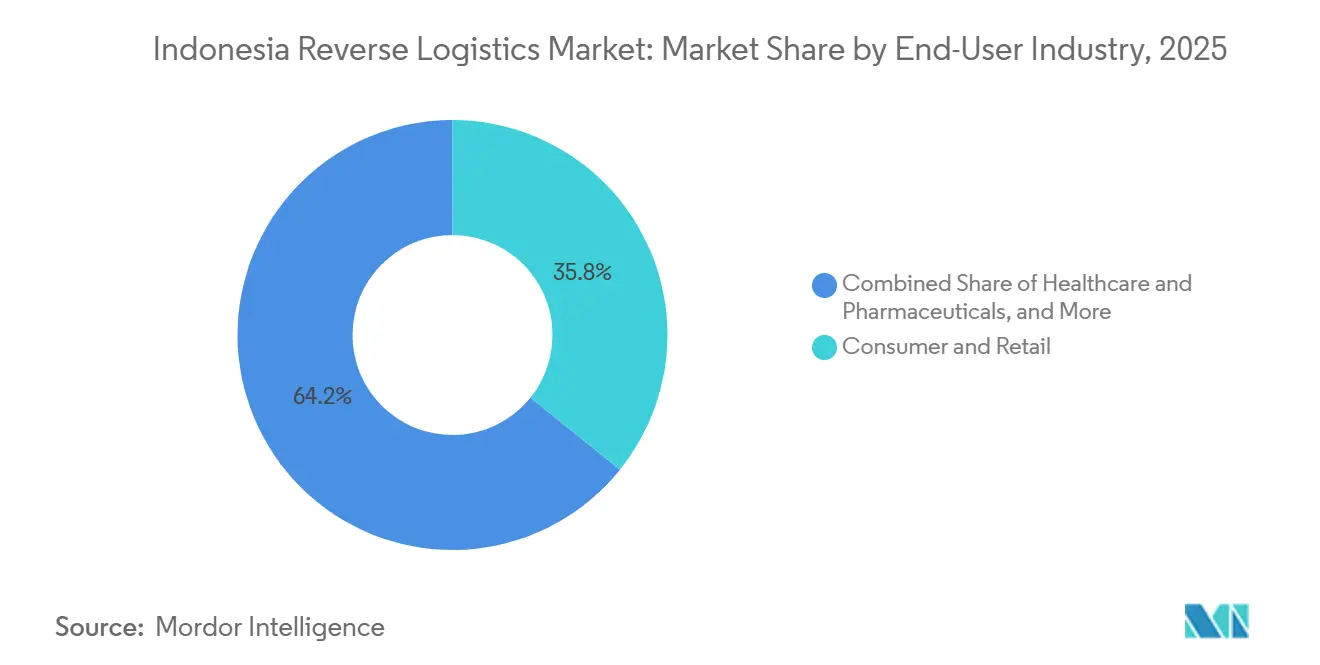
- By end-user industry, consumer and retail held 35.78% of the Indonesia reverse logistics market size in 2025, while healthcare and pharmaceuticals recorded the highest projected CAGR at 11.34% through 2031.
- By geography, Java, including Jakarta and BOD, held 67.23% of the Indonesia reverse logistics market share in 2025, while Kalimantan recorded the highest projected CAGR at 13.67% through 2031.
Note: Market size and forecast figures in this report are generated using Mordor Intelligence’s proprietary estimation framework, updated with the latest available data and insights as of January 2026.
Indonesia Reverse Logistics Market Trends and Insights
Drivers Impact Analysis*
| Driver | (~) % Impact on CAGR Forecast | Geographic Relevance | Impact Timeline |
|---|---|---|---|
| E-commerce Returns Increasing Reverse Logistics Demand | +2.0% | Global, concentrated in Java and Sumatra | Short term (≤ 2 years) |
| Customer Expectations for Faster Return Processing | +1.2% | National, strongest in Java urban centers | Short term (≤ 2 years) |
| Circular Economy Priorities Supporting Product Value Recovery | +1.0% | National, with early gains in Jakarta and Surabaya | Medium term (2-4 years) |
| Recommerce Growth Expanding Inventory Recovery Channels | +1.0% | National, strongest in Java Tier 1 and Tier 2 cities | Short term (≤ 2 years) |
| Producer Take-Back Obligations Supporting Organized Reverse Logistics | +0.9% | National, with early compliance gains in Java | Medium term (2-4 years) |
| Secondary-City Expansion Creating Reverse Logistics Opportunities | +0.9% | Kalimantan, Sulawesi, and Sumatra secondary cities | Long term (≥ 4 years) |
| Source: Mordor Intelligence | |||
E-commerce Returns Increasing Demand for Reverse Logistics
Indonesia’s digital marketplaces created return flows that differed from those in predominantly card-based economies. Cash-on-delivery delivery failures accounted for more than 20% of shipments and added returns beyond products that consumers sent back because they were unwanted or defective. Product quality ranked ahead of delivery experience and return-policy clarity as a reason for consumer returns in Indonesian B2C e-commerce. TikTok Shop’s June 2026 policy requires sellers to bear part of the return logistics costs, up to USD 0.62 per reverse transaction, which shows the financial burden of returns within platform operations. This mix of failed deliveries and consumer-led returns expanded the work available to specialist providers. It also made cost control and faster collection more important across the Indonesia reverse logistics market.[1]"Reverse Process Effectiveness as a Mediator of Return Volume Uncertainty, Return Information Quality, and Return Decision Quality on Warehouse Operational Performance in Indonesian FMCG Companies." Siber Journal of Transportation and Logistics, research.e-siber.org The combination also required providers to handle returns that began with a failed delivery differently from products returned after use or inspection, because collection timing, condition review, seller communication, inventory status, and the suitable final route could vary even when both parcels moved through the same marketplace network.
Customer Expectations Accelerating Faster Product Return Processing
Return-processing time became a more important part of merchant retention and seller economics as customer expectations increased. A study of Indonesian FMCG warehouses found that uncertainty in return volume reduced warehouse performance, while return information quality played an important role in operational outcomes. This made inspection records, condition codes, and clear disposition decisions valuable for providers handling growing return volumes. SiCepat Logistik launched in July 2026 with tracking, dashboard APIs, and digital pickup-to-return scheduling capabilities. These tools reduced avoidable manual steps between collection and final disposition. Faster processing became especially important for healthcare and consumer electronics returns, where errors might create financial or compliance consequences.[2]“Regulation of the Minister of Environment and Forestry Number 2 of 2024 on Eco-Labeling,” Ministry of Environment and Forestry, menlhk.go.id A more reliable process also enables sellers to receive clearer status updates, warehouses to prepare staff and space for incoming goods, and operators to separate goods for restocking, repair, recovery, or further transport without waiting for incomplete information.
Circular Economy Priorities Strengthening Product Value Recovery
Indonesia’s Circular Economy Roadmap for 2025-2045 and the 2024 eco-labeling regulation shifted attention toward recovery rather than disposal. Returned inventory can move through refurbishment, recycling, or resale channels when its condition supports recovery. A pharmaceutical distribution study found that environmental measures in planning could reduce expired-product recovery costs and emissions. LIQUID8’s model converted e-commerce returns and undelivered inventory into resaleable goods, which gave this activity a more structured commercial basis. This approach widened the role of the Indonesia reverse logistics market beyond parcel movement. It created demand for inspection, grading, restocking, repair, and secondary-sale processes that preserved product value. Each of these routes depended on accurate assessment of the returned item, including its condition, recoverable value, packaging status, and suitability for resale, refurbishment, recycling, or another compliant recovery path.
Producer Take-Back Obligations Supporting Organized Reverse Logistics
The Ministry of Environment stated in 2026 that extended producer responsibility provisions were included in a draft presidential regulation submitted to the State Secretariat. Only 26 companies had submitted waste-reduction roadmaps under the producer waste-reduction regulation at the latest review. Mandatory take-back obligations may create formal demand for collection systems in plastic packaging, consumer electronics, and pharmaceutical packaging. This may favor operators that already operate broad collection and hub networks. Pos Indonesia’s extensive service-point network can support take-back collection across areas that lack specialized facilities. Contracted collection and recovery services can also give the Indonesia reverse logistics market a more regular revenue base than ad hoc consumer returns. Producers may need practical routes for collecting goods, bringing them to appropriate sites, recording their movement, and directing them toward recovery or final treatment, which increases the value of nationwide coordination.
Restraints Impact Analysis*
| Restraint | (~) % Impact on CAGR Forecast | Geographic Relevance | Impact Timeline |
|---|---|---|---|
| Fragmented Recovery Networks Limiting Efficiency | -1.8% | National, most acute in Sulawesi, Kalimantan, and Sumatra | Long term (≥ 4 years) |
| Inter-Island Returns Increasing Transport and Handling Costs | -1.5% | National, strongest in Eastern Indonesia and outer islands | Long term (≥ 4 years) |
| Poor Return Data Standardization Increasing Processing Complexity | -0.8% | National | Medium term (2-4 years) |
| Return Fraud and Counterfeiting Increasing Operational Risks | -0.7% | National, concentrated in Java marketplace hubs | Short term (≤ 2 years) |
| Source: Mordor Intelligence | |||
Fragmented Recovery Networks Limiting Reverse Logistics Efficiency
Many Tier 2 and Tier 3 locations lacked nearby facilities for return inspection, repair, or resale preparation. Providers often had to absorb several transport legs or wait until enough goods accumulated to justify a consolidated shipment. A study across 34 provinces found that stronger port connectivity reduced inter-island price variation by 4.7-6.2%, although retail price gaps changed little after sea-route investment. The finding indicated that forward-distribution improvements had not fully resolved last-mile and return-mile constraints. The Sea Toll Program completed 756 voyages and moved 32,732 TEUs to 104 ports in 2025, but comparable investment in return-flow infrastructure remained limited. Consolidation services for fragmented flows in Sulawesi, Kalimantan, and Sumatra remained a clear opportunity within the Indonesia reverse logistics market.[3]"The Implementation of Proper Drug Distribution Methods in Handling Cold Chain Products at a Major Pharmaceutical Distributor in Manado City." Journal of Wound Science 5, no. 2 (2024), doi.org Without predictable return volumes, providers faced a difficult choice between holding goods for an efficient load or moving them sooner at a higher unit cost, and both choices could delay recovery, restocking, or final disposition.
Inter-Island Returns Increasing Transportation and Handling Costs
A parcel returned from an outer island to a Java fulfillment hub often needs several transport legs before processing can begin. These movements reduce margins that domestic operators can not fully recover through marketplace service fees. Temperature-sensitive pharmaceutical returns also require documented handling throughout the reverse journey under the updated Good Distribution Practice requirements. A study of cold-chain management in Siak Regency found that 50% of reviewed facilities lacked dedicated cold-chain infrastructure in 2024. Improved maritime links narrowed the Java-Papua rice price disparity from 47% in 2019 to 31% in 2025, but material cost gaps remained. Seasonal shopping campaigns further increased handling costs when outer-island capacity could not expand quickly enough.[4]"Towards Sustainable Polio Vaccine Distribution: Evaluating a Green Metrics Framework in Indonesia's Pharmaceutical Industry." doi.org The issue involved more than freight charges, because every additional handoff could add inspection needs, waiting time, packaging risk, documentation work, and the possibility that the product's condition changed before it reached the final processing location.
*Our forecasts treat driver/restraint impacts as directional, not additive. The impact forecasts reflect baseline growth, mix effects, and variable interactions.
Segment Analysis
By Reverse Logistics Function: Value-Added Services Gain Ground Alongside Transportation
Transportation held 43.25% of the Indonesia reverse logistics market share in 2025, reflecting the cost of inter-city, inter-island, and last-mile return movement. Road transport carried much of the volume along Java and major Sumatran routes, where collection points, sortation facilities, and fulfillment centers were more closely linked. This mode remained essential when returns needed routine movement between consumers, sellers, warehouses, and consolidation sites. Air transport handled time-sensitive pharmaceutical returns and high-value electronics that required a faster turnaround and closer control. Its role was narrower in volume terms, but it remained important when condition, timing, and chain-of-custody requirements limited the use of slower modes. Sea consolidation under other modes gained relevance for returns that were less time-sensitive and could be grouped into economic loads. SiCepat’s Fast Lane inter-island sea-freight service provided a lower-cost alternative to air freight for suitable outer-island returns. The service reflected a need to match transport choice with the product’s value, required turnaround, and island location. It also showed that providers could reduce reverse movement costs by avoiding a single-mode approach. J&T Express had 127 sortation centers across Southeast Asia by mid-2026, including 6 units added during the first half and 75 automated sorting lines. This infrastructure showed the scale needed to receive, scan, separate, and redirect rising transport volumes efficiently.
Other value-added services had the fastest forecast growth at 12.45% CAGR from 2026 to 2031. Warehousing remained the second-largest function because returned goods needed staging, inspection, grading, and disposition before restocking or resale. These sites gave operators time to verify the item, record its condition, and decide whether it could return to sale, move to repair, or enter a recovery channel. Warehousing also limited unnecessary long-distance movements by allowing operators to consolidate goods before a further transfer. This group included return processing, refurbishment, restocking, and final disposition. Its growth reflected greater attention to the recoverable value of returned inventory rather than only the cost of moving it. Blibli’s Fulfillment at Speed platform served 100 brands and recorded cumulative GMV of USD 200 million in the 2 years after its 2024 external launch. The platform illustrated how brands could combine storage, order fulfillment, and return handling across online and offline channels. Such arrangements reduced handoffs between separate service providers and improved visibility over returned stock. They also supported quicker decisions on restocking, resale, repair, recycling, or disposal. Producer responsibility rules could further support demand for compliant repair, recovery, and disposition services. These functions increased the importance of operational capability beyond transport in the Indonesia reverse logistics market.



By End-user Industry: Healthcare Compliance Supports Faster Growth
Consumer and retail led demand with 35.78% of the Indonesia reverse logistics market size in 2025. Fashion, electronics, and beauty products generated significant marketplace return volumes because customers could return items for quality, fit, condition, or delivery-related reasons. Product quality remained the leading consumer return factor in Indonesian B2C e-commerce. This required carriers and sellers to distinguish between goods suitable for rapid restocking and items needing review or recovery. Return practices, therefore, affected inventory availability as well as transport workload. FMCG returns followed a different pattern that included expiry management, distributor redistribution, and packaging recovery. Warehouse performance depended heavily on reliable return information in this area. Clear data helped warehouses identify what had returned, why it had returned, and the next handling step. Home and Decor returns often followed transit damage or size-specification mismatches. These products can need added inspection because their condition can change during delivery or return transport. Education equipment, industrial supplies, and other end users generally used general-purpose networks because their regulatory needs were lower and processing windows were longer. The differing product needs meant that the Indonesia reverse logistics industry served several operational models rather than one uniform return process.
Healthcare and pharmaceuticals recorded the highest forecast CAGR at 11.34% from 2026 to 2031. The Jaminan Kesehatan Nasional program covered 284.3 million participants as of April 2026, expanding the distribution base for pharmaceuticals. A larger distribution base also created more instances of expiry management, temperature excursions, and product redistribution. These returns needed controlled handling because product condition and records could determine whether goods could be returned, recovered, or removed from circulation. Cold-chain requirements raised the infrastructure standard for these reverse flows. Providers needed reliable records, temperature monitoring, and chain-of-custody documentation across every transport leg. The requirements made standard parcel processes unsuitable for many pharmaceutical returns, particularly those involving sensitive products. DSV’s 2026 Healthcare Logistics Excellence Workshop involved more than 60 pharmaceutical manufacturers and medical-device distributors. The participation showed that traceability and compliance remained active priorities across the sector. Certified operators could command stronger pricing where domestic carriers lacked comparable facilities. They also had a clearer basis for serving manufacturers and distributors that required documented reverse procedures. This compliance setting supported sustained demand for specialist reverse handling within the Indonesia reverse logistics market.
Geography Analysis
Java, including Jakarta and BOD, held 67.23% of the Indonesia reverse logistics market share in 2025. Population density, fulfillment hubs, and e-commerce activity concentrated both return generation and processing capacity on the island. Java contributed 56.93% of national economic activity, which supported its large volume of consumer return flows. DHL Express Indonesia had 7 gateways, 25 operational facilities, more than 70 daily flights, and investments above USD 20 million in its Jakarta gateway as of August 2026. DHL opened a Surabaya processing center in December 2025, adding capacity in East Java. SiCepat’s 470 hubs and 61 operational warehouses also showed the density of the established Java corridor. As e-commerce penetration matured in accessible clusters, more incremental return growth moved beyond Java.
Kalimantan recorded the highest forecast CAGR at 13.67% from 2026 to 2031. IKN Phase II for 2025-2029 has a government budget of USD 3.01 billion and increases inbound cargo activity in the region. Pelindo launched the first international container export service from Terminal Kijing in West Kalimantan in June 2026. The terminal handled 4 million tonnes in 2025, compared with 1.95 million tonnes in 2023. The Greater Nusantara plan linked 5 East Kalimantan jurisdictions through a coordinated transport and supply-chain system. These developments improved the case for private logistics investment. Sumatra remained the second-largest regional area, although its outbound commodity profile and limited inbound cargo created empty-container repositioning costs.
Sulawesi had room for growth in consumer electronics and food returns as e-commerce activity increased in Makassar and secondary cities. A 2024 cold-chain study showed that 50% of examined facilities in Siak Regency lacked dedicated cold-chain infrastructure. That gap created compliance risk and an opening for certified operators in eastern Indonesia. Bali and Nusa Tenggara had seasonal return patterns linked to tourism-driven retail activity. Providers that handled time-sensitive recovery flows could address this specialized demand. Papua Region and Maluku Islands remained underserved because limited roads and reliance on sea and air services increased transport costs. Organized reverse flows in these areas were most viable for operators with government mandates, healthcare contracts, or institutional programs.
Competitive Landscape
The Indonesia reverse logistics market had moderate competitive intensity in Java consumer returns and lower competitive density in specialized and outer-island services. Global 3PLs such as DHL Group, DSV A/S, Kuehne+Nagel International AG, and CEVA Logistics competed for pharmaceutical, electronics, and cross-border return flows. These activities required stronger chain-of-custody procedures and certified storage. DSV’s GDP-compliant J1 and B12 facilities near Soekarno-Hatta Airport included climate-controlled storage, secure containment areas, and real-time inventory tracking. Kuehne+Nagel and CEVA Logistics developed capabilities around repair, refurbishment, and remanufacturing. GEODIS and Rhenus Group also had Indonesian operations that could support pharmaceutical and cross-border return volumes. These capabilities placed global operators in a favorable position for regulated, high-value returns. Their advantage rested on facilities and documented processes that were difficult to establish quickly, particularly where a return needed secure storage, environmental controls, condition assessment, product traceability, and a clearly recorded handover from collection through recovery, resale, repair, or compliant final disposition.
Domestic operators competed through network breadth, parcel pricing, and marketplace integration. J&T Express, SiCepat Ekspres, JNE Express, and Ninja Xpress handled high consumer-goods return volumes from marketplace channels. SiCepat launched SiCepat Logistik in July 2026, adding B2B supply chain, warehousing, FTL and LTL trucking, multimodal sea freight, freight forwarding, and customs clearance. The move extended its role from courier operations toward integrated logistics services. The planned consolidation of 9 state-owned logistics entities under Pos Indonesia began initial steps in July 2026. Pos Indonesia’s service-point network may align with future producer take-back collection requirements. This national reach can help it collect goods nearer to consumers, reduce reliance on distant collection points, and connect collection activity with broader transport, sorting, warehousing, and recovery arrangements across the archipelago.
Outer-island return consolidation remained open territory, particularly in Sulawesi, Kalimantan, and Papua. No provider held a defensible position across these fragmented flows. LIQUID8 secured pre-seed funding from SPIL Ventures in February 2025 to scale its recommerce and inventory-recovery platform. Its model supported resale of returned and undelivered inventory that traditional carriers did not typically manage. This introduced a specialized competitor focused on value recovery rather than only transport. The Indonesia reverse logistics industry, therefore, included both scale-led carriers and firms focused on downstream disposition. The coexistence of these models reflected the fact that returned goods had different commercial outcomes, ranging from a fast restockable parcel to stock needing repair, resale preparation, recycling, or a controlled removal process. It also meant that a carrier’s network scale alone did not determine its ability to capture value after an item had been collected.
Indonesia Reverse Logistics Industry Leaders
-
DHL Group
-
JNE Express
-
J&T Express
-
Ninja Van
-
SPX Express
- *Disclaimer: Major Players sorted in no particular order

Recent Industry Developments
- August 2026: DHL Express Indonesia announced an expansion strategy to position Indonesia as an Asia-Pacific logistics hub, including the construction of a new facility in Batam and a dedicated daily Batam-Singapore cargo vessel for electronics manufacturing supply-chain activity.
- July 2026: SiCepat Ekspres launched SiCepat Logistik, expanding into B2B supply chain, warehousing, FTL and LTL trucking, multimodal sea freight, freight forwarding, and customs clearance.
- April 2026: Ninja Xpress launched Ninja Cross Border, allowing Indonesian SME sellers to ship to more than 40 countries across Asia-Pacific, the Middle East, and Western Europe.
- December 2025: DHL Express Indonesia opened a processing center in Surabaya, strengthening e-commerce and return-flow processing capacity in East Java.


Indonesia Reverse Logistics Market Report Scope
| Transportation | Road |
| Air | |
| Other Modes | |
| Warehousing (Storage, Distribution, Consolidation) | |
| Other Value-added Services (Return Processing, Restocking, Refurbishment, Disposition) |
| Consumer and Retail |
| Home and Decor |
| Healthcare and Pharmaceuticals |
| FMCG |
| Other End Users |
| Java (Jakarta and BOD) |
| Sumatra |
| Kalimantan |
| Sulawesi |
| Bali and Nusa Tenggara |
| Papua Region and Maluku Islands |
| By Reverse Logistics Function | Transportation | Road |
| Air | ||
| Other Modes | ||
| Warehousing (Storage, Distribution, Consolidation) | ||
| Other Value-added Services (Return Processing, Restocking, Refurbishment, Disposition) | ||
| By End-user Industry | Consumer and Retail | |
| Home and Decor | ||
| Healthcare and Pharmaceuticals | ||
| FMCG | ||
| Other End Users | ||
| By Region | Java (Jakarta and BOD) | |
| Sumatra | ||
| Kalimantan | ||
| Sulawesi | ||
| Bali and Nusa Tenggara | ||
| Papua Region and Maluku Islands |


Key Questions Answered in the Report
What was the value of Indonesia’s reverse logistics sector in 2026?
The sector is valued at USD 8.29 billion in 2026 and is forecast to reach USD 12.81 billion by 2031.
What growth rate is forecast for reverse logistics in Indonesia through 2031?
The forecast CAGR is 9.09% for 2026-2031.
Which reverse logistics function held the largest share in Indonesia?
Transportation held 43.25% share in 2025 because return movements across islands and cities generated substantial transport demand.
Which end-user segment grew fastest through 2031?
Healthcare and pharmaceuticals recorded the highest forecast CAGR at 11.34%, supported by controlled handling and compliance needs.
Which Indonesian region grew fastest for reverse logistics?
Kalimantan recorded the highest projected CAGR at 13.67% from 2026 to 2031, supported by infrastructure and IKN-related development.
Why do Indonesian e-commerce returns need specialized logistics services?
Cash-on-delivery failures, consumer returns, fragmented geography, and product-recovery needs increased the need for collection, tracking, and processing services.
Page last updated on:





