
Indonesia Manufacturing Logistics Market Size and Share
Market Overview
| Study Period | 2021 - 2031 |
|---|---|
| Forecast Data Period | 2026 - 2031 |
| Base Year Market Size (2025) | USD 37.78 Billion |
| Market Size (2026) | USD 40.55 Billion |
| Market Size (2031) | USD 54.92 Billion |
| Growth Rate (2026 - 2031) | 6.25 % |
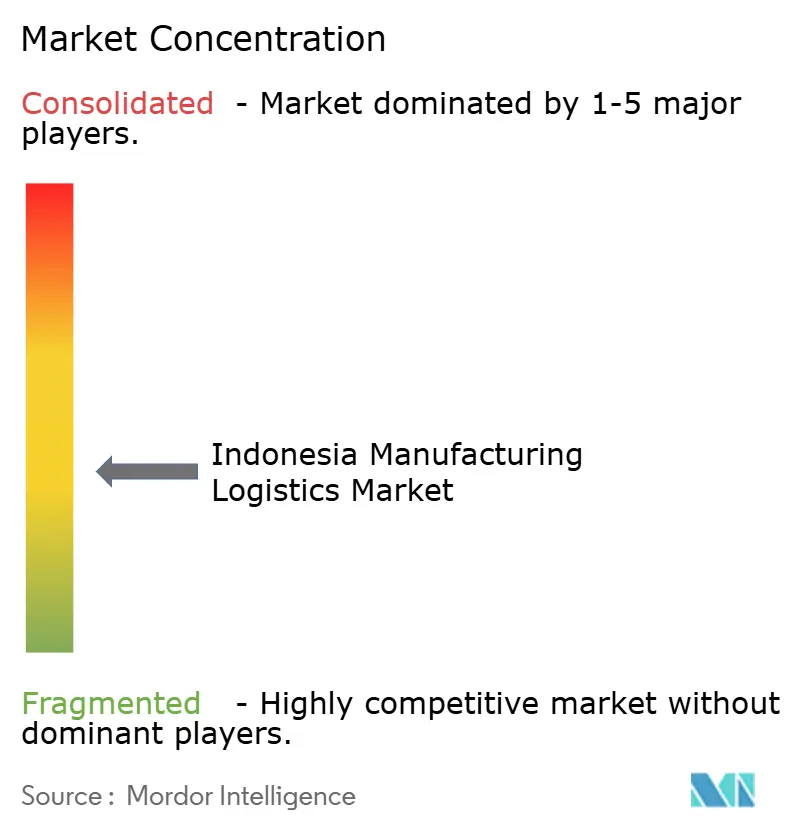
| Market Concentration | Medium |
Major Players *Disclaimer: Major Players sorted in no particular order Image © Mordor Intelligence. Reuse requires attribution under CC BY 4.0. | |
Indonesia Manufacturing Logistics Market Analysis by Mordor Intelligence
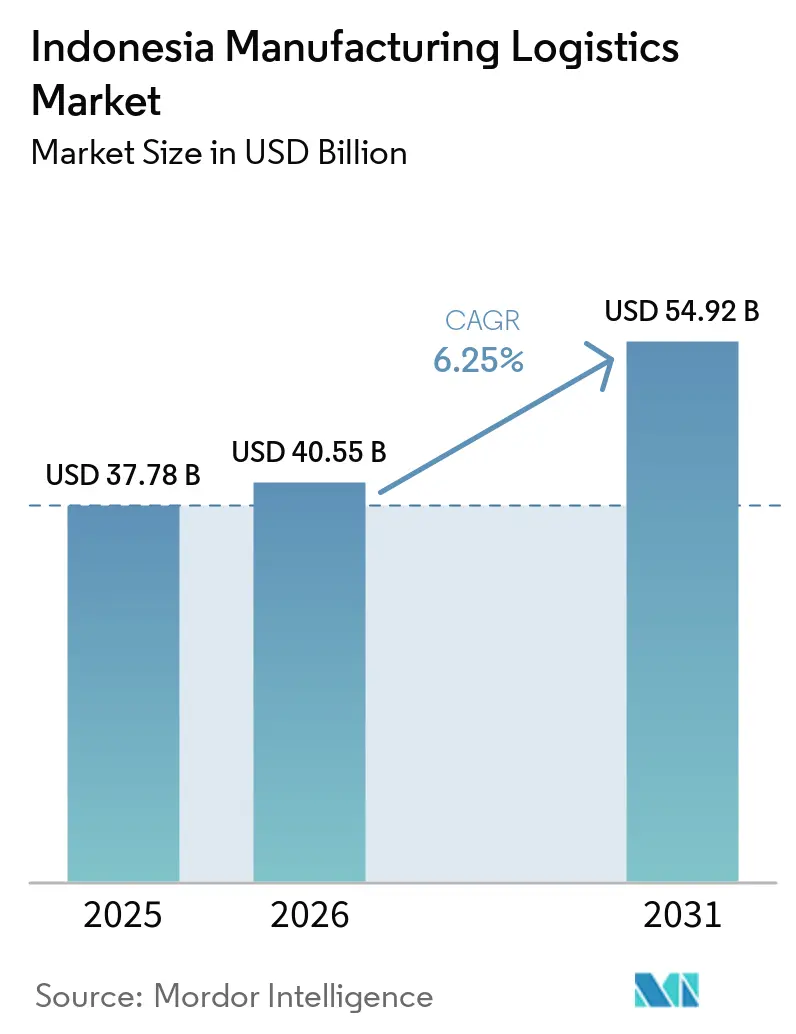
The Indonesia manufacturing logistics market size was valued at USD 37.78 billion in 2025 and is estimated to grow from USD 40.55 billion in 2026 to reach USD 54.92 billion by 2031, registering at a CAGR of 6.25% from 2026 to 2031.
Manufacturing activity continued to support freight volumes, storage demand, and outsourced supply-chain services across the archipelago. Non-oil and gas manufacturing grew 5.3% year over year in the second quarter of 2026, ahead of national GDP growth of 5.3%.[1]Central Bureau of Statistics of Indonesia and Ministry of Industry of Indonesia, “Manufacturing Growth Outpaces Indonesia’s Economy in Q2 2026,” Voice of Indonesia, rri.co.id The Indonesia manufacturing logistics market is also being shaped by export-oriented industrial investment and the need to connect production sites outside Java with ports and customers. Providers that combine transport capacity with reliable warehousing, customs support, and digital visibility are better placed to serve these changing requirements. Infrastructure projects and cold-chain investment can widen service coverage, although uncertain logistics policy and uneven inter-island connectivity may slow implementation.
Key Report Takeaways
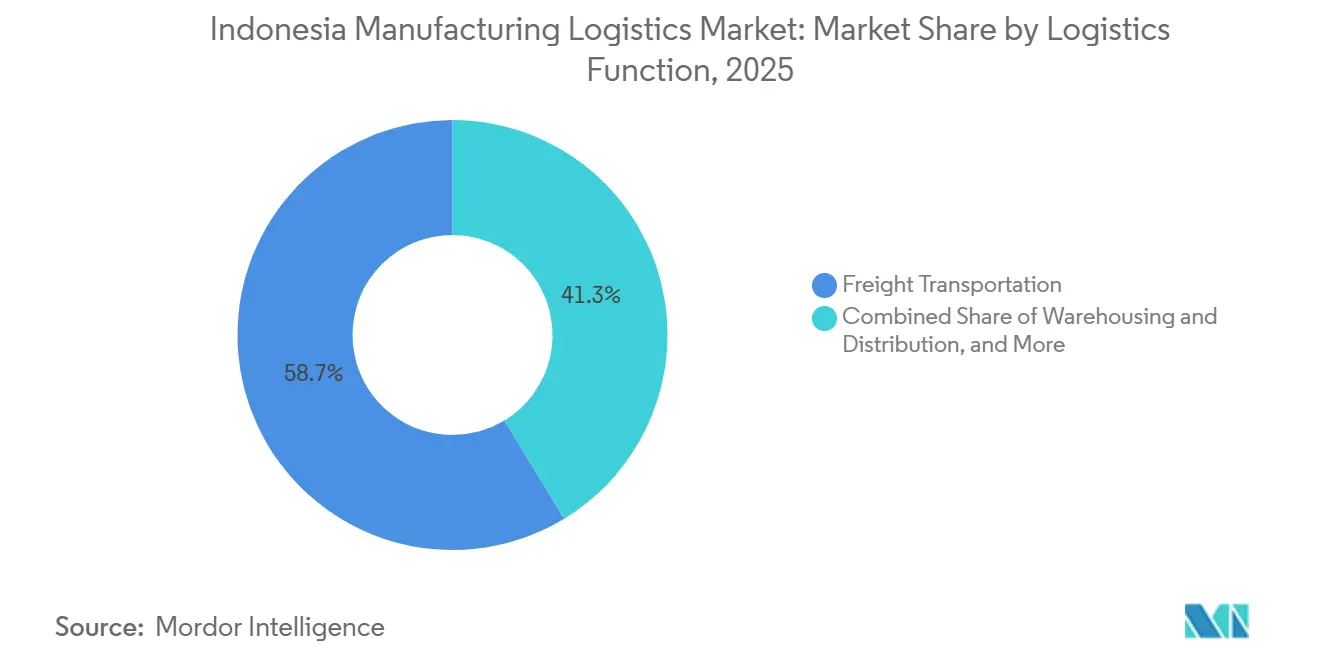
- By logistics function, freight transportation held 58.65% of the Indonesia manufacturing logistics market share in 2025, while warehousing and distribution is forecast to grow at a 7.50% CAGR through 2031.
- By manufacturing industry, food and beverage accounted for 37.39% of the Indonesia manufacturing logistics market size in 2025, while electronics and electrical is forecast to expand at a 9.56% CAGR through 2031.
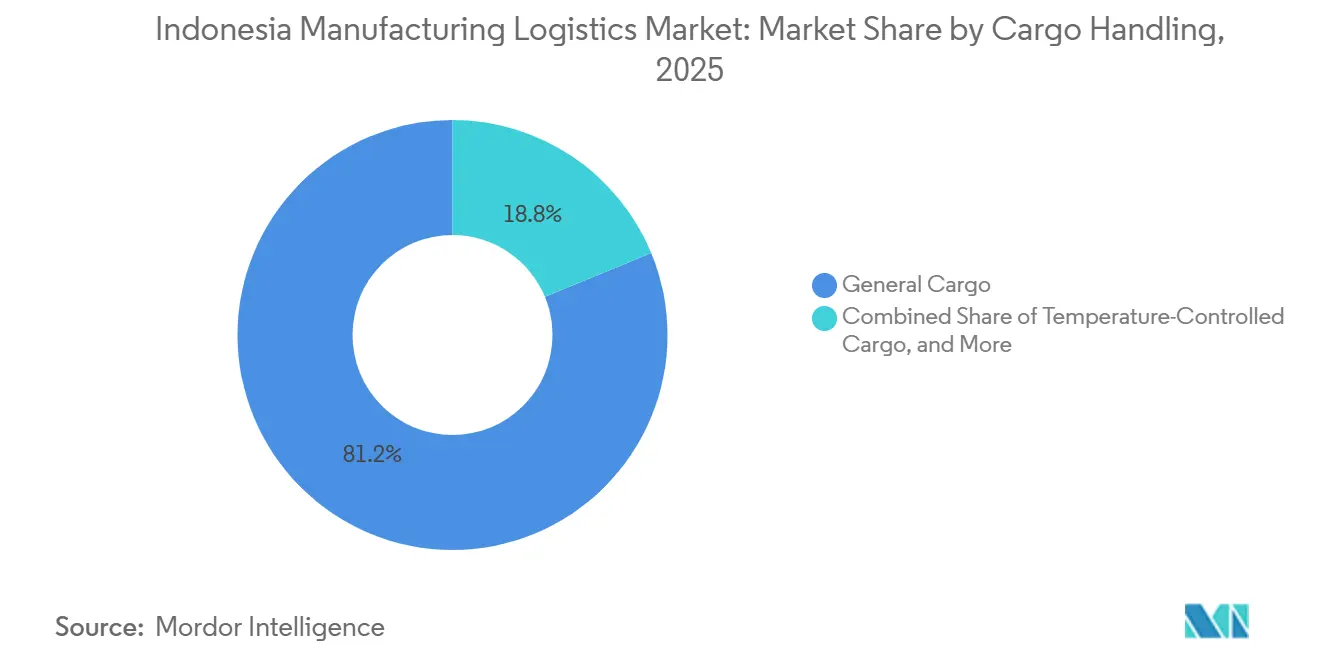
- By cargo handling, general cargo held 81.23% of the Indonesia manufacturing logistics market share in 2025, while temperature-controlled cargo is forecast to grow at an 8.59% CAGR through 2031.
- By destination, domestic routes accounted for 61.24% of the Indonesia manufacturing logistics market size in 2025, while international and cross-border freight are forecast to expand at a 10.96% CAGR through 2031.
- By region, Java, including Jakarta and BOD, held 38.68% of revenue in 2025, while Sulawesi is forecast to grow at a 9.68% CAGR through 2031.
Note: Market size and forecast figures in this report are generated using Mordor Intelligence’s proprietary estimation framework, updated with the latest available data and insights as of January 2026.
Indonesia Manufacturing Logistics Market Trends and Insights
Drivers Impact Analysis*
| Driver | (~) % Impact on CAGR Forecast | Geographic Relevance | Impact Timeline |
|---|---|---|---|
| Manufacturing Export and Industrial Corridor Expansion | +1.8% | Java and Sumatra corridors, with spillover to Sulawesi and Kalimantan special economic zones | Long term (≥ 4 years) |
| National Logistics Ecosystem Digitalization | +1.4% | National, centered on Java ports and major trade corridors | Medium term (2-4 years) |
| Toll Road, Port, and Airport Capacity Expansion | +1.0% | Java and Sumatra, followed by Sulawesi and Kalimantan | Long term (≥ 4 years) |
| Cold-Chain Demand from Food, Seafood, And Pharmaceuticals | +0.8% | Java, Sumatra, Sulawesi, and Maluku | Medium term (2-4 years) |
| Factory Automation and Real-Time Inventory Visibility | +0.5% | Java industrial clusters, with expansion to Batam and the Riau Islands | Medium term (2-4 years) |
| Battery, EV, and Electronics Supply-Chain Localization | +0.3% | West Java, North Maluku, and East Java | Long term (≥ 4 years) |
| Source: Mordor Intelligence | |||
Manufacturing Export and Industrial Corridor Expansion
Indonesia recorded USD 187.8 billion in non-oil and gas manufacturing exports from January through October 2025, equal to 80.3% of national exports and 15.8% higher than the prior year. Manufacturing investment reached IDR 182 trillion (USD 10.86 billion) in the first quarter of 2026, or 36.5% of national investment. Special economic zones recorded IDR 44 trillion (USD 2.63 billion) in exports during 2025.[2]Coordinating Ministry for Economic Affairs of Indonesia and KEK Secretariat, “SEZ Performance Grows Solid, Investment, Exports and Employment Continue to Grow,” Kawasan Ekonomi Khusus, kek.go.id Alumina, oleochemicals, and processed copper require more specialized handling than basic bulk cargo. Regulation No. 26 of 2025 promotes logistics integration within accredited industrial estates from January 2026. These conditions raise demand for freight forwarding, customs support, and warehouse services close to production sites.
National Logistics Ecosystem Digitalization
The National Logistics Ecosystem was deployed at 46 seaports and 6 airports by October 2024, covering 97% of sea cargo and 98% of air cargo volume.[3]World Customs Organization, “National Logistics Ecosystem, Indonesia’s Holistic Approach to Trade,” WCO News Magazine, mag.wcoomd.org A survey cited by the World Customs Organization found that implementation reduced clearance processing time by 57.7% and processing costs by 37.6%. Shared submission systems, tracking tools, and port gates support more predictable handoffs between customs, quarantine, and shipping processes. The presidential instruction supporting the program expired at the end of 2025. The government had prepared a regulation covering connectivity, service digitalization, and workforce development. The regulatory gap may delay investment in interoperable logistics systems.
Toll Road, Port, and Airport Capacity Expansion
Indonesia’s 2025 to 2029 toll road plan covered 45 sections, with a target of 2,461 km of operational roads and IDR 725 trillion (USD 43.26 billion) in investment.[4]Ministry of Public Works and Public Housing of Indonesia, “Rencana Umum Jalan Tol 2025–2029,” Ministry of Public Works and Public Housing of Indonesia, jdih.pu.go.idBetter road access can reduce factory-to-port travel time across Java and Sumatra. PT PP began the USD 143 million New Priok Eastern Access Section II project in 2025, linking the Nusantara Bonded Zone with New Priok Container Terminal 1. The Patimban Access Toll Road is under construction to improve access to Patimban Port. Port expansion is also planned at Makassar, Belawan, and Tanjung Perak. Coordinated delivery of roads, terminals, and industrial infrastructure will determine the operational benefit.
Battery, EV, and Electronics Supply-Chain Localization
Indonesia presented USD 121 billion in electric-vehicle battery ecosystem opportunities during June 2026. The opportunities extend from mineral processing and battery materials to cell production and vehicle assembly. The Dragon Project battery plant in Karawang was launched in June 2025, with upstream and midstream projects in East Halmahera. Electronics manufacturers also use the Batam to Singapore air cargo route and the Semarang customs gateway operated by DHL Express. Battery cells, power electronics, and sensitive components require secure handling and suitable storage conditions. This activity supports specialized logistics capacity in West Java, North Maluku, and East Java.
Restraints Impact Analysis*
| Restraint | (~) % Impact on CAGR Forecast | Geographic Relevance | Impact Timeline |
|---|---|---|---|
| Inter-Island Infrastructure and Transshipment Complexity | -1.2% | Eastern Indonesia, Kalimantan, and Sulawesi | Long term (≥ 4 years) |
| Port Congestion and Urban Trucking Delays | -0.9% | Java, Batam, and Medan freight corridors | Short term (≤ 2 years) |
| Fragmented Regulation and Digital Interoperability | -0.6% | National, particularly cross-border and multi-island routes | Medium term (2-4 years) |
| Skilled Logistics Labor and Alternative-Fuel Infrastructure Gaps | -0.3% | National, with pressure in Java and outer-island regions | Medium term (2-4 years) |
| Source: Mordor Intelligence | |||
Inter-Island Infrastructure and Transshipment Complexity
Empty container repositioning and low return-voyage utilization increase round-trip costs for manufacturers outside Java and Sumatra. A 2025 assessment ranked West Kalimantan’s physical infrastructure second lowest nationally. While only 58.7% of Sea Toll program ports met basic infrastructure requirements, westbound backhaul utilization remained below 25%. Research on eastern Indonesian ports found that deeper basins could lift vessel carrying capacity by up to 35% and reduce regional logistics costs by 22% to 28%. These upgrades need long-term public funding and execution. Uneven enforcement of service requirements across Sea Toll ports also limits consistent operating conditions.
Fragmented Regulation and Digital Interoperability
The expiry of the National Logistics Ecosystem mandate at the end of 2025 created uncertainty for platform integration. The proposed national logistics regulation covers infrastructure, digital services, and workforce development. Cross-border and multi-island movements require coordination across several agencies and operating systems. Inconsistent standards can slow customs, quarantine, and transport processes. This is particularly material for manufacturers that need reliable export documentation and shipment visibility. A clear successor framework would support technology investment and more consistent data exchange.
*Our forecasts treat driver/restraint impacts as directional, not additive. The impact forecasts reflect baseline growth, mix effects, and variable interactions.
Segment Analysis
By Logistics Function: Freight Transportation Leads Revenue, While Warehousing Expands Fastest
Freight transportation held 58.65% of the Indonesia manufacturing logistics market share in 2025. The position reflects road-based movements within Java’s industrial corridors. Trucking supports factory-to-port and interstate distribution in the country’s largest production areas. Sea and inland waterway freight connects manufacturing centers across the islands. Rail freight remains limited outside Java and Sumatra. The government’s 2025 to 2029 rail agenda includes track development on islands without rail service. Air freight serves high-value and time-sensitive electronics and pharmaceutical shipments. These modes give manufacturers different options based on cargo value, delivery needs, and location.
Warehousing and distribution are forecast to grow at a 7.50% CAGR through 2031. Manufacturers are moving from in-house storage toward outsourced and system-managed distribution. Supply Chain Management and Value-Added Logistics is smaller, but it is gaining demand from global original equipment manufacturers. These companies require inbound sequencing, kitting, and vendor-managed inventory. Regulation No. 26 of 2025 requires logistics integration in accredited industrial zones from January 2026. This requirement can encourage third-party warehouse partnerships. KION Group established a direct warehouse automation entity in Jakarta in 2025. The Indonesia manufacturing logistics industry is consequently seeing more demand for integrated storage and handling capabilities.



By Manufacturing Industry: Food And Beverage Holds Scale, While Electronics and Electrical Accelerates
Food and beverage accounted for 37.39% of the Indonesia manufacturing logistics market size in 2025. A domestic population of 280 million supports broad replenishment needs across the islands. Food and beverage output grew 5.1% in 2025, supporting 5.3 million food and beverage service businesses. Perishable goods increase the need for frequent distribution and suitable storage. Textiles and Apparel, Wood and Furniture, and Rubber and Plastics remain mid-tier contributors. Some lower-value textile production has moved toward Central Java locations, including Solo and Semarang. Metals, Fabrication, Machinery, and Equipment demand depends on domestic construction and export activity.
Electronics and electrical is forecast to expand at a 9.56% CAGR between 2026 and 2031. Global original equipment manufacturers are diversifying production locations in Southeast Asia. Batam’s special economic zone has become a beneficiary of this shift. DHL Express established a customs gateway in Semarang in early 2026. It also operates daily cargo services on the Batam to Singapore route for electronics manufacturers. Automotive logistics is also changing as electric-vehicle platforms require careful handling of batteries and power electronics. Chemicals and Pharmaceuticals add demand for secure and temperature-controlled services. These needs raise the value of specialized logistics contracts.
By Cargo Handling: General Cargo Maintains Scale, While Temperature-Controlled Cargo Gains Momentum
General cargo held 81.23% of the Indonesia manufacturing logistics market share in 2025. Metals, textiles, machinery components, and packaged goods are generally moved in standard conditions. The segment reflects the wide range of products made in Indonesia. Food processing, chemicals, furniture, and rubber manufacturing all contribute volumes. Hazardous Cargo includes chemicals, solvents, and industrial gases. It requires certified fleets and storage because handling rules are demanding. High-Value and Sensitive Cargo includes electronics, precision instruments, and pharmaceuticals. These shipments often require tracked, insured, and multimodal services.
Temperature-controlled cargo is forecast to grow at an 8.59% CAGR through 2031. Seafood exports require controlled transport from Sulawesi and Maluku. Processed foods require reliable delivery into domestic modern trade networks. Vaccines and biologic medicines add pharmaceutical cold-chain demand in secondary cities. The 2025 cold-chain summit supported a national roadmap for infrastructure standardization. Operators with compliant equipment can serve a wider range of sensitive cargo needs.
By Destination: Domestic Distribution Holds Revenue, While Cross-Border Freight Grows Fastest
Domestic routes accounted for 61.24% of the Indonesia manufacturing logistics market size in 2025. Manufacturing production consumed within Indonesia represented 78.4% of output during 2025. Distribution across Java, Sumatra, Kalimantan, Sulawesi, and eastern islands requires regular inter-island shipping. The Sea Toll program connected 115 ports across 39 active routes. Operators with established berth access and route frequency have a practical advantage. Domestic activity provides a broad base for existing transport and warehousing providers. It also makes service consistency across multiple islands a central competitive factor.
International and cross-border freight is forecast to grow at an 10.96% CAGR through 2031. The Ministry of Industry aims to lift manufactured exports from 21.6% of output to 30%. Manufacturing exports reached USD 75.6 billion from January through April 2026. They accounted for 82.0% of national exports in that period. Exporters need documentation, forwarding, brokerage, and port-side services. Inland producers also need feeder connections to primary ports. This is increasing the need for consolidation hubs and bonded logistics facilities. The Indonesia manufacturing logistics market is therefore gaining more exposure to export-service requirements.
Geography Analysis
Java accounted for 38.68% of revenue in 2025. The region contains the largest concentration of industrial estates, factories, and export infrastructure. Tanjung Priok handles more than half of Indonesia’s maritime cargo. Patimban Port is being developed to absorb automotive and containerized export flows. The Trans-Java Toll Road supports factory-to-port movements between Jakarta and Surabaya. Sumatra is the second largest regional contributor because of palm oil, rubber, petrochemicals, textiles, and related manufacturing. Port access constraints at Belawan continue to raise logistics costs in northern Sumatra. Planned terminal expansion is intended to improve throughput through 2028.
Sulawesi is forecast to grow at a 9.68% CAGR from 2026 to 2031. Nickel downstreaming, seafood exports, aquaculture, and special economic zone activity are increasing demand around Makassar. Port expansion at Makassar is intended to support mineral processing exports and agricultural distribution. Kalimantan is supported by mineral extraction, palm oil processing, and activities related to the Nusantara capital relocation. West Kalimantan’s infrastructure position remains a constraint. Sea Toll services connect Kalimantan to the national network. Backhaul imbalances still increase effective logistics costs for operators and manufacturers.
Bali and Nusa Tenggara have smaller manufacturing logistics activity centered on tourism-linked food processing and handicrafts. Ngurah Rai airport supports time-sensitive export shipments from Bali. Papua and the Maluku Islands face the largest infrastructure gaps within the archipelago. Their ports have limited capacity for rising mineral and fisheries cargo. Research has found that improved berth dimensions and basin depth could raise cargo-handling efficiency by up to 40% in eastern Indonesia. Current investment levels have not captured this potential. Cold-chain investment in Maluku and eastern Sulawesi is a practical development route because of seafood export demand.
Competitive Landscape
The Indonesia manufacturing logistics market is moderately fragmented. Global third-party logistics providers and established Indonesian carriers serve different parts of the value chain. DHL Group, Kuehne+Nagel, A.P. Moller-Maersk, CEVA Logistics, DSV, and GEODIS are active in international forwarding, customs brokerage, and complex supply-chain management. PT Samudera Indonesia, Meratus Group, PT Puninar Logistics, PT Kamadjaja Logistics, and PT TEMAS serve inter-island shipping and Java-based domestic distribution. Local route knowledge and regulatory relationships matter in domestic networks. Global providers benefit from international network reach and specialized supply-chain systems. Competition is increasingly focused on long-term logistics contracts rather than one-off freight moves.
Technology is becoming a more important basis for service differentiation. Autonomous mobile robots, automated storage and retrieval systems, and fleet management software are moving into larger logistics sites in Cikarang, Karawang, and Surabaya. A.P. Moller-Maersk received Bonded Logistics Center approval in Semarang during August 2026. The approval allows duty deferral on imported inputs for export-oriented manufacturers. It gives Maersk a stronger position in Central Java’s textiles, garments, and machinery export flows. KION Group established its direct Jakarta operation for warehouse automation in 2025. This move reflects rising demand for automated material handling and fleet management.
DHL Express expanded its Jakarta Gateway and Surabaya Gateway and established a customs gateway in Semarang during early 2026. The company also introduced a direct Singapore to Semarang air freight route for the Solo, Semarang, and Yogyakarta manufacturing corridor. Opportunities remain in pharmaceutical cold chains outside Java and in secure handling for electronics components. Digital freight matching may also help Sumatra manufacturers find more cost-effective cross-island consolidation. Kargo Technologies is applying digital freight marketplaces to trucking brokerage. Incumbent providers may need stronger digital carrier management to defend trucking volumes.
Indonesia Manufacturing Logistics Industry Leaders
DHL Group
DSV A/S
PT Samudera Indonesia Tbk
Kuehne+Nagel International AG
PT Puninar Logistics
- *Disclaimer: Major Players sorted in no particular order

Recent Industry Developments
- August 2026: A.P. Moller-Maersk's logistics entity in Indonesia received Bonded Logistics Center facility approval from the Directorate General of Customs and Excise in Semarang, with a recorded investment value of IDR 13 billion (USD 78 million). The approval enables duty deferral on imported inputs for export-oriented manufacturers served from the Semarang hub.
- August 2026: DHL Express Indonesia disclosed investments exceeding USD 20 million for the Jakarta Gateway expansion and more than USD 10 million for the Surabaya Gateway. The company also established a customs gateway in Semarang and launched a direct Singapore to Semarang air freight route.
- June 2026: BRIN and PT Denso Manufacturing Indonesia signed a research partnership in Cikarang for multi-AGV coordination, automated route scheduling, and material-flow automation
- December 2025: DHL Express Indonesia inaugurated its upgraded Surabaya Gateway facility to strengthen air freight connectivity for East Java and nearby regions.


Indonesia Manufacturing Logistics Market Report Scope
| Freight Transportation | Road Freight |
| Rail Freight | |
| Air Freight | |
| Sea and Inland Waterway Freight | |
| Warehousing and Distribution | |
| Supply Chain Management and Value-Added Logistics |
| Food and Beverage |
| Textiles and Apparel |
| Wood and Furniture |
| Chemicals and Pharmaceuticals |
| Rubber and Plastics |
| Metals and Fabrication |
| Electronics and Electrical |
| Machinery and Equipment |
| Automotive and Transportation Equipment |
| Other Manufacturing Industries |
| General Cargo |
| Temperature-Controlled Cargo |
| Hazardous Cargo |
| High-Value / Sensitive Cargo |
| Domestic |
| International / Cross-Border |
| Java (Jakarta & BOD) |
| Sumatra |
| Kalimantan |
| Sulawesi |
| Bali and Nusa Tenggara |
| Papua Region and Maluku Islands |
| By Logistics Function | Freight Transportation | Road Freight |
| Rail Freight | ||
| Air Freight | ||
| Sea and Inland Waterway Freight | ||
| Warehousing and Distribution | ||
| Supply Chain Management and Value-Added Logistics | ||
| By Manufacturing Industry | Food and Beverage | |
| Textiles and Apparel | ||
| Wood and Furniture | ||
| Chemicals and Pharmaceuticals | ||
| Rubber and Plastics | ||
| Metals and Fabrication | ||
| Electronics and Electrical | ||
| Machinery and Equipment | ||
| Automotive and Transportation Equipment | ||
| Other Manufacturing Industries | ||
| By Cargo Handling | General Cargo | |
| Temperature-Controlled Cargo | ||
| Hazardous Cargo | ||
| High-Value / Sensitive Cargo | ||
| By Destination | Domestic | |
| International / Cross-Border | ||
| By Region | Java (Jakarta & BOD) | |
| Sumatra | ||
| Kalimantan | ||
| Sulawesi | ||
| Bali and Nusa Tenggara | ||
| Papua Region and Maluku Islands |


Key Questions Answered in the Report
What is the projected value of Indonesia manufacturing logistics in 2031?
The sector is forecast to reach USD 54.92 billion by 2031, growing at a 6.25% CAGR from 2026 to 2031.
Which logistics function leads Indonesia manufacturing logistics revenue?
Freight transportation led revenue with 58.65% in 2025, supported by road freight in Java and inter-island shipping.
Which manufacturing sector has the fastest logistics growth in Indonesia?
Electronics and electrical are forecast to grow at a 9.56% CAGR through 2031, supported by supply-chain localization and Batam activity.
Why is temperature-controlled cargo expanding in Indonesia?
Food distribution, seafood exports, vaccines, and biologic medicines support its forecast 8.59% CAGR through 2031.
Which region is growing fastest for manufacturing logistics services?
Sulawesi is forecast to grow at a 9.68% CAGR through 2031, supported by nickel processing, seafood exports, and special economic zones.
What is the main operational challenge for manufacturing supply chains across Indonesia?
Uneven port infrastructure, low backhaul utilization, and urban trucking congestion increase cost and reduce delivery reliability.
Page last updated on:





