
Indonesia Last Mile Delivery Market Size and Share
Market Overview
| Study Period | 2020 - 2031 |
|---|---|
| Forecast Data Period | 2026 - 2031 |
| Base Year Market Size (2025) | USD 3.33 Billion |
| Market Size (2026) | USD 3.60 Billion |
| Market Size (2031) | USD 5.03 Billion |
| Growth Rate (2026 - 2031) | 6.95 % |
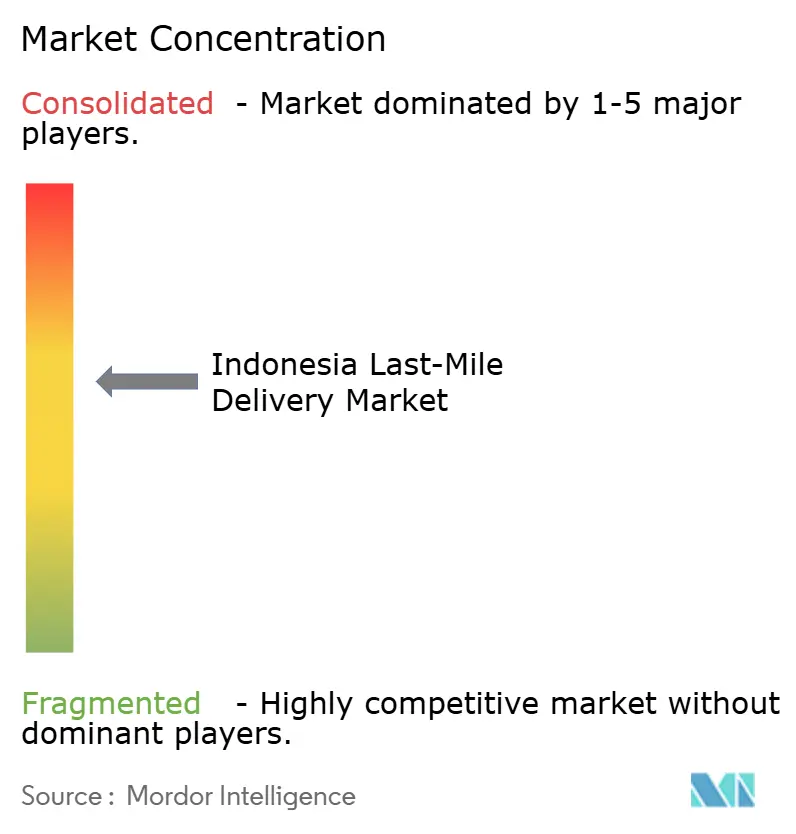
| Market Concentration | Medium |
Major Players *Disclaimer: Major Players sorted in no particular order Image © Mordor Intelligence. Reuse requires attribution under CC BY 4.0. | |
Indonesia Last Mile Delivery Market Analysis by Mordor Intelligence
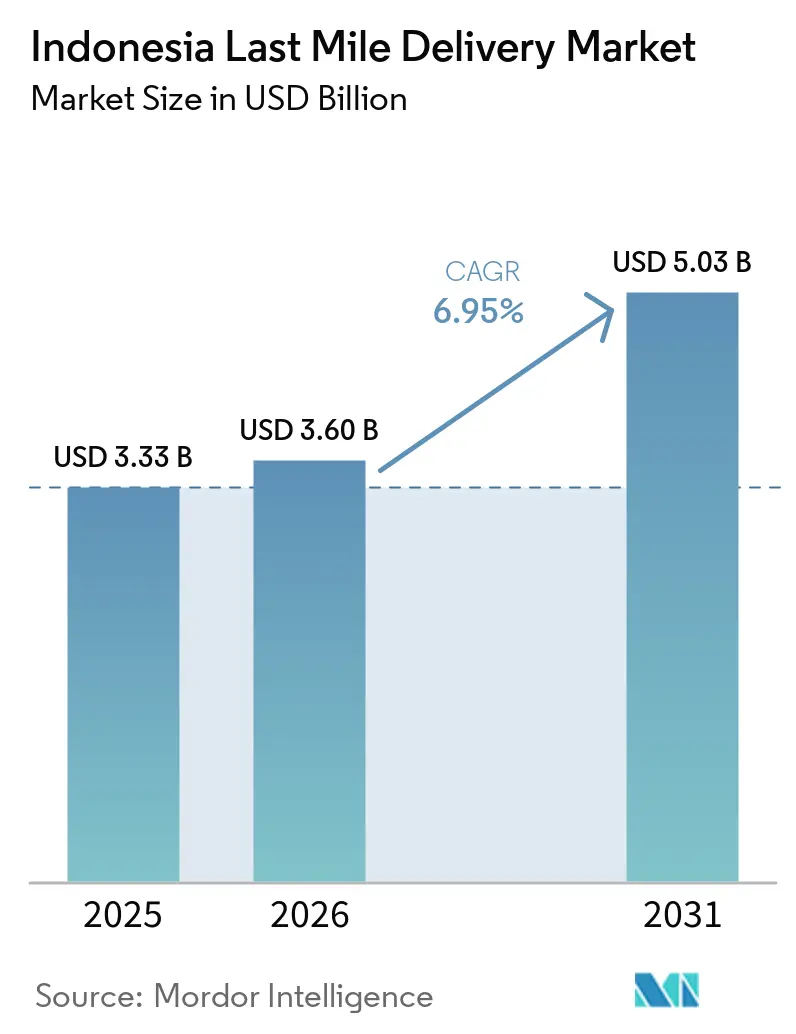
The Indonesia last mile delivery market size was valued at USD 3.33 billion in 2025 and estimated to grow from USD 3.60 billion in 2026 to reach USD 5.03 billion by 2031, at a CAGR of 6.95% during the forecast period (2026-2031).
Video commerce processed 2.6 billion transactions in 2025, following 90% growth, and it increased the frequency of smaller, time-sensitive orders. This pattern favors operators with dense urban sorting capacity, flexible delivery fleets, and fast pickup coordination rather than networks centered on intercity trucking. The rising volume of fragmented orders is also increasing the need for efficient parcel consolidation, route optimization, and real-time shipment visibility. Competition is therefore moving toward closer control of route costs, payment collection, and platform integration, as operators seek to improve delivery economics and service reliability. Geographic coverage remains costly beyond Java due to the archipelagic structure and uneven logistics infrastructure, although transport investments and wider QRIS use may improve operating conditions through 2031.
Key Report Takeaways
- By service, standard delivery held 51.28% of Indonesia last mile delivery market size in 2025, while same day delivery is forecast to register at a 9.12% CAGR through 2031.
- By business, B2C held 75.32% of Indonesia last mile delivery revenue share in 2025, while C2C is projected to record the highest CAGR at 13.44% through 2031.
- By product type, fashion and lifestyle held 22.54% of Indonesia last mile delivery market size in 2025, while foods and beverages are forecast to expand at a 10.49% CAGR through 2031.
- By city tier, tier 1 cities held 58.71% of Indonesia last mile delivery market share in 2025, while tier 2 is forecast to register at an 11.47% CAGR through 2031.
- By city, Jakarta held 25.78% of Indonesia last mile delivery market size in 2025, while Makassar is projected to register at a 12.83% CAGR through 2031.
Note: Market size and forecast figures in this report are generated using Mordor Intelligence’s proprietary estimation framework, updated with the latest available data and insights as of January 2026.
Indonesia Last Mile Delivery Market Trends and Insights
Drivers Impact Analysis*
| Driver | (~) % Impact on CAGR Forecast | Geographic Relevance | Impact Timeline |
|---|---|---|---|
| E-Commerce And Marketplace Growth Accelerating Parcel Demand | +2.3% | National, concentrated in Java and Tier 1 cities, with expansion into Tier 2 cities and Sumatra. | Short term (≤ 2 years) |
| Rising Delivery Speed Expectations Driving Urban Convenience Demand | +1.5% | National, with early acceleration in Jakarta, Surabaya, and Bandung | Short term (≤ 2 years) |
| Digital Payments And Merchant Integration Streamlining Operations | +1.0% | National, with the highest adoption in Java and Bali | Medium term (2-4 years) |
| Logistics Infrastructure Investment Improving Delivery Connectivity | +0.8% | Sumatra, Kalimantan, Sulawesi, and eastern Indonesia | Long term (≥ 4 years) |
| Digital Traceability Standards Improving Visibility And Compliance | +0.5% | National | Medium term (2-4 years) |
| Network Sharing Expanding Coverage Across Remote Areas | +0.4% | Papua, Maluku, and Nusa Tenggara | Long term (≥ 4 years) |
| Source: Mordor Intelligence | |||
E-Commerce And Marketplace Growth Accelerating Parcel Delivery Demand
Indonesia’s e-commerce sector expanded strongly during 2025, with marketplace-led platforms accounting for a significant share of online sales and concentrating courier demand within large order flows. The rapid adoption of video commerce also increased transaction frequency, resulting in more frequent and smaller shipments compared with conventional online shopping. This shift supports demand for flexible fulfillment, parcel consolidation, and last mile delivery capabilities across Indonesia. Live-stream selling requires prompt pickup windows and shorter dispatch intervals after orders are confirmed. Carriers with integrated pickup scheduling and seller dashboards are better placed than counter-based models to process this order pattern. The Indonesia last mile delivery market, therefore, depends increasingly on the ability to connect seller workflows, parcel handover, and shipment tracking within the same operating process.
Rising Delivery Speed Expectations Driving Urban Convenience Demand
Indonesia’s food delivery GMV reached USD 6.4 billion in 2025 and added USD 1 billion in value during the year. Consumers who use rapid food delivery are applying similar delivery expectations to non-food orders. This shift is most visible in Jakarta, Surabaya, and other Tier 1 cities, where order density supports shorter routes. Dark stores and micro-fulfillment operations have improved the practical reach of rapid delivery services. Same day delivery is forecast to register at a 9.12% CAGR through 2031, ahead of other service tiers. In the Indonesia last mile delivery market, fast delivery is becoming a core marketplace requirement in dense urban locations rather than a limited premium option.
Digital Payments And Merchant Integration Streamlining Delivery Operations
Bank Indonesia reported 57 million QRIS users and more than 39 million active merchants in the first quarter of 2025[1]Bank Indonesia, “From COD to QRIS: How Indonesia’s Logistics Industry Reduces Payment Failures,” Xendit, xendit.co. Wider QRIS use gives delivery operators a route away from cash collection at the doorstep. Digital payment collection can reduce disputes associated with cash on delivery and shorten the time needed to remit proceeds to sellers. Pos Indonesia launched COD PosAja! on Shopee in August 2025, extending an integrated COD service beyond conventional courier counters[2]PT Pos Indonesia, “PosIND dan Bina Karya Luncurkan Nusantara Logistics Hub di IKN,” Pos Indonesia, posindonesia.co.id. The service is relevant for rural and remote locations where sellers and buyers still rely on delivery-linked payment options. In the Indonesia last mile delivery market, payment integration and traceability raise the operating standard for providers that seek marketplace agreements.
Logistics Infrastructure Investment Improving Nationwide Delivery Connectivity
The Trans-Sumatra Toll Road had 982 km of operational corridor by August 2026, linking 15 economic corridors from Bakauheni northward. The corridor reduces congestion on routes that previously constrained intercity parcel movement in Sumatra. KAI and the Ministry of Transportation, in July 2026, accelerated planning for Trans-Kalimantan railway development. Kalimantan currently has no operational public railway, so the proposal is relevant to long-term freight access rather than immediate parcel capacity. These projects may improve the connection between sorting centers and local delivery networks outside Java. The Indonesian last mile delivery market has its strongest infrastructure-related opportunity in areas where current network penetration is low, and new transport corridors are planned.
Restraints Impact Analysis*
| Restraint | (~) % Impact on CAGR Forecast | Geographic Relevance | Impact Timeline |
|---|---|---|---|
| Archipelagic Geography Increasing Inter-Island Delivery Complexity And Costs | -1.5% | Papua, Maluku, Nusa Tenggara, Kalimantan, and Sulawesi | Long term (≥ 4 years) |
| Fuel Volatility And Price Competition Compressing Delivery Margins | -1.2% | National, most acute on outer-island and low-density routes | Short term (≤ 2 years) |
| Remote-Zone Delivery Costs Challenging Service-Level Economics | -0.9% | Papua, Maluku, and Nusa Tenggara | Long term (≥ 4 years) |
| Motorcycle Payload Limits And COD Reconciliation: Increasing Complexity | -0.7% | National, most acute in Tier 2 and Tier 3 urban areas | Medium term (2-4 years) |
| Source: Mordor Intelligence | |||
Archipelagic Geography Increasing Inter-Island Delivery Complexity And Costs
Indonesia’s 17,508-island geography keeps delivery costs on outer-island routes 20-40% above Java averages. Shipments to eastern Indonesia often require a motorcycle, a truck, sea freight, and another motorcycle movement. These handoffs add 3-5 touch points to a parcel route and increase the chance of delay, damage, or loss. The resulting service risk limits the service levels that providers can commit to in remote areas. Government plans for shared inter-carrier infrastructure and consolidated sorting capacity to address the need, but their timeline extends beyond the short term. The Indonesia last mile delivery market will therefore continue to face higher charges and lower service consistency in Papua, Maluku, Nusa Tenggara, and other outer-island routes.
Fuel Volatility, Price Competition, And Operating Complexity Compressing Delivery Margins
The Indonesian Courier Association has identified unsustainable tariff competition as a systemic risk for courier operators. J&T Express, SPX Express, and SiCepat accounted for a large share of marketplace parcel activity, which keeps pressure on per-package rates. Fuel-price volatility is especially difficult for operators serving low-density or outer-island routes. Motorcycle payload limits also constrain route economics, while COD reconciliation creates additional administrative work in lower-adoption locations. Electric freight deployment offers a potential response to fuel costs, but the required investment is harder for smaller carriers to fund. The Indonesia last mile delivery market is thus likely to see further pressure on small operators that cannot absorb input increases or build technology and vehicle capabilities.
*Our forecasts treat driver/restraint impacts as directional, not additive. The impact forecasts reflect baseline growth, mix effects, and variable interactions.
Segment Analysis
By Service: Standard Delivery Retains Volume While Same Day Delivery Gains Value
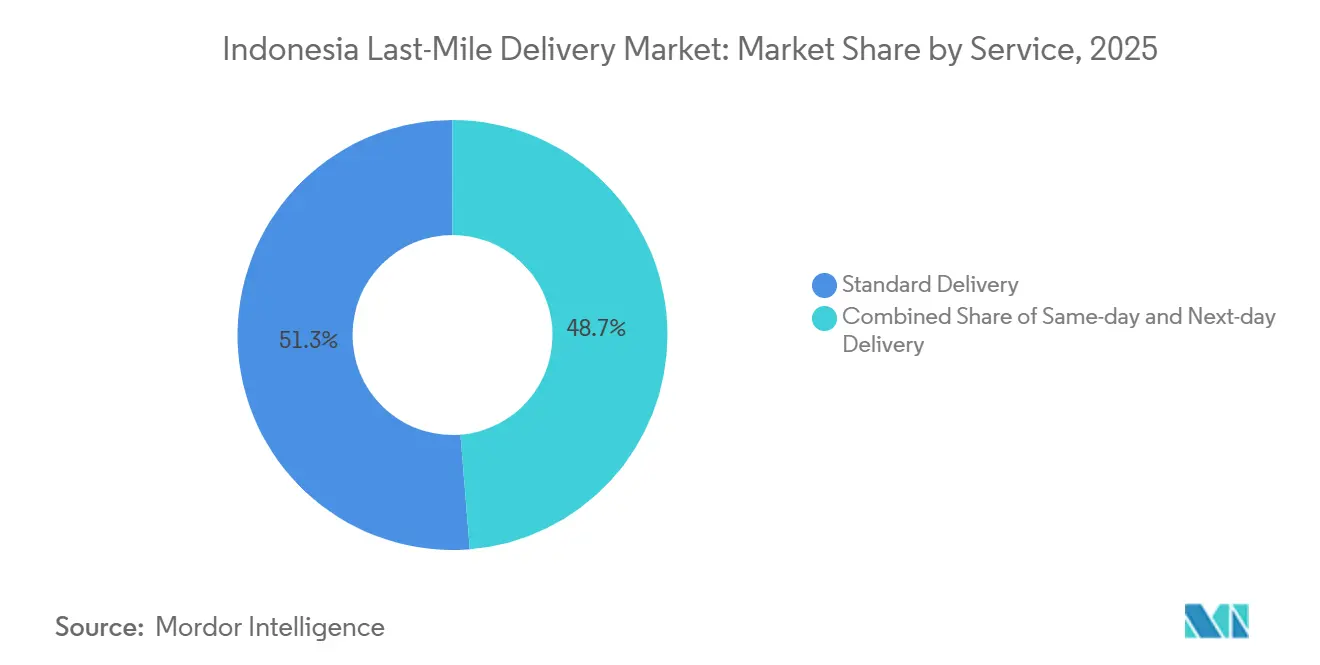
Standard delivery held 51.28% of Indonesia last mile delivery market size in 2025, while same day delivery is forecast to register at a 9.12% CAGR through 2031. Standard services retain the largest role because they offer lower package costs and predictable routing cycles. Their operating model is compatible with consolidated mid-mile truck movements and routine marketplace demand. This makes standard service suitable for non-perishable products where buyers accept a longer delivery window. It also allows carriers to use established sorting capacity across large order volumes. Indonesia's last mile delivery market size associated with standard delivery remains supported by the need for economical fulfillment across diverse consumer categories.
Same day delivery is supported by dense urban fulfillment and demand for faster order completion. Dark stores can position stock closer to buyers and reduce the travel distance from pickup to delivery. This service can command a higher tariff where route density is sufficient to support the cost. Next-day delivery sits between the two models for customers who want faster dispatch but do not want to pay for same day service. Its position is under pressure because sameday services compete at the premium end, while upgraded standard delivery improves at the other end. The service mix will depend on whether carriers can match delivery speed with reliable capacity and manageable route costs.



By Business: B2C Holds Scale While C2C Expands Through Social Commerce
B2C represented 75.32% of Indonesia last mile delivery market share in 2025, while C2C is projected to register at a 13.44% CAGR through 2031. Marketplace platforms generate the order density that makes B2C the dominant business model. Shopee’s 54% share of Indonesia’s 2025 e-commerce GMV illustrates the influence of a major platform on carrier volumes. Carrier selection rules on large platforms can shape national order distribution. B2C delivery also benefits from repeatable collection patterns and relatively standardized shipping requirements. The Indonesia last mile delivery industry relies heavily on these platform relationships because they coordinate seller demand at scale.
B2B services support scheduled flows among manufacturers, distributors, sellers, and fulfillment locations. SAPX Express is pursuing government distribution programs, including Sekolah Rakyat and Koperasi Merah Putih initiatives. C2C activity is growing through social commerce on WhatsApp, Instagram, and TikTok. Individual sellers use these channels to ship directly to buyers without marketplace intermediation. Such orders can be irregular and geographically dispersed, which favors platforms that aggregate multiple carrier options. The Indonesia last mile delivery market may therefore require different service designs for recurring marketplace demand and lower-density seller-to-buyer shipments.
By Product Type: Fashion Leads Revenue While Foods And Beverages Require Specialized Execution
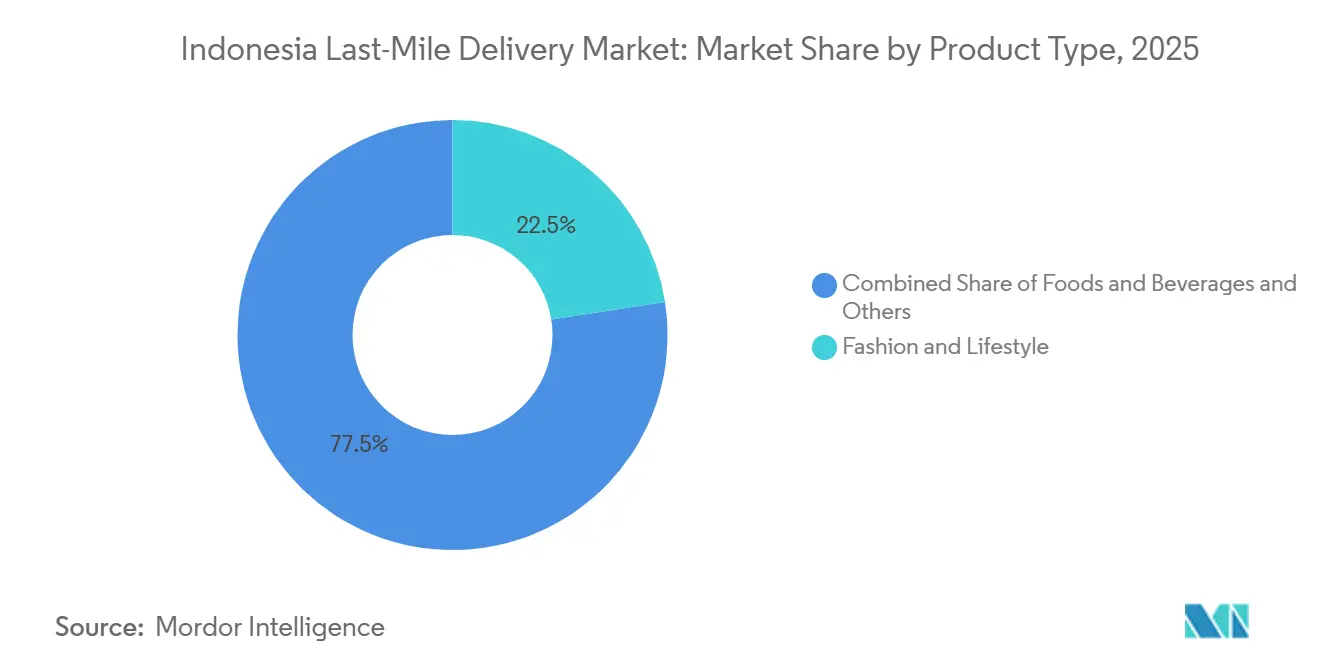
Fashion and lifestyle held 22.54% of Indonesia last mile delivery market share in 2025, while foods and beverages are projected to register at a 10.49% CAGR through 2031. Fashion remains significant because early e-commerce adoption in Indonesia was closely linked with apparel sellers on Tokopedia and Shopee. Apparel returns of 15-25% make reverse logistics an important consideration for B2C fashion contracts. Carriers need clear collection, inspection, and return processes to serve sellers in this category. Fashion volumes also fit well with standard parcel networks because many products are compact and non-perishable. The Indonesia last mile delivery market size for this category is consequently tied to both outbound parcel handling and the ability to manage returns.
Foods and beverage demand reflects Indonesia’s USD 6.4 billion food delivery activity in 2025. Its handling requirements differ from those for apparel because product condition and delivery timing matter more. A 2025 study found that packaging integrity, digital information flow, and crowd logistics improved delivery performance for Indonesian foods and beverage SMEs. This supports the importance of cold-chain capability and traceable shipment information. Personal care, household products, consumer electronics, and furniture provide recurring demand for standard delivery networks. Their varied order patterns help maintain parcel volumes outside the more time-sensitive food segment.
By City Tier: Tier 1 Generates Revenue, While Tier 2 Builds Momentum
Tier 1 cities contributed 58.71% of Indonesia last mile delivery market size in 2025, while tier 2 cities are forecast to register at an 11.47% CAGR through 2031. Jakarta, Surabaya, Bandung, Medan, and Makassar have the route density needed for high asset utilization. J&T Express operated more than 1,000 sorting machines, 500 drop centers, and 2,700 outlets in Indonesia as of June 2026. This scale is most practical where parcel flows are continuous and delivery routes are compact. Tier 1 networks also support more frequent pickup and delivery cycles. Indonesia's last mile delivery market continues to derive much of its revenue from these established urban corridors.
Tier 2 cities are expanding as platforms increase their reach outside Java and route density improves. Palembang, Makassar, and Balikpapan are examples of locations where additional hub investment becomes more viable as order volumes rise. Lower per-package costs can follow once a network has a steadier flow of parcels in both directions. Tier 3 and smaller cities face address ambiguity, lower digital-payment adoption, and higher COD rejection rates. National courier licensing standards set a minimum service coverage floor, but enforcement remains inconsistent in some Tier 3 locations. Expansion into these areas requires carriers to balance access goals against higher operational uncertainty.
Geography Analysis
Jakarta held 25.78% of Indonesia’s last mile delivery market size in 2025, making it the country’s largest city-level market. Its leadership is supported by the concentration of e-commerce consumers, marketplace sellers, fulfillment facilities, courier outlets, and sorting capacity across Greater Jakarta. Dense delivery routes across Jakarta, Tangerang, Bekasi, Depok, and Bogor enable higher courier utilization and more frequent pickup cycles. The city also supports strong demand for same day and instant delivery, particularly for food, fashion, beauty, and convenience-led purchases. As a result, Jakarta remains the primary revenue and operating hub for national last mile delivery providers.
Makassar is forecast to register at a CAGR of 12.83%, during 2026-2031. The city is strengthening its role as a commercial, distribution, and parcel-consolidation gateway for eastern Indonesia. Rising urban consumption, growing marketplace participation, and increasing merchant demand are creating opportunities for courier firms to expand local sorting, pickup, and delivery capacity. Makassar also enables carriers to consolidate shipments arriving from Java before distributing them across Sulawesi and other eastern Indonesian destinations. This positions the city as an important growth market for operators seeking to expand beyond the mature Greater Jakarta corridor.
Other major urban centers, including Surabaya, Bandung, Medan, Palembang, and Balikpapan, remain important to Indonesia’s national last mile delivery network. These cities support parcel demand through large consumer populations, commercial activity, local seller ecosystems, and links to surrounding secondary cities. However, delivery economics vary by city depending on route density, traffic conditions, merchant concentration, local warehouse availability, and dependence on inter-island replenishment. Jakarta will continue to account for the largest share of market revenue, while Makassar’s 12.83% CAGR reflects the stronger expansion potential in emerging urban distribution corridors[3]BIMP-EAGA, “Indonesia Plans Network of Ro-Ros to Link Eastern Regions,” BIMP-EAGA, bimp-eaga. asia.
Competitive Landscape
The Indonesia last mile delivery market is moderately concentrated, but price and service competition remain strong. J&T Express’s January 2026 cross-equity partnership with SF Holding was valued at HKD 8.3 billion (USD 1.06 billion). The arrangement combines J&T’s last mile network across 13 countries with SF Holding’s mainline freight and customs capabilities.
Carriers are seeking differentiation through cross-border services, B2B contracts, and platform integration rather than tariff reductions alone. Ninja Xpress expanded Ninja Cross Border to 45 countries in April 2026. Lion Parcel expanded its INTERPACK service to more than 50 countries across 5 continents in September 2026. SAPX Express is pursuing B2B government distribution programs. Pos Indonesia and SiCepat Ekspres started Integrated Logistics Services in November 2025 to combine their distribution networks, tracking systems, and operating assets[4]PT Pos Indonesia, “Pos Indonesia and SiCepat Ekspres Officially Release First Shipment of Integrated Logistics Services,” Pos Indonesia, posindonesia.co.id. These moves show that delivery coverage and service integration are becoming more important than direct price competition.
Technology investment is also shaping the competitive position of major operators. J&T used real-time AI flow monitoring during the June 2026 Double 6 festival, when its Indonesia volumes increased 112%. Ninja Van’s AI Dispatcher is intended to automate routing decisions and improve peak delivery efficiency. Kargo Technologies planned to deploy 2,500 EVs by the end of 2026 after reporting a 66.5% operating cost reduction in Jakarta deployments. Government-backed discussions in November 2025 considered a potential merger of Grab Holdings and GoTo Group. A combined company would have major instant-delivery density, subject to KPPU antitrust clearance and government conditions.
Indonesia Last Mile Delivery Industry Leaders
J&T Express
JNE Express
SPX Express
SiCepat Ekspres
DHL Group
- *Disclaimer: Major Players sorted in no particular order

Recent Industry Developments
- April 2026: Ninja Xpress expanded its Ninja Cross Border service to 45 countries, extending beyond Malaysia and Singapore to include Japan, Hong Kong, the United Kingdom, Germany, France, and the Americas. Since its 2024 launch, the service has served over 350 active commercial shippers with monthly volumes exceeding 7,500 parcels per shipper and shipment growth of more than 100%.
- November 2025: Pos Indonesia and SiCepat Ekspres launched Integrated Logistics Services with the official first shipment on November 20, 2025. The collaboration combines both companies' distribution networks, tracking systems, and operational assets to deliver end-to-end solutions to MSMEs, e-commerce businesses, and corporations, with an explicit mandate to extend reliable coverage to remote areas of Indonesia.
- August 2025: Pos Indonesia launched COD PosAja! on Shopee from August 2025, initially in Jabodetabek before expanding nationwide. The service extends digital-integrated COD to rural and remote geographies, directly challenging marketplace-owned logistics arms focused on urban delivery and supporting MSME sellers in reaching buyers in underserved corridors.
- August 2025: DHL Express Indonesia officially launched the Surabaya Gateway & Service Centre, backed by a USD 10 million investment, strengthening East Java connectivity and expanding SME access to cross-border express services. Simultaneously, the company planned new processing centers in Denpasar and Batam to capture growing volumes from Bali's tourism-driven commerce and Batam's electronics manufacturing cluster.


Indonesia Last Mile Delivery Market Report Scope
| Standard Delivery |
| Same Day Delivery |
| Next Day Delivery |
| B2B (Business-to-Business) |
| B2C (Business-to-Consumer) |
| C2C (Customer-to-Customer) |
| Foods and Beverages |
| Personal and Household Care |
| Fashion and Lifestyle (accessories, apparel, footwear) |
| Furniture |
| Consumer Electronics and Household Appliances |
| Other Products |
| Tier 1 |
| Tier 2 |
| Tier 3 and Below |
| Jakarta |
| Bandung |
| Surabaya |
| Medan |
| Tasikmalaya |
| Yogyakarta |
| Semarang |
| Denpasar |
| Makassar |
| Rest of Cities |
| By Service | Standard Delivery |
| Same Day Delivery | |
| Next Day Delivery | |
| By Business | B2B (Business-to-Business) |
| B2C (Business-to-Consumer) | |
| C2C (Customer-to-Customer) | |
| By Product Type | Foods and Beverages |
| Personal and Household Care | |
| Fashion and Lifestyle (accessories, apparel, footwear) | |
| Furniture | |
| Consumer Electronics and Household Appliances | |
| Other Products | |
| By City Tier | Tier 1 |
| Tier 2 | |
| Tier 3 and Below | |
| By City | Jakarta |
| Bandung | |
| Surabaya | |
| Medan | |
| Tasikmalaya | |
| Yogyakarta | |
| Semarang | |
| Denpasar | |
| Makassar | |
| Rest of Cities |


Key Questions Answered in the Report
What is the Indonesia last mile delivery market forecast through 2031?
The sector is estimated to grow from USD 3.60 billion in 2026 to USD 5.03 billion by 2031, at a 6.95% CAGR, with marketplace order flows, faster urban fulfillment, digital payments, and transport links shaping demand and cost management.
Which service is growing fastest in Indonesia’s delivery sector?
Same day delivery is forecast to register at a 9.12% CAGR through 2031, supported by denser urban fulfillment, more frequent online orders, and consumer expectations established by food delivery in Jakarta, Surabaya, and other Tier 1 cities.
Which customer type generates the most parcel revenue in Indonesia?
B2C accounted for 75.32% of 2025 revenue, reflecting the scale of marketplace order flows, standardized seller collection, and carrier relationships that connect online platforms with buyers across the country.
Which product category is expanding fastest for delivery operators?
Foods and beverages are forecast to register at a 10.49% CAGR through 2031 and require timely, traceable handling, strong packaging integrity, and delivery operations that can preserve product condition from collection through final handover.
Which city has the strongest delivery growth outlook?
Makassar is forecast to register at a 12.83% CAGR through 2031, supported by IKN-related demand, planned transport links, and the need for delivery networks that can serve a lower-penetration geography with emerging institutional and commercial flows.
How concentrated is Indonesia’s courier sector?
The Indonesia last mile delivery market is moderately concentrated, which gives the leading carriers considerable volume scale while leaving smaller providers to compete through specialized coverage, cross-border services, B2B contracts, and platform connections.
Page last updated on:





