Indonesia Herbicide Market Size and Share
Market Overview
| Study Period | 2018 - 2031 |
|---|---|
| Forecast Data Period | 2026 - 2031 |
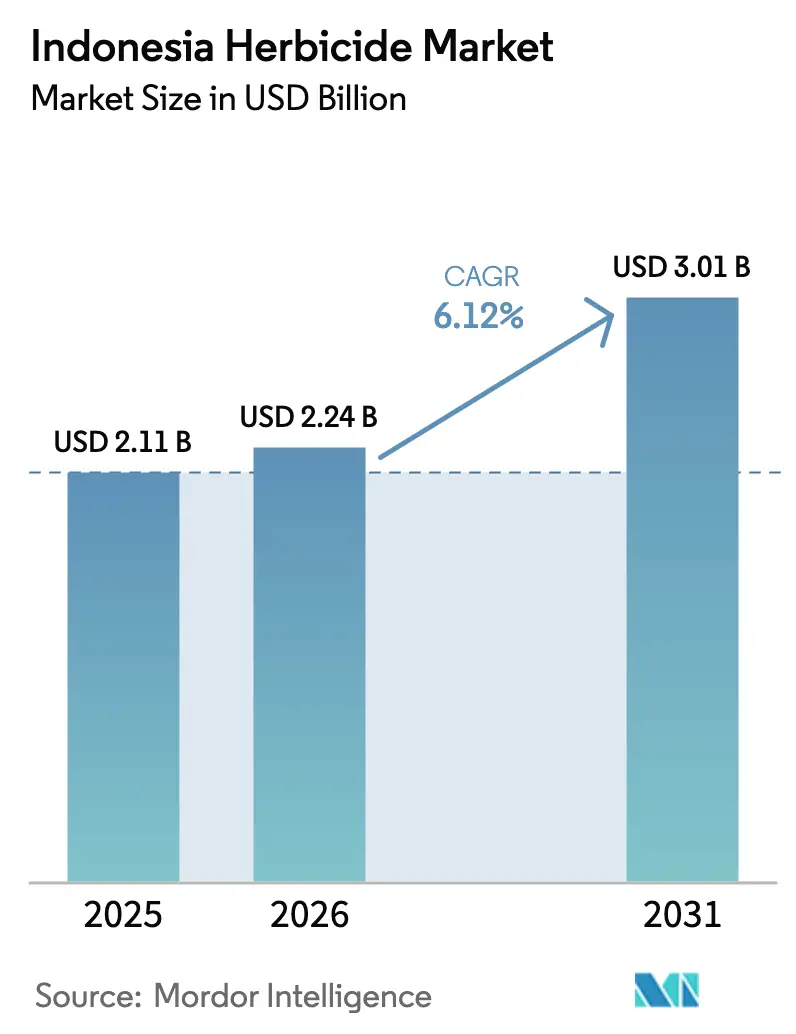
| Base Year Market Size (2025) | USD 2.11 Billion |
| Market Size (2026) | USD 2.24 Billion |
| Market Size (2031) | USD 3.01 Billion |
| Growth Rate (2026 - 2031) | 6.12% CAGR |
| Market Concentration | Medium |
Major Players *Disclaimer: Major Players sorted in no particular order Image © Mordor Intelligence. Reuse requires attribution under CC BY 4.0. | |
Indonesia Herbicide Market Analysis by Mordor Intelligence
Indonesia herbicide market size in 2026 is estimated at USD 2.24 billion, growing from 2025 value of USD 2.11 billion with 2031 projections showing USD 3.01 billion, growing at 6.12% CAGR over 2026-2031. Robust growth in the Indonesia herbicide market is anchored in widespread adoption across rice paddies, oil-palm estates, and high-value horticulture. Weed-resistance outbreaks, precision-spraying technologies, and government subsidy discussions collectively strengthen near-term demand. Multinational suppliers continue to position premium chemistries, while cost-effective generics gain traction among price-sensitive smallholders facing labor shortages. Regulatory re-registration of key active ingredients and import-related supply shocks present counterweights, yet expanded biofuel mandates and carbon-credit incentives sustain a strong long-run outlook for the Indonesia herbicide market.
Key Report Takeaways
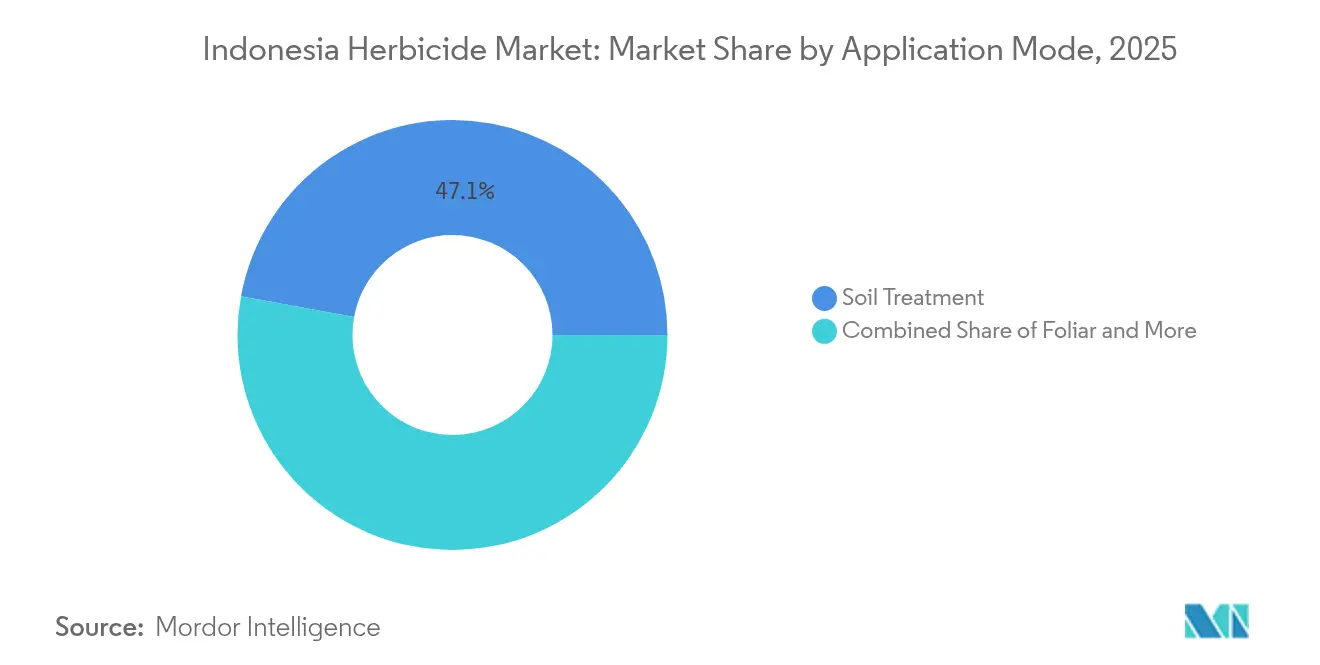
- By application mode, soil treatment captured 47.12% of Indonesia herbicide market share in 2025 and is progressing at a 6.33% CAGR to 2031.
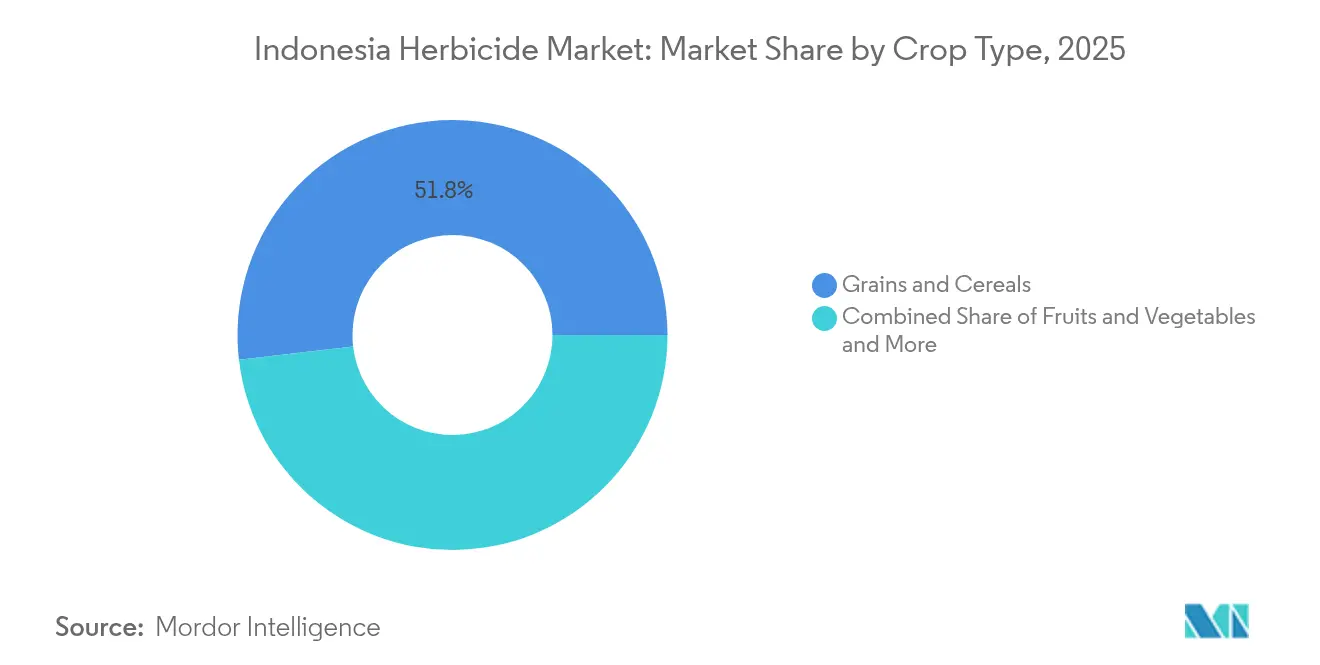
- By crop type, grains and cereals held 51.84% share of the Indonesia herbicide market size in 2025, whereas fruits and vegetables represent the fastest growth at 6.36% CAGR through 2031.
Note: Market size and forecast figures in this report are generated using Mordor Intelligence’s proprietary estimation framework, updated with the latest available data and insights as of 2026.
Indonesia Herbicide Market Trends and Insights
Drivers Impact Analysis*
| Driver | (~) % Impact on CAGR Forecast | Geographic Relevance | Impact Timeline |
|---|---|---|---|
| Rising glyphosate-tolerant weed pressure | +1.1% | Sumatra and Kalimantan plantations | Medium term (2–4 years) |
| Expansion of oil-palm plantations | +0.8% | Sumatra, Kalimantan, and Papua | Long term (≥ 4 years) |
| Government subsidy realignment toward herbicides | +1.2% | National smallholders ≤ 0.5 ha | Short term (≤ 2 years) |
| Adoption of drone-based precision spraying | +0.9% | Java and Sumatra large farms | Medium term (2–4 years) |
| Emergence of bio-herbicides from indigenous microbes | +1.0% | National Research and Development hubs in Java | Long term (≥ 4 years) |
| Carbon-credit incentives favoring minimum tillage | +0.6% | Export-oriented plantations | Medium term (2–4 years) |
| Source: Mordor Intelligence | |||
Rising Glyphosate-Tolerant Weed Pressure
Intense Eleusine indica resistance has been confirmed across 15 provinces, elevating weed-control costs by 25–40% on mature oil-palm stands.[1]Source: University of Gadjah Mada, “Resistance Status of Eleusine indica to Glyphosate in Oil Palm Plantations in Indonesia,” Repository UGM, ugm.ac.id Plantation managers now rotate ACCase (acetyl-CoA carboxylase) and ALS (acetolactate synthase) inhibitors alongside contact herbicides to safeguard productivity. Premium mixtures combined with specialized equipment are gaining share, underpinned by extension guidance that links uncontrolled resistance to 15–25% yield losses within five years. These circumstances reinforce the Indonesia herbicide market’s pivot toward diversified chemistries and integrated programs.
Expansion of Oil-Palm Plantations
Oil-palm acreage is projected to grow 1–1.74% annually through 2030, opening 153,800–267,000 hectares of new land each year.[2]Source: Traction Energy Asia Research Team, “Pemodelan Dampak Penggunaan CPO di Indonesia,” Mongabay Indonesia, mongabay.co.id Young stands demand four to six herbicide passes per season until canopy closure, bolstering the Indonesia herbicide market. Although environmental scrutiny and financing constraints temper expansion, the B40 biodiesel mandate, effective 2025, provides a supportive policy backdrop.
Government Subsidy Realignment Toward Herbicides
Policy debate now centers on balancing fertilizer-heavy subsidies with herbicide support, especially for labor-constrained growers. Kartu Tani’s digital input platform records just 8.63% adoption but offers scalable distribution once procedural hurdles ease. Broader subsidy access could lower smallholder weed-control costs, driving incremental volume within the Indonesia herbicide industry.
Adoption of Drone-Based Precision Spraying
Commercial estates employ unmanned aerial vehicles to navigate tall palm fronds and flooded rice fields, securing uniform coverage while cutting operator exposure. Early users report material savings of 12–18% per hectare alongside timelier applications. Government Agriculture 4.0 pilots co-finance hardware for producer groups, improving the technology’s reach and sustaining momentum in the Indonesia herbicide market.
Restraints Impact Analysis*
| Restraint | (~) % Impact on CAGR Forecast | Geographic Relevance | Impact Timeline |
|---|---|---|---|
| Supply-chain disruptions in active ingredient imports | -0.7% | Nationwide distributors and formulators | Short term (≤ 2 years) |
| Stringent re-registration of paraquat and atrazine | -0.5% | Plantation and field-crop zones | Medium term (2–4 years) |
| Smallholder affordability constraints | -0.6% | Java, Sumatra, and Sulawesi | Short term (≤ 2 years) |
| Growing consumer demand for organic produce | -0.4% | Java, Bali urban supply chains | Long term (≥ 4 years) |
| Source: Mordor Intelligence | |||
Supply-Chain Disruptions in Active Ingredient Imports
Indonesia sources 80–90% of technical material from China and India, exposing prices to freight delays and currency swings. COVID-19 lockdowns and container shortages lifted landed costs, with downstream mark-ups hitting small distributors hardest. Larger multinationals with global stockpiles retain service levels, deepening competitive gaps inside the Indonesia herbicide market.
Growing Consumer Demand for Organic Produce
Urban middle-class consumers pay premiums for certified organic fruit and vegetables, nudging peri-urban growers toward mechanical or biological weed control.[3]Source: Badan Pusat Statistik, “Statistik Harga Produsen Pertanian 2023,” BPS, bps.go.id Although organic acreage remains modest, its double-digit growth caps chemical volumes in select high-value sectors. Certification bodies enforce residue limits that tighten permissible herbicide windows, restraining long-term consumption in portions of the Indonesia herbicide market.
*Our forecasts treat driver/restraint impacts as directional, not additive. The impact forecasts reflect baseline growth, mix effects, and variable interactions.
Segment Analysis
By Application Mode: Soil Treatment Consolidates Advantage
Soil-applied products held 47.12% of Indonesia herbicide market share in 2025 on rice, oil-palm, and tree-crop estates, underscoring their fit for sustained weed suppression. The Indonesia herbicide market size for soil treatment segments is poised to expand at a 6.33% CAGR through 2031 as growers invest in residual chemistries and precision placement equipment that stretch application intervals. Drone-guided sprayers and GPS-enabled boom systems heighten deposition accuracy, lowering off-target drift and supporting environmental compliance.
Plantation managers favor pre-emergence control to address labor scarcity that elevates manual weeding costs. Soil fumigants stay niche outside protected horticulture, yet chemigation’s share inches up in greenhouse peppers and tomatoes. Foliar herbicides remain indispensable in paddy ecosystems for late-season escapes, their growth lags as integrated programs shift emphasis from curative to preventive approaches within the Indonesia herbicide market.


By Crop Type: Grains Dominate, Horticulture Accelerates
Grains and cereals commanded 51.84% of Indonesia herbicide market share in 2025, driven by paddy-field dependence on selective and broad-spectrum mixes to combat Echinochloa and Cyperus infestations. The Indonesia herbicide market size for grains benefits from government rice self-sufficiency policies that subsidize mechanization packages, inclusive of herbicide application modules. Oil-palm and rubber plantations add material volume, particularly in immature stands demanding frequent circle spraying.
Fruits and vegetables, though smaller in absolute value, outpace other crops at 6.36% CAGR to 2031 as greenhouse acreage multiplies and export buyers tighten residue limits. Pulses and oilseeds gain a gradual share through crop-diversification programs, while turf and ornamentals remain confined to urban landscaping and golf courses. Diverse crop physiology obliges suppliers to maintain broad portfolios covering contact, systemic, and residual modes of action, reinforcing product innovation across the Indonesia herbicide market.
Geography Analysis
Sumatra and Kalimantan generate the highest per-hectare herbicide outlays due to oil-palm monocultures that necessitate year-round weed management. Intensive rice systems on Java contribute sizable volume as double-cropping elevates application frequency. Eastern islands such as Sulawesi, Papua, and Maluku show emerging demand where government food-estate initiatives expand arable land. Climate variability shapes label recommendations: equatorial rainfall accelerates leaching, prompting higher rates or encapsulated formulations, whereas seasonally drier zones accept standard doses.
Logistics complicate distribution across 17,000 islands, shipping surcharges inflate retail prices in remote districts, influencing farmer choice toward lower-cost generics. Agricultural extension intensity also varies; Java enjoys dense outreach networks that promote responsible usage, whereas frontier regions rely on dealer-led advice. Provincial environmental agencies enforce more stringent residue checks in densely populated areas, nudging growers toward soil-applied options with lower drift risk. Infrastructure upgrades, notably port expansions and trans-island highways, gradually improve last-mile delivery, broadening access to branded products in the Indonesia herbicide market.
Digital advisory apps piloted under Agriculture 4.0 are initially concentrated on Java and Sumatra but plan rollouts elsewhere once connectivity hurdles ease. Collectively, region-specific agronomy and logistics dictate differentiated go-to-market strategies for suppliers competing in the Indonesia herbicide market.
Competitive Landscape
Global majors, Bayer, BASF, FMC Corporation, UPL Limited, and Syngenta Group, command a majority share, leveraging multi-channel distribution, stewardship programs, and branded portfolios suited to tropical agronomy. They invest in dealer training and demonstration plots that reinforce brand equity among large plantations and progressive cooperatives. Local formulators such as PT Biotis Agrindo and PT Pupuk Kalimantan Timur pursue niche positioning through Indonesia-specific blends and micro-pack sizes optimized for smallholder affordability.
Hebang Corporation’s plan to build glyphosate capacity onshore may realign raw-material sourcing economics, lowering reliance on imports and intensifying price competition. Intellectual-property expiration on several leading actives opens space for domestic manufacturers to launch generics, compelling multinationals to differentiate via co-formulations and resistance-management toolkits.
Digital farming partnerships, including drone-sprayer leasing and agronomic-advice apps, create ecosystem plays that bind growers to specific crop-protection brands. Compliance expertise remains a decisive advantage as re-registration dossiers grow more rigorous; companies with global toxicology data packages secure smoother approvals. Corporate sustainability pledges further influence procurement decisions of vertically integrated palm-oil giants seeking to satisfy international buyers, raising the stakes for full-life-cycle stewardship inside the Indonesia herbicide market.
Indonesia Herbicide Industry Leaders
BASF SE
Bayer AG
FMC Corporation
Syngenta Group
UPL Limited
- *Disclaimer: Major Players sorted in no particular order

Recent Industry Developments
- August 2025: BASF launched Luxinum herbicide in Indonesia, featuring Luximo Active, the first herbicide in HRAC Group 30. The product provides pre-emergent control of grasses, sedges, and resistant weeds in rice crops. Luxinum delivers up to 21 days of residual weed protection, enabling farmers to enhance crop yields and promote agricultural sustainability.
- July 2025: Indonesia opened a USD 20 million pesticide manufacturing facility in Banten Province, specializing in herbicide production. The facility, operated by PT Delta Giri Wacana, aims to enhance domestic food security and increase global supply. The plant plans to increase its production capacity of herbicide formulations.


Indonesia Herbicide Market Report Scope
Chemigation, Foliar, Fumigation, Soil Treatment are covered as segments by Application Mode. Commercial Crops, Fruits & Vegetables, Grains & Cereals, Pulses & Oilseeds, Turf & Ornamental are covered as segments by Crop Type.| Chemigation |
| Foliar |
| Fumigation |
| Soil Treatment |
| Commercial Crops |
| Fruits and Vegetables |
| Grains and Cereals |
| Pulses and Oilseeds |
| Turf and Ornamental |
| Application Mode | Chemigation |
| Foliar | |
| Fumigation | |
| Soil Treatment | |
| Crop Type | Commercial Crops |
| Fruits and Vegetables | |
| Grains and Cereals | |
| Pulses and Oilseeds | |
| Turf and Ornamental |


Market Definition
- Function - Herbicides are chemicals used to control or prevent weeds from preventing crop growth and yield loss.
- Application Mode - Foliar, Seed Treatment, Soil Treatment, Chemigation, and Fumigation are the different type of application modes through which crop protection chemicals are applied to the crops.
- Crop Type - This represents the consumption of crop protection chemicals by Cereals, Pulses, Oilseeds, Fruits, Vegetables, Turf, and Ornamental crops.
| Keyword | Definition |
|---|---|
| IWM | Integrated weed management (IWM) is an approach to incorporate multiple weed control techniques throughout the growing season to give producers the best opportunity to control problematic weeds. |
| Host | Hosts are the plants that form relationships with beneficial microorganisms and help them colonize. |
| Pathogen | A disease-causing organism. |
| Herbigation | Herbigation is an effective method of applying herbicides through irrigation systems. |
| Maximum residue levels (MRL) | Maximum Residue Limit (MRL) is the maximum allowed limit of pesticide residue in food or feed obtained from plants and animals. |
| IoT | The Internet of Things (IoT) is a network of interconnected devices that connect and exchange data with other IoT devices and the cloud. |
| Herbicide-tolerant varieties (HTVs) | Herbicide-tolerant varieties are plant species that have been genetically engineered to be resistant to herbicides used on crops. |
| Chemigation | Chemigation is a method of applying pesticides to crops through an irrigation system. |
| Crop Protection | Crop protection is a method of protecting crop yields from different pests, including insects, weeds, plant diseases, and others that cause damage to agricultural crops. |
| Seed Treatment | Seed treatment helps to disinfect seeds or seedlings from seed-borne or soil-borne pests. Crop protection chemicals, such as fungicides, insecticides, or nematicides, are commonly used for seed treatment. |
| Fumigation | Fumigation is the application of crop protection chemicals in gaseous form to control pests. |
| Bait | A bait is a food or other material used to lure a pest and kill it through various methods, including poisoning. |
| Contact Fungicide | Contact pesticides prevent crop contamination and combat fungal pathogens. They act on pests (fungi) only when they come in contact with the pests. |
| Systemic Fungicide | A systemic fungicide is a compound taken up by a plant and then translocated within the plant, thus protecting the plant from attack by pathogens. |
| Mass Drug Administration (MDA) | Mass drug administration is the strategy to control or eliminate many neglected tropical diseases. |
| Mollusks | Mollusks are pests that feed on crops, causing crop damage and yield loss. Mollusks include octopi, squid, snails, and slugs. |
| Pre-emergence Herbicide | Preemergence herbicides are a form of chemical weed control that prevents germinated weed seedlings from becoming established. |
| Post-emergence Herbicide | Postemergence herbicides are applied to the agricultural field to control weeds after emergence (germination) of seeds or seedlings. |
| Active Ingredients | Active ingredients are the chemicals in pesticide products that kill, control, or repel pests. |
| United States Department of Agriculture (USDA) | The Department of Agriculture provides leadership on food, agriculture, natural resources, and related issues. |
| Weed Science Society of America (WSSA) | The WSSA, a non-profit professional society, promotes research, education, and extension outreach activities related to weeds. |
| Suspension concentrate | Suspension concentrate (SC) is one of the formulations of crop protection chemicals with solid active ingredients dispersed in water. |
| Wettable powder | A wettable powder (WP) is a powder formulation that forms a suspension when mixed with water prior to spraying. |
| Emulsifiable concentrate | Emulsifiable concentrate (EC) is a concentrated liquid formulation of pesticide that needs to be diluted with water to create a spray solution. |
| Plant-parasitic nematodes | Parasitic Nematodes feed on the roots of crops, causing damage to the roots. These damages allow for easy plant infestation by soil-borne pathogens, which results in crop or yield loss. |
| Australian Weeds Strategy (AWS) | The Australian Weeds Strategy, owned by the Environment and Invasives Committee, provides national guidance on weed management. |
| Weed Science Society of Japan (WSSJ) | WSSJ aims to contribute to the prevention of weed damage and the utilization of weed value by providing the chance for research presentation and information exchange. |


Research Methodology
Mordor Intelligence follows a four-step methodology in all our reports.
- Step-1: Identify Key Variables: In order to build a robust forecasting methodology, the variables and factors identified in Step-1 are tested against available historical market numbers. Through an iterative process, the variables required for market forecast are set and the model is built on the basis of these variables.
- Step-2: Build a Market Model: Market-size estimations for the forecast years are in nominal terms. Inflation is not a part of the pricing, and the average selling price (ASP) is kept constant throughout the forecast period.
- Step-3: Validate and Finalize: In this important step, all market numbers, variables and analyst calls are validated through an extensive network of primary research experts from the market studied. The respondents are selected across levels and functions to generate a holistic picture of the market studied.
- Step-4: Research Outputs: Syndicated Reports, Custom Consulting Assignments, Databases & Subscription Platforms


