Asia Pacific Herbicide Market Size and Share
Market Overview
| Study Period | 2018 - 2031 |
|---|---|
| Forecast Data Period | 2026 - 2031 |
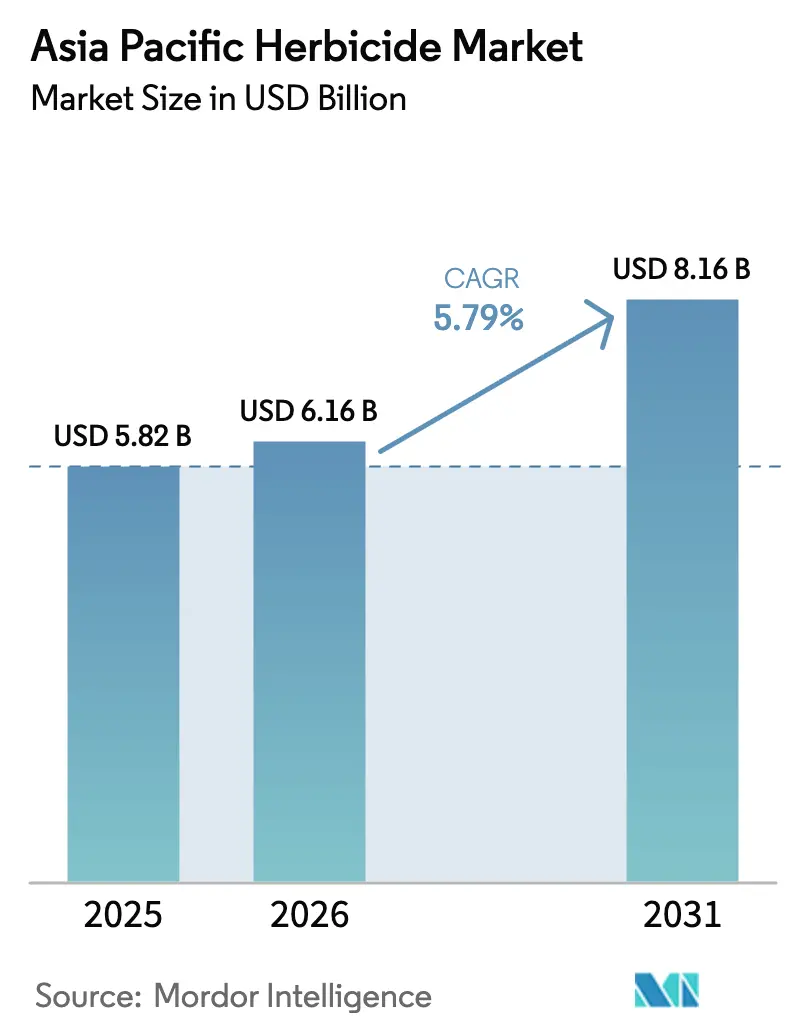
| Base Year Market Size (2025) | USD 5.82 Billion |
| Market Size (2026) | USD 6.16 Billion |
| Market Size (2031) | USD 8.16 Billion |
| Growth Rate (2026 - 2031) | 5.79% CAGR |
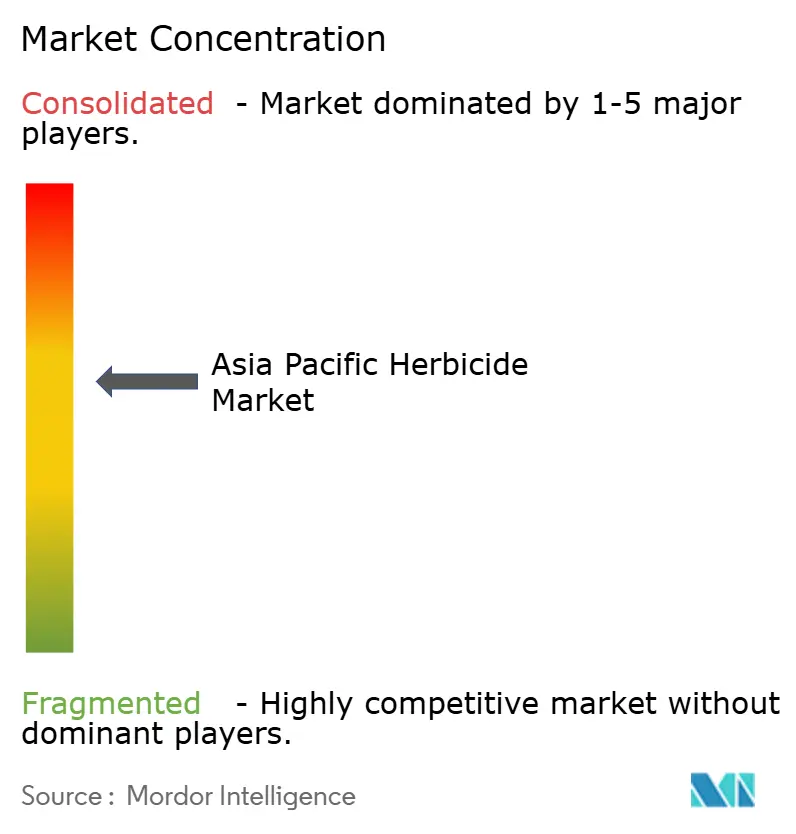
| Market Concentration | Medium |
Major Players *Disclaimer: Major Players sorted in no particular order Image © Mordor Intelligence. Reuse requires attribution under CC BY 4.0. | |
Asia Pacific Herbicide Market Analysis by Mordor Intelligence
Asia Pacific Herbicide Market Analysis by Mordor Intelligence
The Asia Pacific herbicide market size is expected to grow from USD 5.82 billion in 2025 to USD 6.16 billion in 2026 and is forecast to reach USD 8.16 billion by 2031 at 5.79% CAGR over 2026-2031. Momentum stems from expanding genetically modified crop acreage, rapid farm mechanization, and government subsidies that lower the cost of crop-protection inputs. The Asia Pacific herbicide market benefits from precision-application technologies that reduce wastage and enable premium pricing for advanced formulations. Competitive strategies focus on portfolio shifts toward low-toxicity molecules and bio-herbicides, while manufacturers hedge supply-chain risks by adding in-region production capacity. Although rising weed resistance and select active-ingredient bans pressure margins, niche gains in forestry weed control and rice-focused biological products widen revenue opportunities.
Key Report Takeaways
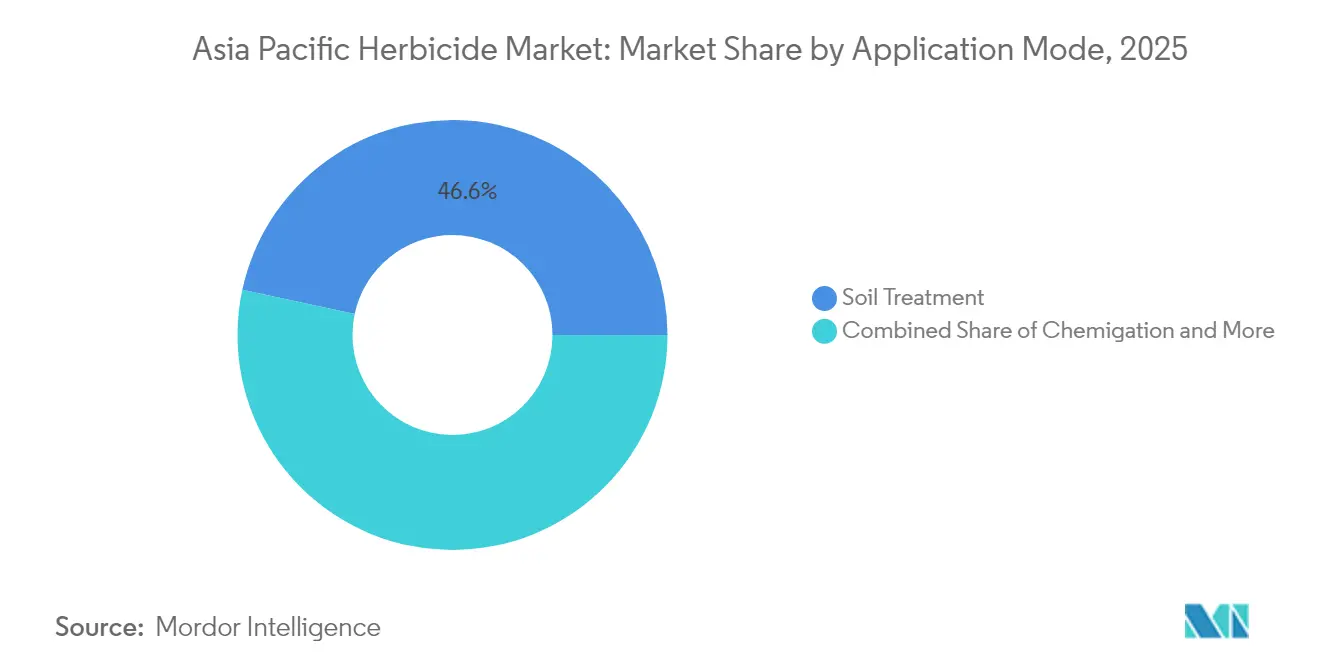
- By Application Mode, soil treatment held 46.63% of the Asia Pacific herbicide market share in 2025 and is expanding at a 6.12% CAGR through 2031.
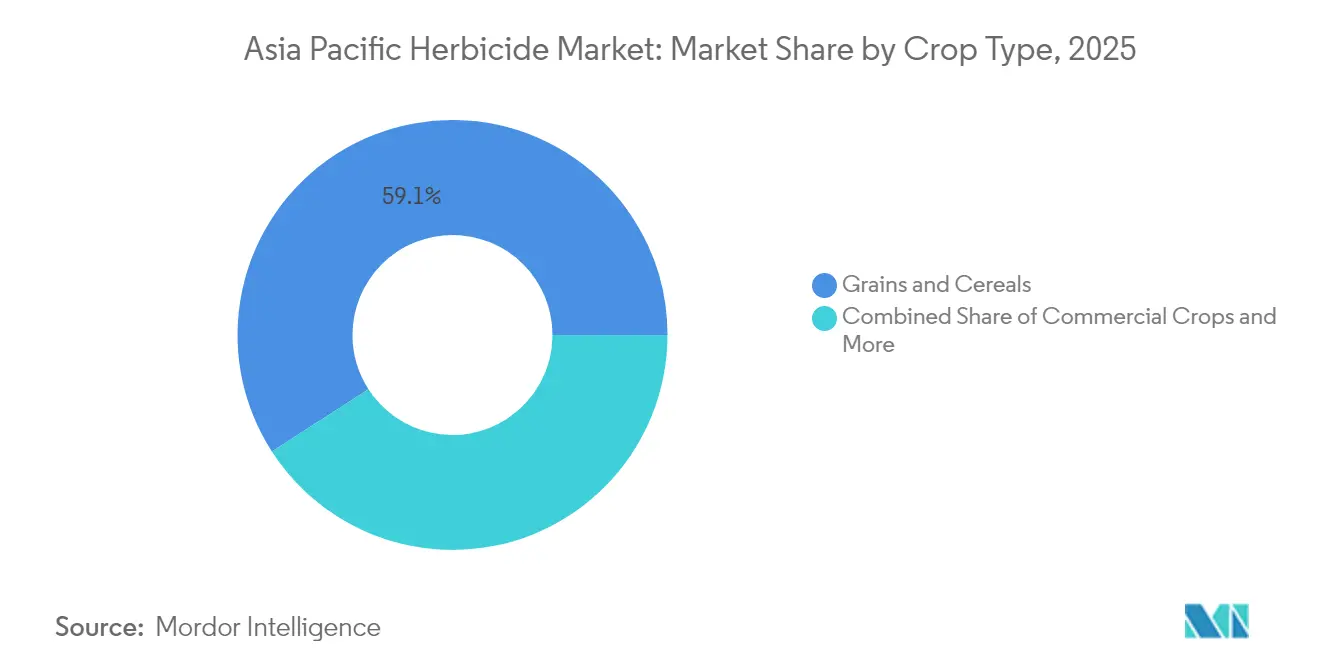
- By Crop Type, commercial crops posted the highest projected CAGR at 6.18% to 2031, while grains and cereals commanded a 59.12% share of the Asia Pacific herbicide market size in 2025.
- By Geography, China led with 34.05% revenue share in 2025, and India is advancing at a 8.62% CAGR to 2031.
Note: Market size and forecast figures in this report are generated using Mordor Intelligence’s proprietary estimation framework, updated with the latest available data and insights as of 2026.
Asia Pacific Herbicide Market Trends and Insights
Drivers Impact Analysis*
| Driver | (~) % Impact on CAGR Forecast | Geographic Relevance | Impact Timeline |
|---|---|---|---|
| Expansion of GM-crop acreage | +1.80% | China, Australia, India | Medium term (2-4 years) |
| Rising adoption of no-till farming | +1.20% | Australia, China, regional | Long term (≥ 4 years) |
| Government crop-protection subsidies | +1.10% | India, China, Southeast Asia | Short term (≤ 2 years) |
| Rapid farm mechanization | +0.90% | China, India, Thailand, Vietnam | Medium term (2-4 years) |
| Proprietary bio-herbicides for rice | +0.70% | Southeast Asia, Eastern China, Japan | Long term (≥ 4 years) |
| Forestry weed-control demand | +0.40% | Indonesia, Malaysia, Australia, Myanmar | Medium term (2-4 years) |
| Source: Mordor Intelligence | |||


Expansion of GM-crop Acreage Drives Herbicide-Tolerant Systems
China’s approval of glyphosate-tolerant soybeans in 2024 unlocked simplified broad-spectrum weed control programs that cut labor costs and raise yields.[1]Ministry of Agriculture and Rural Affairs of China, “GM Crop Approval Guidelines,” MOA.GOV.CN Australia’s long-standing GM cotton and canola framework already supports large-scale herbicide-tolerant cultivation, while India is poised to adopt similar traits in cotton and mustard once regulatory clearance is granted[2]Ministry of Agriculture and Farmers Welfare, “Agricultural Statistics at a Glance 2024,” AGRICOOP.GOV.IN. Greater trait availability increases per-hectare herbicide spend because growers prefer single-pass chemical programs over manual weeding. Local breeding alliances with multinational seed firms accelerate varietal launches, ensuring sustained demand for complementary formulations. Equipment makers are bundling trait-specific application guides that promote premium products with drift-reduction additives. The resulting rise in the Asia Pacific herbicide market demand extends across supply chains, from active-ingredient synthesis in China to formulation plants in Thailand. Growth remains strongest where policy liberalization coincides with farm labor scarcity, particularly in coastal China and western India.
Rising Adoption of No-Till Farming Transforms Application Patterns
Australia manages 80% of its cropped land under no-till schemes, a benchmark now influencing Chinese corn belts and Southeast Asian soybean areas. [3]Australian Bureau of Agricultural and Resource Economics, “Agricultural Commodity Statistics 2024,” AGRICULTURE.GOV.AU Eliminating mechanical cultivation shifts weed control to chemical tools, boosting pre- and early post-emergence spray volumes. Farmers using GPS-guided boom sprayers apply variable rates tailored to soil texture, improving efficacy and lowering environmental load. Drone platforms carry ultra-low-volume formulations across terraced rice fields in Vietnam, encouraging demand for high-potency actives with rapid knock-down. As drone fleets expand, suppliers differentiate through droplet-spectrum research that minimizes drift near waterways. The Asia Pacific herbicide market, therefore, favors manufacturers investing in precision-ready formulations, adjuvant compatibility, and stewardship training programs that demonstrate measurable soil-carbon benefits to re gulators.
Government Crop-Protection Subsidies Lower Farmer Purchase Barriers
India’s Pradhan Mantri Kisan Samman Nidhi scheme transfers direct income support, enabling growers to allocate a portion toward herbicides without straining cash flow. Chinese provincial grants reimburse up to 30% of smallholders’ chemical purchases when switching from manual to mechanical weed control in rice paddies, accelerating uptake of safer formulations. Thailand and Vietnam provide duty exemptions on imported sprayer parts, indirectly lowering total application costs. These incentives nurture a price-sensitive segment that gravitates toward off-patent chemistries but increasingly adopts premium blends when government extension officers emphasize resistance management. Subsidy cycles create seasonal spikes in the Asia Pacific herbicide market, prompting distributors to expand rural warehousing capacity and digital ordering platforms that shorten lead times.
Rapid Farm Mechanization Increases Herbicide Use Efficiency
Over 180,000 self-propelled sprayers entered Chinese fields in 2024, supported by machinery subsidies that favor equipment capable of multi-crop use. Thai sugarcane cooperatives deploy drone fleets that spray steep slopes unreachable by tractors, demanding low-viscosity formulations with quick leaf penetration. Vietnam’s rice farmers adopt lightweight battery-powered backpack sprayers coupled with QR-coded calibration apps, improving dose accuracy. Equipment advances raise expectations for herbicide compatibility with electronic flow controllers, leading suppliers to invest in surfactant packages that maintain stable flow rates. The mechanization wave, therefore, widens the Asia Pacific herbicide market access as precise delivery reduces wastage and enhances return on investment, especially in fragmented smallholder landscapes.
Restraints Impact Analysis*
| Restraint | (~) % Impact on CAGR Forecast | Geographic Relevance | Impact Timeline |
|---|---|---|---|
| Stringent bans on select AIs | -1.4% | China, India, Australia, EU export markets | Short term (≤ 2 years) |
| Weed resistance escalation | -0.9% | Global APAC, acute in intensive cropping systems | Long term (≥ 4 years) |
| Energy-curb supply disruptions | -0.6% | China manufacturing hubs, regional supply chains | Short term (≤ 2 years) |
| Residue-free produce pressure | -0.5% | Export-oriented regions, premium market segments | Medium term (2-4 years) |
| Source: Mordor Intelligence | |||
Stringent Bans on Select Active Ingredients Reshape Product Portfolios
China banned paraquat for domestic use in 2024, removing a low-cost desiccant across 4 million hectares of rice and vegetable land. Australia’s glyphosate review raises uncertainty for 25 million hectares of wheat and barley, motivating growers to test alternative chemistries through on-farm trials with government monitoring. India’s draft restriction on 2,4-D threatens weed control in sugarcane belts, spurring R&D on synthetic auxin replacements. Tight regulations increase registration costs and prolong approval timelines, favoring firms with diversified portfolios and biological pipelines. Supply realignment shifts demand toward newer, higher-margin molecules and integrated weed management packages that include cover crops and mechanical tools. Though necessary for environmental safeguards, these policy moves compress the short-term Asia Pacific herbicide market size as farmers exhaust existing inventories.
Weed Resistance Escalation Threatens Herbicide Efficacy
Glyphosate-resistant ryegrass infestations compel Australian growers to add mixed-mode tank partners, raising per-hectare herbicide spend by up to 40%. Chinese rice farmers confront barnyardgrass resilient to propanil and butachlor, leading to sequential spraying strategies that increase application frequency. Resistance spreads faster where single-mode reliance combines with a favorable climate, such as warm, irrigated rice systems. Seed companies now bundle herbicide-tolerant traits with stewardship guides that rotate chemistries every season, but adoption lags among smallholders. Manufacturers respond by launching pre-packaged co-formulations that simplify multi-mode use, though higher prices deter some growers. Without improved diagnostics and advisory services, escalating resistance risks erode Asia Pacific herbicide market share for older actives and intensify the hunt for novel modes.
*Our forecasts treat driver/restraint impacts as directional, not additive. The impact forecasts reflect baseline growth, mix effects, and variable interactions.
Segment Analysis
By Application Mode: Soil Treatment Leads Precision Adoption
Soil treatment captured 46.63% of the Asia Pacific herbicide market share in 2025 and is projected to advance at a 6.12% CAGR through 2031. Pre-emergence weed control shields seedlings during vulnerable stages, translating into yield gains that justify premium products. Controlled-release granules lengthen residual activity, minimizing re-entry labor and supporting minimum-till systems favored in Australia. GPS-enabled seed drills pair with variable-depth herbicide injectors, encouraging adoption of soil-specific dose maps that boost formulation efficiency.
Foliar sprays remain pivotal for post-emergence rescue operations, particularly in monsoon areas where weed flushes occur after heavy rainfall. Chemigation systems gain traction in India’s sugarcane belt, leveraging drip lines to deliver low-volume herbicides directly to weed root zones. Fumigation, although niche, sustains demand in high-value horticultural nurseries where soil sterilization is mandatory for export compliance. Across all modes, data-driven application schedules elevate the Asia Pacific herbicide market size as producers invest in integrated hardware-chemical packages.


By Crop Type: Grains Drive Volume, Commercial Crops Accelerate Growth
Grains and cereals retained a 59.12% share of the Asia Pacific herbicide market size in 2025, reflecting vast rice, wheat, and corn acreage. Rice fields need flood-compatible herbicides that disperse evenly in standing water, while wheat systems depend on selective grass-weed control to prevent yield loss. Commercial crops post the fastest 6.18% CAGR as cotton, sugarcane, and oilseed acreages climb in India and Southeast Asia. Cotton growers adopt herbicide-tolerant seeds that enable over-the-top spraying, lowering hand-weeding costs. Sugarcane plantations prefer prolonged-residual actives to counter ratoon-crop weed flushes.
Fruits and vegetables command premium herbicide solutions due to strict residue limits in export markets; short pre-harvest intervals and low toxicity rank high in purchase criteria. Pulses and oilseeds benefit from diversification policies that reduce cereal monoculture, prompting incremental Asia Pacific herbicide market demand for broad-spectrum pre-seedbed treatments. Turf and ornamentals, while small in volume, pay premium prices for aesthetics-driven weed management, supporting specialized portfolios.
Geography Analysis
China contributed 34.05% of the Asia Pacific herbicide market share in 2025, anchored by 165 million hectares of arable land that often hosts double-cropping systems. Provincial modernization plans subsidize herbicide-tolerant traits and precision sprayers, while environmental rules pressure manufacturers to switch to low-toxicity profiles. Northeastern corn-soybean belts show rapid mechanization, whereas southern rice paddies prioritize labor-saving chemistry amid rural migration. Domestic producers integrate vertically from active-ingredient synthesis to branded formulations, enabling competitive pricing and export growth.
India is the fastest-growing geography at a 8.62% CAGR through 2031, propelled by direct farmer income support and expanding irrigation that stabilizes crop calendars. Region-specific weed spectrums drive differentiated herbicide menus, with eastern states demanding rice solutions and western zones focusing on cotton and sugarcane. Adoption of drone spraying in Punjab and Haryana expedites post-sowing herbicide windows, encouraging suppliers to register ultra-low-volume variants.
Australia represents a mature yet innovation-intensive market where no-till practices cover nearly the entire broadacre grain area. Stringent APVMA oversight encourages the rapid introduction of new modes of action that address glyphosate resistance. Southeast Asian countries such as Vietnam, Thailand, and Indonesia collectively add significant incremental demand as smallholders mechanize and commercialize their operations. Local distributors partner with multinational firms to co-label formulations that fit tropical climates, broadening the Asia Pacific herbicide market penetration.
Competitive Landscape
The Asia-Pacific herbicide market is moderately concentrated. Bayer AG holds the largest share, followed by Syngenta Group and UPL. Multinational companies leverage global R&D capabilities to introduce patented actives and trait packages, while domestic firms focus on cost competitiveness, agility in local registration, and regional distribution networks. Portfolio diversification into bio-herbicides is emerging as a strategic response to stricter regulatory toxicity thresholds.
Bayer has invested USD 150 million to expand its Thai glyphosate and 2,4-D production lines, aiming to meet the demand in Southeast Asia by 2024. Syngenta has obtained Chinese approval for a new rice grass-weed active, showcasing its ability to navigate local regulatory frameworks. UPL’s acquisition of Rainbow Agro’s portfolio has enhanced its distribution network in India and improved manufacturing synergies, reflecting ongoing consolidation trends.
Australian precision-agriculture startups are providing AI-based spray advisory tools, forming partnerships with manufacturers to integrate software and chemical solutions. Meanwhile, Chinese biotech companies are focusing on the discovery of novel actives, supported by state R&D incentives, positioning themselves for opportunities arising from future patent expirations.
Asia Pacific Herbicide Industry Leaders
Bayer AG
Syngenta Group
UPL
Corteva Agriscience
Nufarm
- *Disclaimer: Major Players sorted in no particular order

Recent Industry Developments
- August 2025: BASF has introduced Luxinum herbicide, powered by Luximo Active, in Indonesia. Luxinum herbicide is classified under Group 30, representing the first new mode of action introduced in several decades. This innovative chemistry employs a unique mechanism that inhibits cell membrane processes in weed seedlings, effectively disrupting germination and controlling persistent grass and sedge weeds.
- May 2025: UPL has introduced SUPERFORM (Superform Chemistries Limited), a specialty chemistries company focused on innovation, sustainability, and high-performance solutions. Now operating as an independent entity, SUPERFORM caters to a range of dynamic and diverse industries, including agriculture.
- January 2025: Bayer has partnered with the Pula Foundation to provide insurance coverage for 10 million smallholder farmers in Sub-Saharan Africa and South Asia. This collaboration seeks to improve productivity among these farmers.


Asia Pacific Herbicide Market Report Scope
The Asia Pacific Herbicide Market is Segmented by Application Mode (Chemigation, Foliar, Fumigation, and Soil Treatment), Crop Type (Commercial Crops, Fruits and Vegetables, Grains and Cereals, Pulses and Oilseeds, and Turf and Ornamental), and Country (Australia, China, India, Indonesia, Japan, Myanmar, Pakistan, Philippines, Thailand, and More). The Report Offers the Market Size and Forecasts in Terms of Value (USD).
| Chemigation |
| Foliar |
| Fumigation |
| Soil Treatment |
| Commercial Crops |
| Fruits and Vegetables |
| Grains and Cereals |
| Pulses and Oilseeds |
| Turf and Ornamental |
| Australia |
| China |
| India |
| Indonesia |
| Japan |
| Myanmar |
| Pakistan |
| Philippines |
| Thailand |
| Vietnam |
| Rest of Asia-Pacific |
| Application Mode | Chemigation |
| Foliar | |
| Fumigation | |
| Soil Treatment | |
| Crop Type | Commercial Crops |
| Fruits and Vegetables | |
| Grains and Cereals | |
| Pulses and Oilseeds | |
| Turf and Ornamental | |
| Country | Australia |
| China | |
| India | |
| Indonesia | |
| Japan | |
| Myanmar | |
| Pakistan | |
| Philippines | |
| Thailand | |
| Vietnam | |
| Rest of Asia-Pacific |


Market Definition
- Function - Herbicides are chemicals used to control or prevent weeds from preventing crop growth and yield loss.
- Application Mode - Foliar, Seed Treatment, Soil Treatment, Chemigation, and Fumigation are the different type of application modes through which crop protection chemicals are applied to the crops.
- Crop Type - This represents the consumption of crop protection chemicals by Cereals, Pulses, Oilseeds, Fruits, Vegetables, Turf, and Ornamental crops.
| Keyword | Definition |
|---|---|
| IWM | Integrated weed management (IWM) is an approach to incorporate multiple weed control techniques throughout the growing season to give producers the best opportunity to control problematic weeds. |
| Host | Hosts are the plants that form relationships with beneficial microorganisms and help them colonize. |
| Pathogen | A disease-causing organism. |
| Herbigation | Herbigation is an effective method of applying herbicides through irrigation systems. |
| Maximum residue levels (MRL) | Maximum Residue Limit (MRL) is the maximum allowed limit of pesticide residue in food or feed obtained from plants and animals. |
| IoT | The Internet of Things (IoT) is a network of interconnected devices that connect and exchange data with other IoT devices and the cloud. |
| Herbicide-tolerant varieties (HTVs) | Herbicide-tolerant varieties are plant species that have been genetically engineered to be resistant to herbicides used on crops. |
| Chemigation | Chemigation is a method of applying pesticides to crops through an irrigation system. |
| Crop Protection | Crop protection is a method of protecting crop yields from different pests, including insects, weeds, plant diseases, and others that cause damage to agricultural crops. |
| Seed Treatment | Seed treatment helps to disinfect seeds or seedlings from seed-borne or soil-borne pests. Crop protection chemicals, such as fungicides, insecticides, or nematicides, are commonly used for seed treatment. |
| Fumigation | Fumigation is the application of crop protection chemicals in gaseous form to control pests. |
| Bait | A bait is a food or other material used to lure a pest and kill it through various methods, including poisoning. |
| Contact Fungicide | Contact pesticides prevent crop contamination and combat fungal pathogens. They act on pests (fungi) only when they come in contact with the pests. |
| Systemic Fungicide | A systemic fungicide is a compound taken up by a plant and then translocated within the plant, thus protecting the plant from attack by pathogens. |
| Mass Drug Administration (MDA) | Mass drug administration is the strategy to control or eliminate many neglected tropical diseases. |
| Mollusks | Mollusks are pests that feed on crops, causing crop damage and yield loss. Mollusks include octopi, squid, snails, and slugs. |
| Pre-emergence Herbicide | Preemergence herbicides are a form of chemical weed control that prevents germinated weed seedlings from becoming established. |
| Post-emergence Herbicide | Postemergence herbicides are applied to the agricultural field to control weeds after emergence (germination) of seeds or seedlings. |
| Active Ingredients | Active ingredients are the chemicals in pesticide products that kill, control, or repel pests. |
| United States Department of Agriculture (USDA) | The Department of Agriculture provides leadership on food, agriculture, natural resources, and related issues. |
| Weed Science Society of America (WSSA) | The WSSA, a non-profit professional society, promotes research, education, and extension outreach activities related to weeds. |
| Suspension concentrate | Suspension concentrate (SC) is one of the formulations of crop protection chemicals with solid active ingredients dispersed in water. |
| Wettable powder | A wettable powder (WP) is a powder formulation that forms a suspension when mixed with water prior to spraying. |
| Emulsifiable concentrate | Emulsifiable concentrate (EC) is a concentrated liquid formulation of pesticide that needs to be diluted with water to create a spray solution. |
| Plant-parasitic nematodes | Parasitic Nematodes feed on the roots of crops, causing damage to the roots. These damages allow for easy plant infestation by soil-borne pathogens, which results in crop or yield loss. |
| Australian Weeds Strategy (AWS) | The Australian Weeds Strategy, owned by the Environment and Invasives Committee, provides national guidance on weed management. |
| Weed Science Society of Japan (WSSJ) | WSSJ aims to contribute to the prevention of weed damage and the utilization of weed value by providing the chance for research presentation and information exchange. |


Research Methodology
Mordor Intelligence follows a four-step methodology in all our reports.
- Step-1: Identify Key Variables: In order to build a robust forecasting methodology, the variables and factors identified in Step-1 are tested against available historical market numbers. Through an iterative process, the variables required for market forecast are set and the model is built on the basis of these variables.
- Step-2: Build a Market Model: Market-size estimations for the forecast years are in nominal terms. Inflation is not a part of the pricing, and the average selling price (ASP) is kept constant throughout the forecast period.
- Step-3: Validate and Finalize: In this important step, all market numbers, variables and analyst calls are validated through an extensive network of primary research experts from the market studied. The respondents are selected across levels and functions to generate a holistic picture of the market studied.
- Step-4: Research Outputs: Syndicated Reports, Custom Consulting Assignments, Databases & Subscription Platforms


