Indonesia Feed Additives Market Size
Market Overview
| Study Period | 2017 - 2030 |
| Base Year For Estimation | 2024 |
| Forecast Data Period | 2025 - 2030 |
| Market Size (2025) | USD 466.1 Million |
| Market Size (2030) | USD 612.3 Million |
| Growth Rate (2025 - 2030) | 5.61% CAGR |
| Market Concentration | Low |
Major Players*Disclaimer: Major Players sorted in no particular order Image © Mordor Intelligence. Reuse requires attribution under CC BY 4.0. |
|

Indonesia Feed Additives Market Analysis
The Indonesia Feed Additives Market size is estimated at 466.1 million USD in 2025, and is expected to reach 612.3 million USD by 2030, growing at a CAGR of 5.61% during the forecast period (2025-2030).
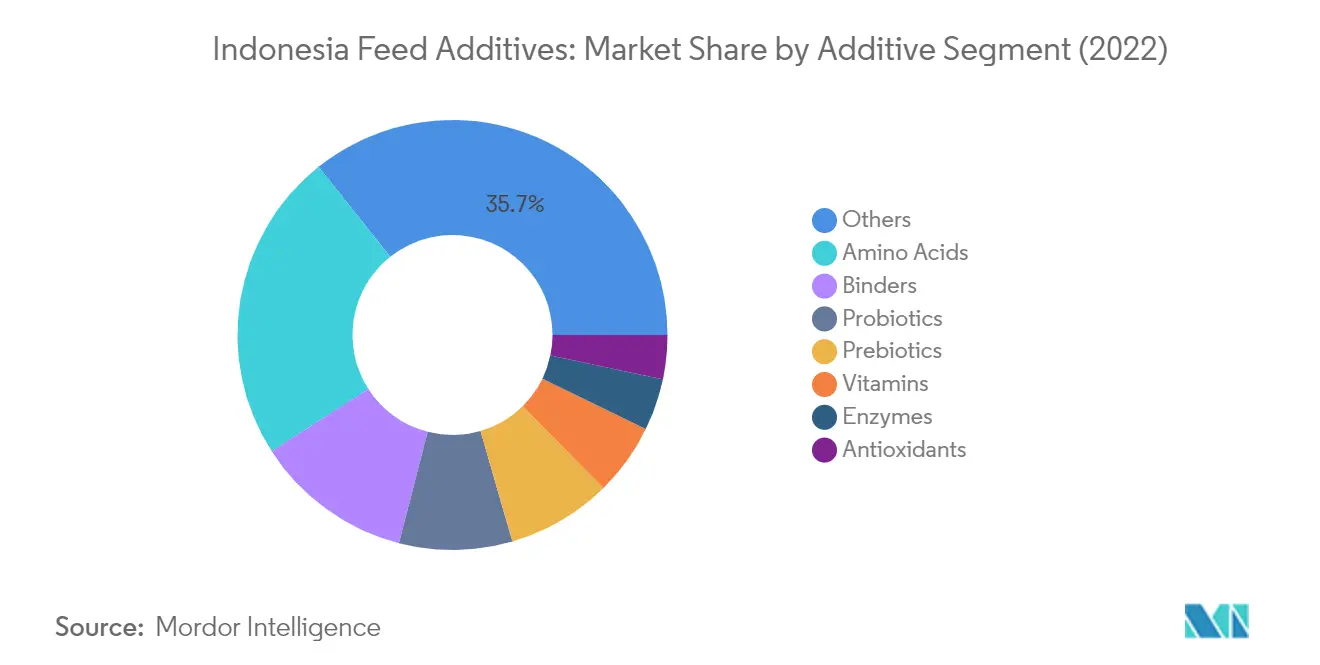
The Indonesian feed additives industry has evolved significantly, driven by an increasing focus on animal nutrition additives and feed efficiency. The industry structure is characterized by a heavy reliance on key additive categories, with amino acids, binders, minerals, and probiotics collectively accounting for 54% of the total feed additives market in 2022. This concentration reflects the industry's emphasis on essential nutritional components and feed optimization. The market has witnessed substantial technological advancements in feed formulation and manufacturing processes, with manufacturers increasingly adopting automated systems and precision feeding technologies to ensure optimal additive incorporation and uniform feed quality.
The market landscape is experiencing a notable shift toward synthetic and specialized feed additives, particularly in the binders segment. Synthetic binders dominated the market with a 67.1% share of the total feed binders segment in 2022, highlighting the industry's preference for scientifically formulated solutions. This trend is further reinforced by the growing adoption of advanced feed amino acids supplements, with lysine and methionine emerging as crucial components, collectively representing approximately 65% of the feed amino acids market in 2022. These developments reflect the industry's increasing sophistication and alignment with global feed manufacturing standards.
A significant transformation is occurring in feed manufacturing practices, with increased emphasis on quality control and safety measures. The industry has witnessed substantial investments in modern manufacturing facilities and quality assurance systems, particularly in regions with high livestock concentration. The trend toward sustainable and environmentally responsible production methods has gained momentum, with manufacturers implementing eco-friendly processes and exploring alternative raw materials. This shift is accompanied by stringent regulatory compliance measures and an increased focus on traceability throughout the supply chain.
The market is experiencing rapid technological integration across the value chain, from raw material sourcing to final product distribution. Digital solutions, including blockchain technology and IoT-enabled monitoring systems, are being increasingly adopted to enhance supply chain transparency and product quality control. The industry has also witnessed a surge in research and development activities, focusing on developing novel nutritional feed additives with improved efficacy and reduced environmental impact. These advancements are complemented by the establishment of specialized research facilities and collaborations between industry players and academic institutions to drive innovation in feed additive formulations.
Indonesia Feed Additives Market Trends
High consumption of eggs is leading to growth in the poultry production to meet the increased demand for poultry products
- The poultry industry in Indonesia experienced both growth and decline in recent years. Due to the religious ban on consuming pork, chicken meat has become a major source of animal protein in the country, leading to an increase in poultry production. From 2017 to 2022, poultry chicken production in the country increased by 7.7%, reaching a record high of 3.7 billion bird count in 2022.
- However, the poultry industry faced a setback in 2020 when poultry production decreased by 6.2% from the previous year due to the farming ministry's orders for poultry breeders to cull down 4.4 million chickens and cut the number of hatching eggs by 7 million per week to control a slump in poultry prices.
- Despite the challenges, egg consumption in the country continues to rise due to changing diets and a search for lower-cost protein, leading to a shift in egg consumption. This factor is expected to drive the growth of layer production, thereby increasing the layer feed additives value by 44.3% from 2023 to USD 182.4 million in 2029. These additives play a significant role in increasing the productivity of eggs.
- Indonesian poultry production is expected to improve due to increasing consumption. For instance, the per capita poultry meat consumption increased by 7.1% from 2017 to 8.21 kg in 2022, and it is projected to reach 9.01 kg in 2027 due to the rising demand for animal protein.
- The increasing export demand is also creating opportunities for expanding poultry production. Indonesia hopes to export chicken to Singapore to fill the gap vacated by Malaysia’s poultry export ban. This rising per capita poultry consumption, increasing production of poultry, and opportunities from export are expected to fuel the growth of the market studied during the forecast period.

Expansion of fish farms and government policies to support infrastructure and technology are some of the factors helping in increasing the aqua population and feed production
- Indonesia is one of the largest aquaculture producers in the world, with approximately 2.5 million farmers involved in the industry. The country witnessed a 35% increase in aquaculture feed production since 2017, reaching 1.7 million metric tons in 2022 due to the growth of aquaculture and fisheries and an increase in per capita consumption of aquaculture products. The Indonesian government played a crucial role in expanding the aquaculture sector and drafting robust policies to support infrastructure, entrepreneurship, technology, environmental concerns, and production systems.
- Fish held the largest share of the various aquaculture feeds, accounting for 85.2% in 2022 due to the increasing awareness of the benefits of fish in the human diet, high demand in the international market, the expansion of the retail sector, and the presence of numerous fish farms throughout the country. Most fish farms are located in Central Java.
- Shrimp accounted for 7.0% of the aquaculture feed market in 2022, as it is the second most consumed aquatic animal due to the rise in demand for seafood and its high protein content. The profit margin for shrimp is higher than other commodities, such as catfish, at 15%. To increase productivity and performance, shrimp farmers are focusing on health and nutrition management practices.
- Factors such as the growing awareness about the benefits of compound feed consumption, government policies, increasing demand for fish and seafood, and rising feed production of aquaculture are expected to drive the growth of the feed additives market during the forecast period.

OTHER KEY INDUSTRY TRENDS COVERED IN THE REPORT
- Government support to investors for cattle breeding and higher demand for dairy products is driving the demand for ruminants production
- Increasing the demand for poultry feed as the poultry population increased due to high demand for poultry meat especially chicken meat and expansion of poultry farms
- The compound feed for swine is expected to increase due to increasing swine production for meeting the increased demand for pork but African Swine Fever (ASF) had a negative impact on the pig feed
- Swine production is lower in the country due to religious factors but producers are exporting the beef which is increasing its population
- Ruminants feed production is increasing as there is high demand for diary products but it was affected by decreasing ruminants population due to Lumpy Skin Disease (LSD) and other foot diseases
Segment Analysis: By Additive
Amino Acids Segment in Indonesia Feed Additives Market
Amino acids represent the largest segment in Indonesia's feed additives market, commanding approximately 24% market share in 2024. The segment's dominance is primarily attributed to its crucial role in protein synthesis, immune system function, and gut development across various animal species. In the poultry sector, which accounts for nearly 58% of feed amino acids consumption, these additives are essential for muscle development and egg production. Lysine and methionine are the most significant amino acids in the market, together accounting for about 65% of the total amino acids segment, due to their importance in regulating metabolic processes and improving digestive functions in animals.
Acidifiers Segment in Indonesia Feed Additives Market
The feed acidifiers segment is emerging as the fastest-growing category in Indonesia's feed additives market, projected to expand at approximately 6% CAGR from 2024 to 2029. This remarkable growth is driven by increasing awareness of acidifiers' ability to enhance feed palatability and increase the permeability of mucosal cells in the intestine. Propionic acid and fumaric acid are leading this growth, as they effectively improve feed intake and nutrient absorption while reducing pathogenic microbes. The segment's expansion is further supported by the rising demand for natural growth promoters and the increasing focus on animal gut health and performance improvement across various livestock sectors.
Remaining Segments in Feed Additives Market
The Indonesian feed additives market encompasses several other significant segments, including binders, feed minerals, feed probiotics, prebiotics, feed vitamins, feed enzymes, and feed antioxidants. Binders play a crucial role in improving feed quality and reducing nutrient loss during processing and storage. Minerals and vitamins are essential for animal growth, development, and immune function, while probiotics and prebiotics focus on gut health improvement and disease prevention. Enzymes enhance nutrient digestibility and feed conversion efficiency, particularly in poultry and swine feeds. Antioxidants help extend feed shelf life and maintain nutritional quality. Each of these segments contributes uniquely to the overall market dynamics, addressing specific nutritional and health requirements across different livestock species.
Segment Analysis: By Animal
Poultry Segment in Indonesia Feed Additives Market
The poultry feed additives segment dominates the Indonesia feed additives market, commanding approximately 57% of the total market value in 2024, making it both the largest and fastest-growing segment. This dominant position is primarily attributed to the extensive feed production for poultry birds, which exceeded 10.4 million metric tons in recent years. The segment's leadership is further strengthened by the increasing demand for poultry meat and eggs in Indonesia, where chicken meat has become a major source of animal protein due to religious dietary restrictions on pork consumption. The segment's growth is also driven by the expansion of commercial poultry farming operations, particularly in layer and broiler production. Additionally, Indonesia's strategic position as a poultry exporter to Singapore, especially following Malaysia's export restrictions, has further boosted the demand for feed additives in this segment.
Aquaculture Segment in Indonesia Feed Additives Market
The aquaculture segment in Indonesia's feed additives market is experiencing significant growth, driven by the country's position as one of the world's largest aquaculture producers. The segment's expansion is supported by approximately 2.5 million farmers involved in the industry and robust government policies supporting infrastructure development, entrepreneurship, and technological advancement in aquaculture production systems. The growth is particularly notable in fish farming, which holds the majority share within the aquaculture segment, driven by increasing awareness of fish's nutritional benefits and strong international market demand. The segment's development is further enhanced by the government's initiatives to expand aquaculture production capacity and improve feed efficiency through advanced nutrition management practices.
Remaining Segments in Animal Feed Additives Market
The remaining segments in Indonesia's feed additives market include ruminants and swine, each playing distinct roles in the market landscape. The ruminants segment, particularly focused on dairy and beef cattle, maintains a significant presence in the market despite facing challenges from disease outbreaks and climate-related issues. The segment's importance is underscored by the government's active support for investors in cattle production and the growing demand for dairy products. The swine segment, while smaller due to religious dietary restrictions in predominantly Muslim Indonesia, remains crucial in specific provinces such as East Nusa Tenggara, Bali, and North Sumatra, where it serves both domestic consumption and export markets.
Indonesia Feed Additives Industry Overview
Top Companies in Indonesia Feed Additives Market
The Indonesia feed additives market features prominent global players like Cargill Inc., Archer Daniels Midland Co., SHV (Nutreco NV), DSM Nutritional Products AG, and BASF SE leading the industry through continuous innovation and strategic initiatives. Companies are heavily investing in research and development to expand their product portfolios, particularly focusing on enzyme technology, feed phytogenics, and sustainable nutrition solutions. Strategic partnerships and collaborations have become increasingly common, with major players forming alliances to strengthen their distribution networks and enhance their technological capabilities. Manufacturing facility expansions and upgrades are being prioritized to meet growing regional demand, while companies are also focusing on developing customized solutions for different animal species. The industry demonstrates a strong commitment to operational excellence through investments in quality control systems and supply chain optimization.
Fragmented Market with Strong Global Presence
The Indonesian feed additives market exhibits a fragmented structure with a mix of global conglomerates and specialized regional players competing for market share. Global leaders leverage their extensive research capabilities, established distribution networks, and diverse product portfolios to maintain their competitive positions, while local players capitalize on their market knowledge and established relationships with feed manufacturers. The market demonstrates moderate consolidation, with the top players collectively holding a significant but not dominant share, allowing room for smaller specialized manufacturers to operate in specific product segments or regional markets. The competitive dynamics are characterized by a balance between large-scale operations of multinational companies and the agility of local players in meeting specific market needs.
The industry has witnessed several strategic acquisitions and partnerships aimed at expanding product offerings and strengthening market presence. Global players are increasingly focusing on establishing local manufacturing facilities and forming joint ventures with Indonesian companies to enhance their market penetration. The competitive landscape is evolving with companies adopting various strategies such as vertical integration, technological advancement, and customer-centric approaches to gain competitive advantages. Regional players are strengthening their positions through specialization in specific animal feed supplements categories and building strong relationships with local livestock producers.
Innovation and Localization Drive Future Success
Success in the Indonesian feed additives market increasingly depends on companies' ability to innovate while adapting to local market conditions and regulatory requirements. Market leaders are focusing on developing sustainable and natural animal nutrition ingredients to address growing concerns about antibiotic resistance and environmental impact. Companies need to invest in local research and development facilities to better understand regional livestock needs and develop tailored solutions. Building strong relationships with key stakeholders, including feed manufacturers, livestock producers, and regulatory bodies, is becoming crucial for maintaining market position. The ability to provide comprehensive technical support and demonstrate product effectiveness through local trials is emerging as a key differentiator in the market.
Future growth opportunities lie in developing cost-effective solutions that meet the specific needs of Indonesian livestock producers while complying with evolving regulations. Companies need to strengthen their distribution networks and establish a strong local presence through partnerships or direct investments. The market shows potential for new entrants who can offer innovative solutions in emerging segments such as natural growth promoters and gut health modulators. Success factors include the ability to maintain consistent product quality, provide reliable supply chains, and offer competitive pricing while investing in customer education and technical support. Companies that can effectively balance product innovation with local market requirements while maintaining operational efficiency are likely to gain competitive advantages in the evolving market landscape.
Indonesia Feed Additives Market Leaders
-
Archer Daniel Midland Co.
-
BASF SE
-
Cargill Inc.
-
DSM Nutritional Products AG
-
SHV (Nutreco NV)
- *Disclaimer: Major Players sorted in no particular order

Indonesia Feed Additives Market News
- January 2023: Novus International acquired the Biotech company Agrivida to develop new feed additives.
- November 2022: Kemin Industries introduced Toxfin Care, a solution that protects feed from mycotoxins. It strengthens the immune system, protects organs, and prevents loss of performance and productivity.
- July 2022: Kemin Industries has introduced Enterosure probiotic products to control the growth of pathogenic bacteria in poultry and livestock.
Free With This Report
We provide a complimentary and exhaustive set of data points on regional and country-level metrics that present the fundamental structure of the industry. Presented in the form of 35+ free charts, the section covers difficult-to-find data of various regions on feed production through various animal categories such as Ruminants, Poultry, Swine, and Aquaculture.


List of Tables & Figures
- Figure 1:
- POPULATION OF POULTRY, NUMBER, INDONESIA, 2017-2022
- Figure 2:
- POPULATION OF RUMINANTS, NUMBER, INDONESIA, 2017-2022
- Figure 3:
- POPULATION OF SWINE, NUMBER, INDONESIA, 2017-2022
- Figure 4:
- PRODUCTION VOLUME OF AQUACULTURE FEED, METRIC TON, INDONESIA, 2017-2022
- Figure 5:
- PRODUCTION VOLUME OF POULTRY FEED, METRIC TON, INDONESIA, 2017-2022
- Figure 6:
- PRODUCTION VOLUME OF RUMINANTS FEED, METRIC TON, INDONESIA, 2017-2022
- Figure 7:
- PRODUCTION VOLUME OF SWINE FEED, METRIC TON, INDONESIA, 2017-2022
- Figure 8:
- VOLUME OF FEED ADDITIVE, METRIC TON, INDONESIA, 2017 - 2029
- Figure 9:
- VALUE OF FEED ADDITIVE, USD, INDONESIA, 2017 - 2029
- Figure 10:
- VOLUME OF FEED ADDITIVE BY ADDITIVE CATEGORIES, METRIC TON, INDONESIA, 2017 - 2029
- Figure 11:
- VALUE OF FEED ADDITIVE BY ADDITIVE CATEGORIES, USD, INDONESIA, 2017 - 2029
- Figure 12:
- VOLUME SHARE OF FEED ADDITIVE BY ADDITIVE CATEGORIES, %, INDONESIA, 2017,2023 AND 2029
- Figure 13:
- VALUE SHARE OF FEED ADDITIVE BY ADDITIVE CATEGORIES, %, INDONESIA, 2017,2023 AND 2029
- Figure 14:
- VOLUME OF FEED ACIDIFIERS BY SUB ADDITIVE CATEGORIES, METRIC TON, INDONESIA, 2017 - 2029
- Figure 15:
- VALUE OF FEED ACIDIFIERS BY SUB ADDITIVE CATEGORIES, USD, INDONESIA, 2017 - 2029
- Figure 16:
- VOLUME SHARE OF FEED ACIDIFIERS BY SUB ADDITIVE CATEGORIES, %, INDONESIA, 2017,2023 AND 2029
- Figure 17:
- VALUE SHARE OF FEED ACIDIFIERS BY SUB ADDITIVE CATEGORIES, %, INDONESIA, 2017,2023 AND 2029
- Figure 18:
- VOLUME OF FUMARIC ACID FEED ACIDIFIERS, METRIC TON, INDONESIA, 2017 - 2029
- Figure 19:
- VALUE OF FUMARIC ACID FEED ACIDIFIERS, USD, INDONESIA, 2017 - 2029
- Figure 20:
- VOLUME OF LACTIC ACID FEED ACIDIFIERS, METRIC TON, INDONESIA, 2017 - 2029
- Figure 21:
- VALUE OF LACTIC ACID FEED ACIDIFIERS, USD, INDONESIA, 2017 - 2029
- Figure 22:
- VOLUME OF PROPIONIC ACID FEED ACIDIFIERS, METRIC TON, INDONESIA, 2017 - 2029
- Figure 23:
- VALUE OF PROPIONIC ACID FEED ACIDIFIERS, USD, INDONESIA, 2017 - 2029
- Figure 24:
- VOLUME OF OTHER ACIDIFIERS FEED ACIDIFIERS, METRIC TON, INDONESIA, 2017 - 2029
- Figure 25:
- VALUE OF OTHER ACIDIFIERS FEED ACIDIFIERS, USD, INDONESIA, 2017 - 2029
- Figure 26:
- VOLUME OF FEED AMINO ACIDS BY SUB ADDITIVE CATEGORIES, METRIC TON, INDONESIA, 2017 - 2029
- Figure 27:
- VALUE OF FEED AMINO ACIDS BY SUB ADDITIVE CATEGORIES, USD, INDONESIA, 2017 - 2029
- Figure 28:
- VOLUME SHARE OF FEED AMINO ACIDS BY SUB ADDITIVE CATEGORIES, %, INDONESIA, 2017,2023 AND 2029
- Figure 29:
- VALUE SHARE OF FEED AMINO ACIDS BY SUB ADDITIVE CATEGORIES, %, INDONESIA, 2017,2023 AND 2029
- Figure 30:
- VOLUME OF LYSINE FEED AMINO ACIDS, METRIC TON, INDONESIA, 2017 - 2029
- Figure 31:
- VALUE OF LYSINE FEED AMINO ACIDS, USD, INDONESIA, 2017 - 2029
- Figure 32:
- VOLUME OF METHIONINE FEED AMINO ACIDS, METRIC TON, INDONESIA, 2017 - 2029
- Figure 33:
- VALUE OF METHIONINE FEED AMINO ACIDS, USD, INDONESIA, 2017 - 2029
- Figure 34:
- VOLUME OF THREONINE FEED AMINO ACIDS, METRIC TON, INDONESIA, 2017 - 2029
- Figure 35:
- VALUE OF THREONINE FEED AMINO ACIDS, USD, INDONESIA, 2017 - 2029
- Figure 36:
- VOLUME OF TRYPTOPHAN FEED AMINO ACIDS, METRIC TON, INDONESIA, 2017 - 2029
- Figure 37:
- VALUE OF TRYPTOPHAN FEED AMINO ACIDS, USD, INDONESIA, 2017 - 2029
- Figure 38:
- VOLUME OF OTHER AMINO ACIDS FEED AMINO ACIDS, METRIC TON, INDONESIA, 2017 - 2029
- Figure 39:
- VALUE OF OTHER AMINO ACIDS FEED AMINO ACIDS, USD, INDONESIA, 2017 - 2029
- Figure 40:
- VOLUME OF FEED ANTIBIOTICS BY SUB ADDITIVE CATEGORIES, METRIC TON, INDONESIA, 2017 - 2029
- Figure 41:
- VALUE OF FEED ANTIBIOTICS BY SUB ADDITIVE CATEGORIES, USD, INDONESIA, 2017 - 2029
- Figure 42:
- VOLUME SHARE OF FEED ANTIBIOTICS BY SUB ADDITIVE CATEGORIES, %, INDONESIA, 2017,2023 AND 2029
- Figure 43:
- VALUE SHARE OF FEED ANTIBIOTICS BY SUB ADDITIVE CATEGORIES, %, INDONESIA, 2017,2023 AND 2029
- Figure 44:
- VOLUME OF BACITRACIN FEED ANTIBIOTICS, METRIC TON, INDONESIA, 2017 - 2029
- Figure 45:
- VALUE OF BACITRACIN FEED ANTIBIOTICS, USD, INDONESIA, 2017 - 2029
- Figure 46:
- VOLUME OF PENICILLINS FEED ANTIBIOTICS, METRIC TON, INDONESIA, 2017 - 2029
- Figure 47:
- VALUE OF PENICILLINS FEED ANTIBIOTICS, USD, INDONESIA, 2017 - 2029
- Figure 48:
- VOLUME OF TETRACYCLINES FEED ANTIBIOTICS, METRIC TON, INDONESIA, 2017 - 2029
- Figure 49:
- VALUE OF TETRACYCLINES FEED ANTIBIOTICS, USD, INDONESIA, 2017 - 2029
- Figure 50:
- VOLUME OF TYLOSIN FEED ANTIBIOTICS, METRIC TON, INDONESIA, 2017 - 2029
- Figure 51:
- VALUE OF TYLOSIN FEED ANTIBIOTICS, USD, INDONESIA, 2017 - 2029
- Figure 52:
- VOLUME OF OTHER ANTIBIOTICS FEED ANTIBIOTICS, METRIC TON, INDONESIA, 2017 - 2029
- Figure 53:
- VALUE OF OTHER ANTIBIOTICS FEED ANTIBIOTICS, USD, INDONESIA, 2017 - 2029
- Figure 54:
- VOLUME OF FEED ANTIOXIDANTS BY SUB ADDITIVE CATEGORIES, METRIC TON, INDONESIA, 2017 - 2029
- Figure 55:
- VALUE OF FEED ANTIOXIDANTS BY SUB ADDITIVE CATEGORIES, USD, INDONESIA, 2017 - 2029
- Figure 56:
- VOLUME SHARE OF FEED ANTIOXIDANTS BY SUB ADDITIVE CATEGORIES, %, INDONESIA, 2017,2023 AND 2029
- Figure 57:
- VALUE SHARE OF FEED ANTIOXIDANTS BY SUB ADDITIVE CATEGORIES, %, INDONESIA, 2017,2023 AND 2029
- Figure 58:
- VOLUME OF BUTYLATED HYDROXYANISOLE (BHA) FEED ANTIOXIDANTS, METRIC TON, INDONESIA, 2017 - 2029
- Figure 59:
- VALUE OF BUTYLATED HYDROXYANISOLE (BHA) FEED ANTIOXIDANTS, USD, INDONESIA, 2017 - 2029
- Figure 60:
- VOLUME OF BUTYLATED HYDROXYTOLUENE (BHT) FEED ANTIOXIDANTS, METRIC TON, INDONESIA, 2017 - 2029
- Figure 61:
- VALUE OF BUTYLATED HYDROXYTOLUENE (BHT) FEED ANTIOXIDANTS, USD, INDONESIA, 2017 - 2029
- Figure 62:
- VOLUME OF CITRIC ACID FEED ANTIOXIDANTS, METRIC TON, INDONESIA, 2017 - 2029
- Figure 63:
- VALUE OF CITRIC ACID FEED ANTIOXIDANTS, USD, INDONESIA, 2017 - 2029
- Figure 64:
- VOLUME OF ETHOXYQUIN FEED ANTIOXIDANTS, METRIC TON, INDONESIA, 2017 - 2029
- Figure 65:
- VALUE OF ETHOXYQUIN FEED ANTIOXIDANTS, USD, INDONESIA, 2017 - 2029
- Figure 66:
- VOLUME OF PROPYL GALLATE FEED ANTIOXIDANTS, METRIC TON, INDONESIA, 2017 - 2029
- Figure 67:
- VALUE OF PROPYL GALLATE FEED ANTIOXIDANTS, USD, INDONESIA, 2017 - 2029
- Figure 68:
- VOLUME OF TOCOPHEROLS FEED ANTIOXIDANTS, METRIC TON, INDONESIA, 2017 - 2029
- Figure 69:
- VALUE OF TOCOPHEROLS FEED ANTIOXIDANTS, USD, INDONESIA, 2017 - 2029
- Figure 70:
- VOLUME OF OTHER ANTIOXIDANTS FEED ANTIOXIDANTS, METRIC TON, INDONESIA, 2017 - 2029
- Figure 71:
- VALUE OF OTHER ANTIOXIDANTS FEED ANTIOXIDANTS, USD, INDONESIA, 2017 - 2029
- Figure 72:
- VOLUME OF FEED BINDERS BY SUB ADDITIVE CATEGORIES, METRIC TON, INDONESIA, 2017 - 2029
- Figure 73:
- VALUE OF FEED BINDERS BY SUB ADDITIVE CATEGORIES, USD, INDONESIA, 2017 - 2029
- Figure 74:
- VOLUME SHARE OF FEED BINDERS BY SUB ADDITIVE CATEGORIES, %, INDONESIA, 2017,2023 AND 2029
- Figure 75:
- VALUE SHARE OF FEED BINDERS BY SUB ADDITIVE CATEGORIES, %, INDONESIA, 2017,2023 AND 2029
- Figure 76:
- VOLUME OF NATURAL BINDERS FEED BINDERS, METRIC TON, INDONESIA, 2017 - 2029
- Figure 77:
- VALUE OF NATURAL BINDERS FEED BINDERS, USD, INDONESIA, 2017 - 2029
- Figure 78:
- VOLUME OF SYNTHETIC BINDERS FEED BINDERS, METRIC TON, INDONESIA, 2017 - 2029
- Figure 79:
- VALUE OF SYNTHETIC BINDERS FEED BINDERS, USD, INDONESIA, 2017 - 2029
- Figure 80:
- VOLUME OF FEED ENZYMES BY SUB ADDITIVE CATEGORIES, METRIC TON, INDONESIA, 2017 - 2029
- Figure 81:
- VALUE OF FEED ENZYMES BY SUB ADDITIVE CATEGORIES, USD, INDONESIA, 2017 - 2029
- Figure 82:
- VOLUME SHARE OF FEED ENZYMES BY SUB ADDITIVE CATEGORIES, %, INDONESIA, 2017,2023 AND 2029
- Figure 83:
- VALUE SHARE OF FEED ENZYMES BY SUB ADDITIVE CATEGORIES, %, INDONESIA, 2017,2023 AND 2029
- Figure 84:
- VOLUME OF CARBOHYDRASES FEED ENZYMES, METRIC TON, INDONESIA, 2017 - 2029
- Figure 85:
- VALUE OF CARBOHYDRASES FEED ENZYMES, USD, INDONESIA, 2017 - 2029
- Figure 86:
- VOLUME OF PHYTASES FEED ENZYMES, METRIC TON, INDONESIA, 2017 - 2029
- Figure 87:
- VALUE OF PHYTASES FEED ENZYMES, USD, INDONESIA, 2017 - 2029
- Figure 88:
- VOLUME OF OTHER ENZYMES FEED ENZYMES, METRIC TON, INDONESIA, 2017 - 2029
- Figure 89:
- VALUE OF OTHER ENZYMES FEED ENZYMES, USD, INDONESIA, 2017 - 2029
- Figure 90:
- VOLUME OF FEED FLAVORS & SWEETENERS BY SUB ADDITIVE CATEGORIES, METRIC TON, INDONESIA, 2017 - 2029
- Figure 91:
- VALUE OF FEED FLAVORS & SWEETENERS BY SUB ADDITIVE CATEGORIES, USD, INDONESIA, 2017 - 2029
- Figure 92:
- VOLUME SHARE OF FEED FLAVORS & SWEETENERS BY SUB ADDITIVE CATEGORIES, %, INDONESIA, 2017,2023 AND 2029
- Figure 93:
- VALUE SHARE OF FEED FLAVORS & SWEETENERS BY SUB ADDITIVE CATEGORIES, %, INDONESIA, 2017,2023 AND 2029
- Figure 94:
- VOLUME OF FLAVORS FEED FLAVORS & SWEETENERS, METRIC TON, INDONESIA, 2017 - 2029
- Figure 95:
- VALUE OF FLAVORS FEED FLAVORS & SWEETENERS, USD, INDONESIA, 2017 - 2029
- Figure 96:
- VOLUME OF SWEETENERS FEED FLAVORS & SWEETENERS, METRIC TON, INDONESIA, 2017 - 2029
- Figure 97:
- VALUE OF SWEETENERS FEED FLAVORS & SWEETENERS, USD, INDONESIA, 2017 - 2029
- Figure 98:
- VOLUME OF FEED MINERALS BY SUB ADDITIVE CATEGORIES, METRIC TON, INDONESIA, 2017 - 2029
- Figure 99:
- VALUE OF FEED MINERALS BY SUB ADDITIVE CATEGORIES, USD, INDONESIA, 2017 - 2029
- Figure 100:
- VOLUME SHARE OF FEED MINERALS BY SUB ADDITIVE CATEGORIES, %, INDONESIA, 2017,2023 AND 2029
- Figure 101:
- VALUE SHARE OF FEED MINERALS BY SUB ADDITIVE CATEGORIES, %, INDONESIA, 2017,2023 AND 2029
- Figure 102:
- VOLUME OF MACROMINERALS FEED MINERALS, METRIC TON, INDONESIA, 2017 - 2029
- Figure 103:
- VALUE OF MACROMINERALS FEED MINERALS, USD, INDONESIA, 2017 - 2029
- Figure 104:
- VOLUME OF MICROMINERALS FEED MINERALS, METRIC TON, INDONESIA, 2017 - 2029
- Figure 105:
- VALUE OF MICROMINERALS FEED MINERALS, USD, INDONESIA, 2017 - 2029
- Figure 106:
- VOLUME OF FEED MYCOTOXIN DETOXIFIERS BY SUB ADDITIVE CATEGORIES, METRIC TON, INDONESIA, 2017 - 2029
- Figure 107:
- VALUE OF FEED MYCOTOXIN DETOXIFIERS BY SUB ADDITIVE CATEGORIES, USD, INDONESIA, 2017 - 2029
- Figure 108:
- VOLUME SHARE OF FEED MYCOTOXIN DETOXIFIERS BY SUB ADDITIVE CATEGORIES, %, INDONESIA, 2017,2023 AND 2029
- Figure 109:
- VALUE SHARE OF FEED MYCOTOXIN DETOXIFIERS BY SUB ADDITIVE CATEGORIES, %, INDONESIA, 2017,2023 AND 2029
- Figure 110:
- VOLUME OF BINDERS FEED MYCOTOXIN DETOXIFIERS, METRIC TON, INDONESIA, 2017 - 2029
- Figure 111:
- VALUE OF BINDERS FEED MYCOTOXIN DETOXIFIERS, USD, INDONESIA, 2017 - 2029
- Figure 112:
- VOLUME OF BIOTRANSFORMERS FEED MYCOTOXIN DETOXIFIERS, METRIC TON, INDONESIA, 2017 - 2029
- Figure 113:
- VALUE OF BIOTRANSFORMERS FEED MYCOTOXIN DETOXIFIERS, USD, INDONESIA, 2017 - 2029
- Figure 114:
- VOLUME OF FEED PHYTOGENICS BY SUB ADDITIVE CATEGORIES, METRIC TON, INDONESIA, 2017 - 2029
- Figure 115:
- VALUE OF FEED PHYTOGENICS BY SUB ADDITIVE CATEGORIES, USD, INDONESIA, 2017 - 2029
- Figure 116:
- VOLUME SHARE OF FEED PHYTOGENICS BY SUB ADDITIVE CATEGORIES, %, INDONESIA, 2017,2023 AND 2029
- Figure 117:
- VALUE SHARE OF FEED PHYTOGENICS BY SUB ADDITIVE CATEGORIES, %, INDONESIA, 2017,2023 AND 2029
- Figure 118:
- VOLUME OF ESSENTIAL OIL FEED PHYTOGENICS, METRIC TON, INDONESIA, 2017 - 2029
- Figure 119:
- VALUE OF ESSENTIAL OIL FEED PHYTOGENICS, USD, INDONESIA, 2017 - 2029
- Figure 120:
- VOLUME OF HERBS & SPICES FEED PHYTOGENICS, METRIC TON, INDONESIA, 2017 - 2029
- Figure 121:
- VALUE OF HERBS & SPICES FEED PHYTOGENICS, USD, INDONESIA, 2017 - 2029
- Figure 122:
- VOLUME OF HERBS & SPIECES FEED PHYTOGENICS, METRIC TON, INDONESIA, 2017 - 2029
- Figure 123:
- VALUE OF HERBS & SPIECES FEED PHYTOGENICS, USD, INDONESIA, 2017 - 2029
- Figure 124:
- VOLUME OF OTHER PHYTOGENICS FEED PHYTOGENICS, METRIC TON, INDONESIA, 2017 - 2029
- Figure 125:
- VALUE OF OTHER PHYTOGENICS FEED PHYTOGENICS, USD, INDONESIA, 2017 - 2029
- Figure 126:
- VOLUME OF FEED PIGMENTS BY SUB ADDITIVE CATEGORIES, METRIC TON, INDONESIA, 2017 - 2029
- Figure 127:
- VALUE OF FEED PIGMENTS BY SUB ADDITIVE CATEGORIES, USD, INDONESIA, 2017 - 2029
- Figure 128:
- VOLUME SHARE OF FEED PIGMENTS BY SUB ADDITIVE CATEGORIES, %, INDONESIA, 2017,2023 AND 2029
- Figure 129:
- VALUE SHARE OF FEED PIGMENTS BY SUB ADDITIVE CATEGORIES, %, INDONESIA, 2017,2023 AND 2029
- Figure 130:
- VOLUME OF CAROTENOIDS FEED PIGMENTS, METRIC TON, INDONESIA, 2017 - 2029
- Figure 131:
- VALUE OF CAROTENOIDS FEED PIGMENTS, USD, INDONESIA, 2017 - 2029
- Figure 132:
- VOLUME OF CURCUMIN & SPIRULINA FEED PIGMENTS, METRIC TON, INDONESIA, 2017 - 2029
- Figure 133:
- VALUE OF CURCUMIN & SPIRULINA FEED PIGMENTS, USD, INDONESIA, 2017 - 2029
- Figure 134:
- VOLUME OF FEED PREBIOTICS BY SUB ADDITIVE CATEGORIES, METRIC TON, INDONESIA, 2017 - 2029
- Figure 135:
- VALUE OF FEED PREBIOTICS BY SUB ADDITIVE CATEGORIES, USD, INDONESIA, 2017 - 2029
- Figure 136:
- VOLUME SHARE OF FEED PREBIOTICS BY SUB ADDITIVE CATEGORIES, %, INDONESIA, 2017,2023 AND 2029
- Figure 137:
- VALUE SHARE OF FEED PREBIOTICS BY SUB ADDITIVE CATEGORIES, %, INDONESIA, 2017,2023 AND 2029
- Figure 138:
- VOLUME OF FRUCTO OLIGOSACCHARIDES FEED PREBIOTICS, METRIC TON, INDONESIA, 2017 - 2029
- Figure 139:
- VALUE OF FRUCTO OLIGOSACCHARIDES FEED PREBIOTICS, USD, INDONESIA, 2017 - 2029
- Figure 140:
- VOLUME OF GALACTO OLIGOSACCHARIDES FEED PREBIOTICS, METRIC TON, INDONESIA, 2017 - 2029
- Figure 141:
- VALUE OF GALACTO OLIGOSACCHARIDES FEED PREBIOTICS, USD, INDONESIA, 2017 - 2029
- Figure 142:
- VOLUME OF INULIN FEED PREBIOTICS, METRIC TON, INDONESIA, 2017 - 2029
- Figure 143:
- VALUE OF INULIN FEED PREBIOTICS, USD, INDONESIA, 2017 - 2029
- Figure 144:
- VOLUME OF LACTULOSE FEED PREBIOTICS, METRIC TON, INDONESIA, 2017 - 2029
- Figure 145:
- VALUE OF LACTULOSE FEED PREBIOTICS, USD, INDONESIA, 2017 - 2029
- Figure 146:
- VOLUME OF MANNAN OLIGOSACCHARIDES FEED PREBIOTICS, METRIC TON, INDONESIA, 2017 - 2029
- Figure 147:
- VALUE OF MANNAN OLIGOSACCHARIDES FEED PREBIOTICS, USD, INDONESIA, 2017 - 2029
- Figure 148:
- VOLUME OF XYLO OLIGOSACCHARIDES FEED PREBIOTICS, METRIC TON, INDONESIA, 2017 - 2029
- Figure 149:
- VALUE OF XYLO OLIGOSACCHARIDES FEED PREBIOTICS, USD, INDONESIA, 2017 - 2029
- Figure 150:
- VOLUME OF OTHER PREBIOTICS FEED PREBIOTICS, METRIC TON, INDONESIA, 2017 - 2029
- Figure 151:
- VALUE OF OTHER PREBIOTICS FEED PREBIOTICS, USD, INDONESIA, 2017 - 2029
- Figure 152:
- VOLUME OF FEED PROBIOTICS BY SUB ADDITIVE CATEGORIES, METRIC TON, INDONESIA, 2017 - 2029
- Figure 153:
- VALUE OF FEED PROBIOTICS BY SUB ADDITIVE CATEGORIES, USD, INDONESIA, 2017 - 2029
- Figure 154:
- VOLUME SHARE OF FEED PROBIOTICS BY SUB ADDITIVE CATEGORIES, %, INDONESIA, 2017,2023 AND 2029
- Figure 155:
- VALUE SHARE OF FEED PROBIOTICS BY SUB ADDITIVE CATEGORIES, %, INDONESIA, 2017,2023 AND 2029
- Figure 156:
- VOLUME OF BIFIDOBACTERIA FEED PROBIOTICS, METRIC TON, INDONESIA, 2017 - 2029
- Figure 157:
- VALUE OF BIFIDOBACTERIA FEED PROBIOTICS, USD, INDONESIA, 2017 - 2029
- Figure 158:
- VOLUME OF ENTEROCOCCUS FEED PROBIOTICS, METRIC TON, INDONESIA, 2017 - 2029
- Figure 159:
- VALUE OF ENTEROCOCCUS FEED PROBIOTICS, USD, INDONESIA, 2017 - 2029
- Figure 160:
- VOLUME OF LACTOBACILLI FEED PROBIOTICS, METRIC TON, INDONESIA, 2017 - 2029
- Figure 161:
- VALUE OF LACTOBACILLI FEED PROBIOTICS, USD, INDONESIA, 2017 - 2029
- Figure 162:
- VOLUME OF PEDIOCOCCUS FEED PROBIOTICS, METRIC TON, INDONESIA, 2017 - 2029
- Figure 163:
- VALUE OF PEDIOCOCCUS FEED PROBIOTICS, USD, INDONESIA, 2017 - 2029
- Figure 164:
- VOLUME OF STREPTOCOCCUS FEED PROBIOTICS, METRIC TON, INDONESIA, 2017 - 2029
- Figure 165:
- VALUE OF STREPTOCOCCUS FEED PROBIOTICS, USD, INDONESIA, 2017 - 2029
- Figure 166:
- VOLUME OF OTHER PROBIOTICS FEED PROBIOTICS, METRIC TON, INDONESIA, 2017 - 2029
- Figure 167:
- VALUE OF OTHER PROBIOTICS FEED PROBIOTICS, USD, INDONESIA, 2017 - 2029
- Figure 168:
- VOLUME OF FEED VITAMINS BY SUB ADDITIVE CATEGORIES, METRIC TON, INDONESIA, 2017 - 2029
- Figure 169:
- VALUE OF FEED VITAMINS BY SUB ADDITIVE CATEGORIES, USD, INDONESIA, 2017 - 2029
- Figure 170:
- VOLUME SHARE OF FEED VITAMINS BY SUB ADDITIVE CATEGORIES, %, INDONESIA, 2017,2023 AND 2029
- Figure 171:
- VALUE SHARE OF FEED VITAMINS BY SUB ADDITIVE CATEGORIES, %, INDONESIA, 2017,2023 AND 2029
- Figure 172:
- VOLUME OF VITAMIN A FEED VITAMINS, METRIC TON, INDONESIA, 2017 - 2029
- Figure 173:
- VALUE OF VITAMIN A FEED VITAMINS, USD, INDONESIA, 2017 - 2029
- Figure 174:
- VOLUME OF VITAMIN B FEED VITAMINS, METRIC TON, INDONESIA, 2017 - 2029
- Figure 175:
- VALUE OF VITAMIN B FEED VITAMINS, USD, INDONESIA, 2017 - 2029
- Figure 176:
- VOLUME OF VITAMIN C FEED VITAMINS, METRIC TON, INDONESIA, 2017 - 2029
- Figure 177:
- VALUE OF VITAMIN C FEED VITAMINS, USD, INDONESIA, 2017 - 2029
- Figure 178:
- VOLUME OF VITAMIN E FEED VITAMINS, METRIC TON, INDONESIA, 2017 - 2029
- Figure 179:
- VALUE OF VITAMIN E FEED VITAMINS, USD, INDONESIA, 2017 - 2029
- Figure 180:
- VOLUME OF OTHER VITAMINS FEED VITAMINS, METRIC TON, INDONESIA, 2017 - 2029
- Figure 181:
- VALUE OF OTHER VITAMINS FEED VITAMINS, USD, INDONESIA, 2017 - 2029
- Figure 182:
- VOLUME OF FEED YEAST BY SUB ADDITIVE CATEGORIES, METRIC TON, INDONESIA, 2017 - 2029
- Figure 183:
- VALUE OF FEED YEAST BY SUB ADDITIVE CATEGORIES, USD, INDONESIA, 2017 - 2029
- Figure 184:
- VOLUME SHARE OF FEED YEAST BY SUB ADDITIVE CATEGORIES, %, INDONESIA, 2017,2023 AND 2029
- Figure 185:
- VALUE SHARE OF FEED YEAST BY SUB ADDITIVE CATEGORIES, %, INDONESIA, 2017,2023 AND 2029
- Figure 186:
- VOLUME OF LIVE YEAST FEED YEAST, METRIC TON, INDONESIA, 2017 - 2029
- Figure 187:
- VALUE OF LIVE YEAST FEED YEAST, USD, INDONESIA, 2017 - 2029
- Figure 188:
- VOLUME OF SELENIUM YEAST FEED YEAST, METRIC TON, INDONESIA, 2017 - 2029
- Figure 189:
- VALUE OF SELENIUM YEAST FEED YEAST, USD, INDONESIA, 2017 - 2029
- Figure 190:
- VOLUME OF SPENT YEAST FEED YEAST, METRIC TON, INDONESIA, 2017 - 2029
- Figure 191:
- VALUE OF SPENT YEAST FEED YEAST, USD, INDONESIA, 2017 - 2029
- Figure 192:
- VOLUME OF TORULA DRIED YEAST FEED YEAST, METRIC TON, INDONESIA, 2017 - 2029
- Figure 193:
- VALUE OF TORULA DRIED YEAST FEED YEAST, USD, INDONESIA, 2017 - 2029
- Figure 194:
- VOLUME OF WHEY YEAST FEED YEAST, METRIC TON, INDONESIA, 2017 - 2029
- Figure 195:
- VALUE OF WHEY YEAST FEED YEAST, USD, INDONESIA, 2017 - 2029
- Figure 196:
- VOLUME OF YEAST DERIVATIVES FEED YEAST, METRIC TON, INDONESIA, 2017 - 2029
- Figure 197:
- VALUE OF YEAST DERIVATIVES FEED YEAST, USD, INDONESIA, 2017 - 2029
- Figure 198:
- VOLUME OF YEAST DERVATIVES FEED YEAST, METRIC TON, INDONESIA, 2017 - 2029
- Figure 199:
- VALUE OF YEAST DERVATIVES FEED YEAST, USD, INDONESIA, 2017 - 2029
- Figure 200:
- VOLUME OF FEED ADDITIVE BY ANIMAL TYPE, METRIC TON, INDONESIA, 2017 - 2029
- Figure 201:
- VALUE OF FEED ADDITIVE BY ANIMAL TYPE, USD, INDONESIA, 2017 - 2029
- Figure 202:
- VOLUME SHARE OF FEED ADDITIVE BY ANIMAL TYPE, %, INDONESIA, 2017,2023 AND 2029
- Figure 203:
- VALUE SHARE OF FEED ADDITIVE BY ANIMAL TYPE, %, INDONESIA, 2017,2023 AND 2029
- Figure 204:
- VOLUME OF AQUACULTURE FEED ADDITIVE BY SUB ANIMAL TYPE, METRIC TON, INDONESIA, 2017 - 2029
- Figure 205:
- VALUE OF AQUACULTURE FEED ADDITIVE BY SUB ANIMAL TYPE, USD, INDONESIA, 2017 - 2029
- Figure 206:
- VOLUME SHARE OF AQUACULTURE FEED ADDITIVE BY SUB ANIMAL TYPE, %, INDONESIA, 2017,2023 AND 2029
- Figure 207:
- VALUE SHARE OF AQUACULTURE FEED ADDITIVE BY SUB ANIMAL TYPE, %, INDONESIA, 2017,2023 AND 2029
- Figure 208:
- VOLUME OF FISH FEED ADDITIVE, METRIC TON, INDONESIA, 2017 - 2029
- Figure 209:
- VALUE OF FISH FEED ADDITIVE, USD, INDONESIA, 2017 - 2029
- Figure 210:
- VALUE SHARE OF FISH FEED ADDITIVE BY ADDITIVE CATEGORIES, %, INDONESIA, 2022 AND 2029
- Figure 211:
- VOLUME OF SHRIMP FEED ADDITIVE, METRIC TON, INDONESIA, 2017 - 2029
- Figure 212:
- VALUE OF SHRIMP FEED ADDITIVE, USD, INDONESIA, 2017 - 2029
- Figure 213:
- VALUE SHARE OF SHRIMP FEED ADDITIVE BY ADDITIVE CATEGORIES, %, INDONESIA, 2022 AND 2029
- Figure 214:
- VOLUME OF OTHER AQUACULTURE SPECIES FEED ADDITIVE, METRIC TON, INDONESIA, 2017 - 2029
- Figure 215:
- VALUE OF OTHER AQUACULTURE SPECIES FEED ADDITIVE, USD, INDONESIA, 2017 - 2029
- Figure 216:
- VALUE SHARE OF OTHER AQUACULTURE SPECIES FEED ADDITIVE BY ADDITIVE CATEGORIES, %, INDONESIA, 2022 AND 2029
- Figure 217:
- VOLUME OF POULTRY FEED ADDITIVE BY SUB ANIMAL TYPE, METRIC TON, INDONESIA, 2017 - 2029
- Figure 218:
- VALUE OF POULTRY FEED ADDITIVE BY SUB ANIMAL TYPE, USD, INDONESIA, 2017 - 2029
- Figure 219:
- VOLUME SHARE OF POULTRY FEED ADDITIVE BY SUB ANIMAL TYPE, %, INDONESIA, 2017,2023 AND 2029
- Figure 220:
- VALUE SHARE OF POULTRY FEED ADDITIVE BY SUB ANIMAL TYPE, %, INDONESIA, 2017,2023 AND 2029
- Figure 221:
- VOLUME OF BROILER FEED ADDITIVE, METRIC TON, INDONESIA, 2017 - 2029
- Figure 222:
- VALUE OF BROILER FEED ADDITIVE, USD, INDONESIA, 2017 - 2029
- Figure 223:
- VALUE SHARE OF BROILER FEED ADDITIVE BY ADDITIVE CATEGORIES, %, INDONESIA, 2022 AND 2029
- Figure 224:
- VOLUME OF LAYER FEED ADDITIVE, METRIC TON, INDONESIA, 2017 - 2029
- Figure 225:
- VALUE OF LAYER FEED ADDITIVE, USD, INDONESIA, 2017 - 2029
- Figure 226:
- VALUE SHARE OF LAYER FEED ADDITIVE BY ADDITIVE CATEGORIES, %, INDONESIA, 2022 AND 2029
- Figure 227:
- VOLUME OF OTHER POULTRY BIRDS FEED ADDITIVE, METRIC TON, INDONESIA, 2017 - 2029
- Figure 228:
- VALUE OF OTHER POULTRY BIRDS FEED ADDITIVE, USD, INDONESIA, 2017 - 2029
- Figure 229:
- VALUE SHARE OF OTHER POULTRY BIRDS FEED ADDITIVE BY ADDITIVE CATEGORIES, %, INDONESIA, 2022 AND 2029
- Figure 230:
- VOLUME OF RUMINANTS FEED ADDITIVE BY SUB ANIMAL TYPE, METRIC TON, INDONESIA, 2017 - 2029
- Figure 231:
- VALUE OF RUMINANTS FEED ADDITIVE BY SUB ANIMAL TYPE, USD, INDONESIA, 2017 - 2029
- Figure 232:
- VOLUME SHARE OF RUMINANTS FEED ADDITIVE BY SUB ANIMAL TYPE, %, INDONESIA, 2017,2023 AND 2029
- Figure 233:
- VALUE SHARE OF RUMINANTS FEED ADDITIVE BY SUB ANIMAL TYPE, %, INDONESIA, 2017,2023 AND 2029
- Figure 234:
- VOLUME OF BEEF CATTLE FEED ADDITIVE, METRIC TON, INDONESIA, 2017 - 2029
- Figure 235:
- VALUE OF BEEF CATTLE FEED ADDITIVE, USD, INDONESIA, 2017 - 2029
- Figure 236:
- VALUE SHARE OF BEEF CATTLE FEED ADDITIVE BY ADDITIVE CATEGORIES, %, INDONESIA, 2022 AND 2029
- Figure 237:
- VOLUME OF DAIRY CATTLE FEED ADDITIVE, METRIC TON, INDONESIA, 2017 - 2029
- Figure 238:
- VALUE OF DAIRY CATTLE FEED ADDITIVE, USD, INDONESIA, 2017 - 2029
- Figure 239:
- VALUE SHARE OF DAIRY CATTLE FEED ADDITIVE BY ADDITIVE CATEGORIES, %, INDONESIA, 2022 AND 2029
- Figure 240:
- VOLUME OF OTHER RUMINANTS FEED ADDITIVE, METRIC TON, INDONESIA, 2017 - 2029
- Figure 241:
- VALUE OF OTHER RUMINANTS FEED ADDITIVE, USD, INDONESIA, 2017 - 2029
- Figure 242:
- VALUE SHARE OF OTHER RUMINANTS FEED ADDITIVE BY ADDITIVE CATEGORIES, %, INDONESIA, 2022 AND 2029
- Figure 243:
- VOLUME OF SWINE FEED ADDITIVE, METRIC TON, INDONESIA, 2017 - 2029
- Figure 244:
- VALUE OF SWINE FEED ADDITIVE, USD, INDONESIA, 2017 - 2029
- Figure 245:
- VALUE SHARE OF SWINE FEED ADDITIVE BY ADDITIVE CATEGORIES, %, INDONESIA, 2022 AND 2029
- Figure 246:
- VOLUME OF OTHER ANIMALS FEED ADDITIVE, METRIC TON, INDONESIA, 2017 - 2029
- Figure 247:
- VALUE OF OTHER ANIMALS FEED ADDITIVE, USD, INDONESIA, 2017 - 2029
- Figure 248:
- VALUE SHARE OF OTHER ANIMALS FEED ADDITIVE BY ADDITIVE CATEGORIES, %, INDONESIA, 2022 AND 2029
- Figure 249:
- MOST ACTIVE COMPANIES BY NUMBER OF STRATEGIC MOVES, COUNT, INDONESIA, 2017 - 2023
- Figure 250:
- MOST ADOPTED STRATEGIES, COUNT, INDONESIA, 2017 - 2023
- Figure 251:
- VALUE SHARE OF MAJOR PLAYERS, %, INDONESIA
Indonesia Feed Additives Industry Segmentation
Acidifiers, Amino Acids, Antibiotics, Antioxidants, Binders, Enzymes, Flavors & Sweeteners, Minerals, Mycotoxin Detoxifiers, Phytogenics, Pigments, Prebiotics, Probiotics, Vitamins, Yeast are covered as segments by Additive. Aquaculture, Poultry, Ruminants, Swine are covered as segments by Animal.| Additive | Acidifiers | By Sub Additive | Fumaric Acid | |
| Lactic Acid | ||||
| Propionic Acid | ||||
| Other Acidifiers | ||||
| Amino Acids | By Sub Additive | Lysine | ||
| Methionine | ||||
| Threonine | ||||
| Tryptophan | ||||
| Other Amino Acids | ||||
| Antibiotics | By Sub Additive | Bacitracin | ||
| Penicillins | ||||
| Tetracyclines | ||||
| Tylosin | ||||
| Other Antibiotics | ||||
| Antioxidants | By Sub Additive | Butylated Hydroxyanisole (BHA) | ||
| Butylated Hydroxytoluene (BHT) | ||||
| Citric Acid | ||||
| Ethoxyquin | ||||
| Propyl Gallate | ||||
| Tocopherols | ||||
| Other Antioxidants | ||||
| Binders | By Sub Additive | Natural Binders | ||
| Synthetic Binders | ||||
| Enzymes | By Sub Additive | Carbohydrases | ||
| Phytases | ||||
| Other Enzymes | ||||
| Flavors & Sweeteners | By Sub Additive | Flavors | ||
| Sweeteners | ||||
| Minerals | By Sub Additive | Macrominerals | ||
| Microminerals | ||||
| Mycotoxin Detoxifiers | By Sub Additive | Binders | ||
| Biotransformers | ||||
| Other Mycotoxin Detoxifiers | ||||
| Phytogenics | By Sub Additive | Essential Oil | ||
| Herbs & Spices | ||||
| Other Phytogenics | ||||
| Pigments | By Sub Additive | Carotenoids | ||
| Curcumin & Spirulina | ||||
| Prebiotics | By Sub Additive | Fructo Oligosaccharides | ||
| Galacto Oligosaccharides | ||||
| Inulin | ||||
| Lactulose | ||||
| Mannan Oligosaccharides | ||||
| Xylo Oligosaccharides | ||||
| Other Prebiotics | ||||
| Probiotics | By Sub Additive | Bifidobacteria | ||
| Enterococcus | ||||
| Lactobacilli | ||||
| Pediococcus | ||||
| Streptococcus | ||||
| Other Probiotics | ||||
| Vitamins | By Sub Additive | Vitamin A | ||
| Vitamin B | ||||
| Vitamin C | ||||
| Vitamin E | ||||
| Other Vitamins | ||||
| Yeast | By Sub Additive | Live Yeast | ||
| Selenium Yeast | ||||
| Spent Yeast | ||||
| Torula Dried Yeast | ||||
| Whey Yeast | ||||
| Yeast Derivatives | ||||
| Animal | Aquaculture | By Sub Animal | Fish | |
| Shrimp | ||||
| Other Aquaculture Species | ||||
| Poultry | By Sub Animal | Broiler | ||
| Layer | ||||
| Other Poultry Birds | ||||
| Ruminants | By Sub Animal | Beef Cattle | ||
| Dairy Cattle | ||||
| Other Ruminants | ||||
| Swine | ||||
| Other Animals | ||||
| Acidifiers | By Sub Additive | Fumaric Acid |
| Lactic Acid | ||
| Propionic Acid | ||
| Other Acidifiers | ||
| Amino Acids | By Sub Additive | Lysine |
| Methionine | ||
| Threonine | ||
| Tryptophan | ||
| Other Amino Acids | ||
| Antibiotics | By Sub Additive | Bacitracin |
| Penicillins | ||
| Tetracyclines | ||
| Tylosin | ||
| Other Antibiotics | ||
| Antioxidants | By Sub Additive | Butylated Hydroxyanisole (BHA) |
| Butylated Hydroxytoluene (BHT) | ||
| Citric Acid | ||
| Ethoxyquin | ||
| Propyl Gallate | ||
| Tocopherols | ||
| Other Antioxidants | ||
| Binders | By Sub Additive | Natural Binders |
| Synthetic Binders | ||
| Enzymes | By Sub Additive | Carbohydrases |
| Phytases | ||
| Other Enzymes | ||
| Flavors & Sweeteners | By Sub Additive | Flavors |
| Sweeteners | ||
| Minerals | By Sub Additive | Macrominerals |
| Microminerals | ||
| Mycotoxin Detoxifiers | By Sub Additive | Binders |
| Biotransformers | ||
| Other Mycotoxin Detoxifiers | ||
| Phytogenics | By Sub Additive | Essential Oil |
| Herbs & Spices | ||
| Other Phytogenics | ||
| Pigments | By Sub Additive | Carotenoids |
| Curcumin & Spirulina | ||
| Prebiotics | By Sub Additive | Fructo Oligosaccharides |
| Galacto Oligosaccharides | ||
| Inulin | ||
| Lactulose | ||
| Mannan Oligosaccharides | ||
| Xylo Oligosaccharides | ||
| Other Prebiotics | ||
| Probiotics | By Sub Additive | Bifidobacteria |
| Enterococcus | ||
| Lactobacilli | ||
| Pediococcus | ||
| Streptococcus | ||
| Other Probiotics | ||
| Vitamins | By Sub Additive | Vitamin A |
| Vitamin B | ||
| Vitamin C | ||
| Vitamin E | ||
| Other Vitamins | ||
| Yeast | By Sub Additive | Live Yeast |
| Selenium Yeast | ||
| Spent Yeast | ||
| Torula Dried Yeast | ||
| Whey Yeast | ||
| Yeast Derivatives |
| Aquaculture | By Sub Animal | Fish |
| Shrimp | ||
| Other Aquaculture Species | ||
| Poultry | By Sub Animal | Broiler |
| Layer | ||
| Other Poultry Birds | ||
| Ruminants | By Sub Animal | Beef Cattle |
| Dairy Cattle | ||
| Other Ruminants | ||
| Swine | ||
| Other Animals |
Market Definition
- FUNCTIONS - For the study, feed additives are considered to be commercially manufactured products that are used to enhance characteristics such as weight gain, feed conversion ratio, and feed intake when fed in appropriate proportions.
- RESELLERS - Companies engaged in reselling feed additives without value addition have been excluded from the market scope, to avoid double counting.
- END CONSUMERS - Compound feed manufacturers are considered to be end-consumers in the market studied. The scope excludes farmers buying feed additives to be used directly as supplements or premixes.
- INTERNAL COMPANY CONSUMPTION - Companies engaged in the production of compound feed as well as the manufacturing of feed additives are part of the study. However, while estimating the market sizes, the internal consumption of feed additives by such companies has been excluded.
| Keyword | Definition |
|---|---|
| Feed additives | Feed additives are products used in animal nutrition for purposes of improving the quality of feed and the quality of food from animal origin, or to improve the animals’ performance and health. |
| Probiotics | Probiotics are microorganisms introduced into the body for their beneficial qualities. (It maintains or restores beneficial bacteria to the gut). |
| Antibiotics | Antibiotic is a drug that is specifically used to inhibit the growth of bacteria. |
| Prebiotics | A non-digestible food ingredient that promotes the growth of beneficial microorganisms in the intestines. |
| Antioxidants | Antioxidants are compounds that inhibit oxidation, a chemical reaction that produces free radicals. |
| Phytogenics | Phytogenics are a group of natural and non-antibiotic growth promoters derived from herbs, spices, essential oils, and oleoresins. |
| Vitamins | Vitamins are organic compounds, which are required for normal growth and maintenance of the body. |
| Metabolism | A chemical process that occurs within a living organism in order to maintain life. |
| Amino acids | Amino acids are the building blocks of proteins and play an important role in metabolic pathways. |
| Enzymes | Enzyme is a substance that acts as a catalyst to bring about a specific biochemical reaction. |
| Anti-microbial resistance | The ability of a microorganism to resist the effects of an antimicrobial agent. |
| Anti-microbial | Destroying or inhibiting the growth of microorganisms. |
| Osmotic balance | It is a process of maintaining salt and water balance across membranes within the body's fluids. |
| Bacteriocin | Bacteriocins are the toxins produced by bacteria to inhibit the growth of similar or closely related bacterial strains. |
| Biohydrogenation | It is a process that occurs in the rumen of an animal in which bacteria convert unsaturated fatty acids (USFA) to saturated fatty acids (SFA). |
| Oxidative rancidity | It is a reaction of fatty acids with oxygen, which generally causes unpleasant odors in animals. To prevent these, antioxidants were added. |
| Mycotoxicosis | Any condition or disease caused by fungal toxins, mainly due to contamination of animal feed with mycotoxins. |
| Mycotoxins | Mycotoxins are toxin compounds that are naturally produced by certain types of molds (fungi). |
| Feed Probiotics | Microbial feed supplements positively affect gastrointestinal microbial balance. |
| Probiotic yeast | Feed yeast (single-cell fungi) and other fungi used as probiotics. |
| Feed enzymes | They are used to supplement digestive enzymes in an animal’s stomach to break down food. Enzymes also ensure that meat and egg production is improved. |
| Mycotoxin detoxifiers | They are used to prevent fungal growth and to stop any harmful mold from being absorbed in the gut and blood. |
| Feed antibiotics | They are used both for the prevention and treatment of diseases but also for rapid growth and development. |
| Feed antioxidants | They are used to protect the deterioration of other feed nutrients in the feed such as fats, vitamins, pigments, and flavoring agents, thus providing nutrient security to the animals. |
| Feed phytogenics | Phytogenics are natural substances, added to livestock feed to promote growth, aid in digestion, and act as anti-microbial agents. |
| Feed vitamins | They are used to maintain the normal physiological function and normal growth and development of animals. |
| Feed flavors and sweetners | These flavors and sweeteners help to mask tastes and odors during changes in additives or medications and make them ideal for animal diets undergoing transition. |
| Feed acidifiers | Animal feed acidifiers are organic acids incorporated into the feed for nutritional or preservative purposes. Acidifiers enhance congestion and microbiological balance in the alimentary and digestive tracts of livestock. |
| Feed minerals | Feed minerals play an important role in the regular dietary requirements of animal feed. |
| Feed binders | Feed binders are the binding agents used in the manufacture of safe animal feed products. It enhances the taste of food and prolongs the storage period of the feed. |
| Key Terms | Abbreviation |
| LSDV | Lumpy Skin Disease Virus |
| ASF | African Swine Fever |
| GPA | Growth Promoter Antibiotics |
| NSP | Non-Starch Polysaccharides |
| PUFA | Polyunsaturated Fatty Acid |
| Afs | Aflatoxins |
| AGP | Antibiotic Growth Promoters |
| FAO | The Food And Agriculture Organization of the United Nations |
| USDA | The United States Department of Agriculture |
Research Methodology
Mordor Intelligence follows a four-step methodology in all our reports.
- Step-1: IDENTIFY KEY VARIABLES: In order to build a robust forecasting methodology, the variables and factors identified in Step-1 are tested against available historical market numbers. Through an iterative process, the variables required for market forecast are set and the model is built on the basis of these variables.
- Step-2: Build a Market Model: Market-size estimations for the forecast years are in nominal terms. Inflation is not a part of the pricing, and the average selling price (ASP) is kept constant throughout the forecast period.
- Step-3: Validate and Finalize: In this important step, all market numbers, variables and analyst calls are validated through an extensive network of primary research experts from the market studied. The respondents are selected across levels and functions to generate a holistic picture of the market studied.
- Step-4: Research Outputs: Syndicated Reports, Custom Consulting Assignments, Databases & Subscription Platforms


