Market Overview
| Study Period | 2020 - 2031 |
|---|---|
| Forecast Data Period | 2026 - 2031 |
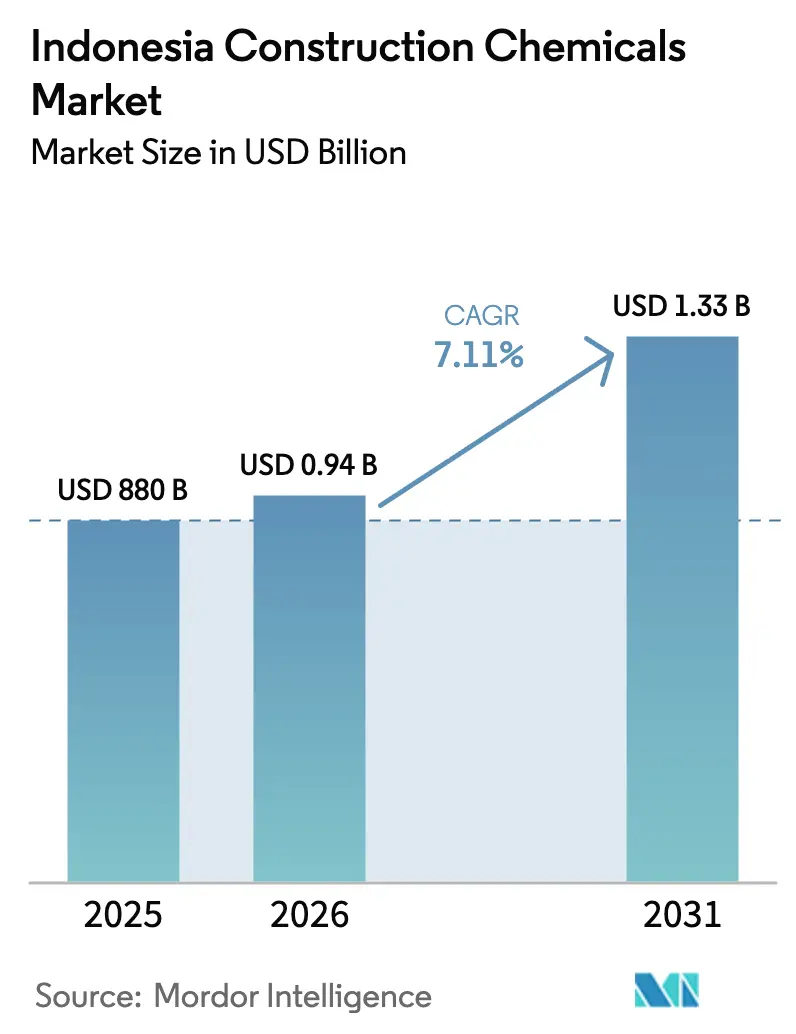
| Base Year Market Size (2025) | USD 880 Billion |
| Market Size (2026) | USD 0.94 Billion |
| Market Size (2031) | USD 1.33 Billion |
| Growth Rate (2026 - 2031) | 7.11% CAGR |
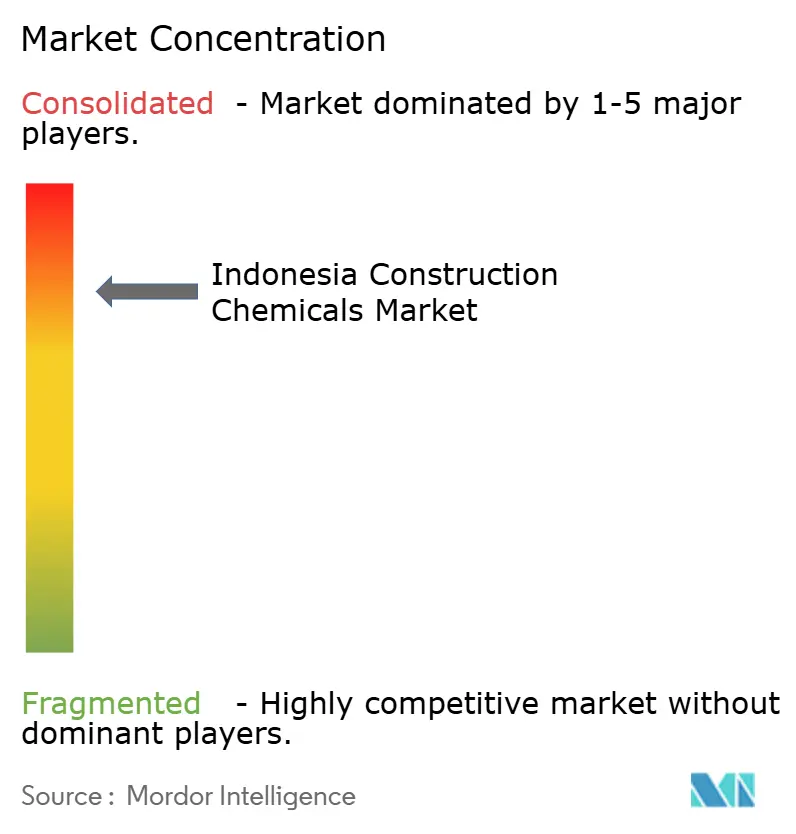
| Market Concentration | High |
Major Players *Disclaimer: Major Players sorted in no particular order Image © Mordor Intelligence. Reuse requires attribution under CC BY 4.0. | |
Indonesia Construction Chemicals Market Analysis by Mordor Intelligence
The Indonesia Construction Chemicals Market size in 2026 is estimated at USD 942.57 million, growing from 2025 value of USD 880 million with 2031 projections showing USD 1.33 billion, growing at 7.11% CAGR over 2026-2031. The upbeat trajectory mirrors ongoing infrastructure outlays, steady housing demand, and accelerating industrial activity that together widen the customer base for specialized admixtures, waterproofers, and surface enhancers. Rising public-works funding, especially for the Nusantara capital project, shortens payback periods for domestic capacity expansion, while the extension of VAT relief on sub-IDR 2 billion homes continues to lift residential starts. Private developers invest in modular building systems that need rapid-curing grouts, and industrial estates prioritize corrosion-resistant coatings that guard assets in humid coastal zones. Supply-side challenges persist, notably raw-material price swings and multi-island logistics costs, yet firms that localize production and build strong distribution partnerships lock in higher margins, positioning the Indonesia construction chemicals market for resilient mid-term growth.
Key Report Takeaways
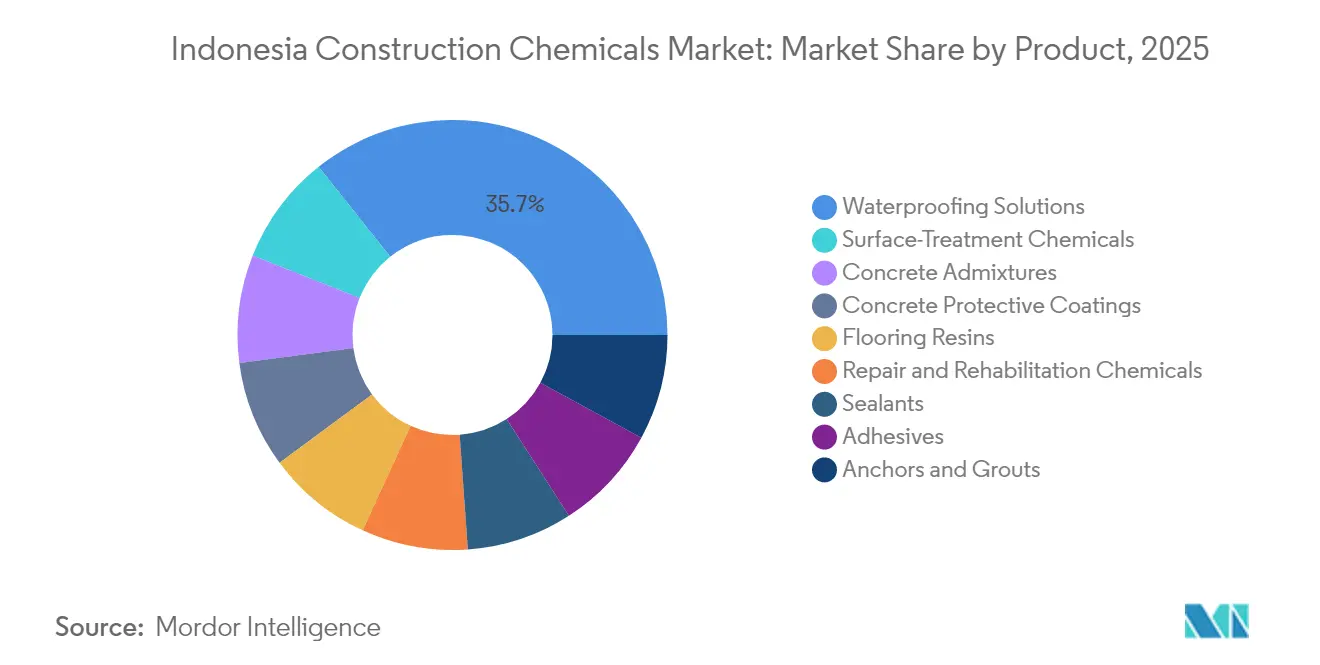
- By product category, waterproofing solutions commanded a 35.70% share of the Indonesia construction chemicals market in 2025. Surface-treatment chemicals are projected to advance at a 7.58% CAGR through 2031.
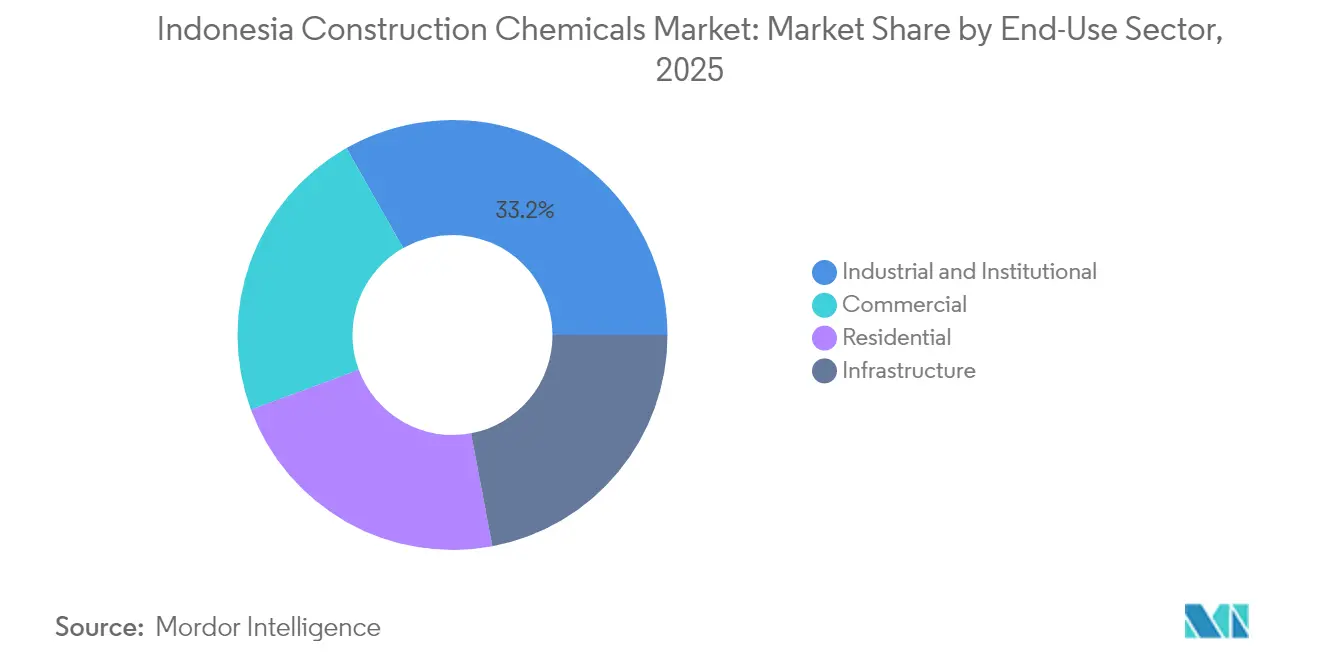
- By end-user sector, the industrial and institutional segment held 33.21% of the Indonesia construction chemicals market share in 2025. The commercial segment is projected to expand at a 7.73% CAGR to 2031.
Note: Market size and forecast figures in this report are generated using Mordor Intelligence’s proprietary estimation framework, updated with the latest available data and insights as of 2026.
Indonesia Construction Chemicals Market Trends and Insights
Drivers Impact Analysis*
| Driver | (~) % Impact on CAGR Forecast | Geographic Relevance | Impact Timeline |
|---|---|---|---|
| Robust infrastructure investment | +1.80% | Java, Sumatra, Kalimantan | Medium term (2-4 years) |
| Rapid urbanisation and commercial expansion | +1.50% | Greater Jakarta, Surabaya, Medan, Makassar | Long term (≥ 4 years) |
| High-performance admixture demand | +1.20% | National megaproject corridors | Short term (≤ 2 years) |
| Subsidised-housing programs | +0.90% | Tier-2 and Tier-3 cities | Medium term (2-4 years) |
| Modular-construction adhesive needs | +0.60% | Urban centers with prefab adoption | Long term (≥ 4 years) |
| Source: Mordor Intelligence | |||


Robust Infrastructure Investment
The 2024 public-works budget reached IDR 422.7 trillion and underpins the new Nusantara capital, toll-road build-outs, and port upgrades that collectively elevate specification levels for waterproofers, rapid-set grouts, and marine-grade coatings. The megaproject pipeline demands suppliers capable of just-in-time deliveries across remote sites, rewarding firms that co-locate blending plants near high-volume corridors on Java and Kalimantan. Higher technical standards in government tenders create premium niches that widen price bands within the Indonesia construction chemicals market.
Rising Demand for High-Performance Admixtures in Megaprojects
Projects such as the Jakarta-Bandung high-speed rail showcased super-plasticizers and accelerators that meet tight construction windows and seismic-zone durability targets. New toll roads on soft soils require low-permeability mixes with chloride resistance, driving the Indonesia construction chemicals market toward specialty admixtures with certified long-life performance.
Subsidised-Housing Programs Stimulating Residential Builds
VAT exemptions on sub-IDR 2 billion homes through 2025 and lower policy rates spurred a 60% surge in mortgage uptake during 2024. Volume-driven demand in affordable housing favors consistent, competitively priced admixtures, waterproofers, and sealants with local SNI certification, enabling capacity utilization gains for domestic producers.
Modular Construction Needs for Fast-Curing Adhesives and Grouts
Developers facing labor shortages adopt prefab panels that require grouts reaching functional strength within hours, opening white-space for epoxy-based and polyurethane systems formulated for Indonesia’s humid climate[1]Indonesian Construction Association, “Industry Trends and Construction Methods,” gapensi.or.id . Suppliers that integrate onsite technical support capture repeat business as modular penetration rises.
Restraints Impact Analysis*
| Restraint | (~) % Impact on CAGR Forecast | Geographic Relevance | Impact Timeline |
|---|---|---|---|
| Petrochemical-based raw-material price volatility | -1.40% | National, with acute impact on import-dependent regions | Short term (≤ 2 years) |
| Ongoing project delays and financing shortfalls | -1.10% | National, with higher impact in eastern Indonesia and complex infrastructure projects | Medium term (2-4 years) |
| Fragmented multi-island distribution raising logistics cost | -0.80% | Eastern Indonesia, remote islands, challenging terrain areas | Long term (≥ 4 years) |
| Source: Mordor Intelligence | |||
Petrochemical-Based Raw-Material Price Volatility
Feedstock swings of 15-25% in 2024 squeezed margins for smaller mixers lacking hedging programs, including those dependent on imported epoxy, polyurethane, and acrylic intermediates. Domestic output growth at Chandra Asri eases some shortages, yet capacity gaps in high-purity monomers keep the Indonesia construction chemicals market vulnerable to currency shifts.
Fragmented Multi-Island Distribution Raising Logistics Cost
Shipping, warehousing, and inter-island transfers consume 23.2% of GDP, with freight to Papua often doubling delivered product costs relative to Java[2]World Bank, “Indonesia Economic Prospects and Logistics Performance,” worldbank.org . The burden favors suppliers with in-house truck fleets and depots near secondary ports, dampening competition in remote districts and slowing adoption of advanced systems.
*Our forecasts treat driver/restraint impacts as directional, not additive. The impact forecasts reflect baseline growth, mix effects, and variable interactions.
Segment Analysis
By Product: Waterproofing Dominance Amid Surface-Treatment Acceleration
Waterproofing solutions held a 35.70% Indonesia construction chemicals market share in 2025, buoyed by code-mandated moisture barriers for flood-prone structures and high-humidity interiors. The segment benefits from the rapid uptake of crystalline additives in mass concrete and liquid membranes in high-rise roofs. Concrete admixtures are witnessing increased demand, with super-plasticizers gaining traction in vertical construction and silica-fume blends advancing in port upgrades, emphasizing their growing importance in the market. The Indonesia construction chemicals market size for surface-treatment chemicals is set to rise at 7.58% CAGR to 2031 as megaproject contractors lock in curing compounds that cut shrinkage and release agents that speed formwork cycles, lowering site labor.
Flooring resins enjoy traction in manufacturing plants that demand abrasion resistance, while protective coatings expand in coastal energy facilities where anti-corrosion performance is audited. Adhesives, anchors, and grouts ride the modular wave, and sealants maintain steady pull-through because silicone lines are preferred for UV stability. Collectively these categories illustrate how Indonesian buyers balance cost with lifecycle performance against monsoon rains, salt spray, and seismic load requirements.


By End-User Sector: Industrial Leadership with Commercial Momentum
Industrial and institutional projects captured 33.21% Indonesia construction chemicals market share in 2025 due to refinery debottlenecking, data-center builds, and hospital upgrades requiring chemically resistant floors and low-chloride grouts. Infrastructure schemes, notably ports and toll roads, continue to soak up high-bulk commodities such as hydration-control admixtures and polymer-modified mortars.
Looking ahead, commercial starts—from malls in tier-2 cities to new office cores near transit lines—are paced to grow at 7.73% CAGR, pushing demand for aesthetic finishes, noise-attenuating sealants, and energy-saving reflective coatings. The residential slice gains volume from the 3 Million Houses Program, yet remains price sensitive, steering suppliers toward high-output lines for entry-grade products that still clear SNI 2847 thresholds.
Geography Analysis
Java accounts for close to 59.60% of national consumption and anchors the largest cluster of blending plants, distributors, and testing labs. Greater Jakarta alone absorbs more than one-third of Indonesia construction chemicals market demand, helped by port proximity and the predominance of high-rise and mass-transit projects. Sumatra follows, leveraging port-based industrial estates and plantation processing that call for chemical-resistant floors and silane sealers.
Kalimantan steps up as the fastest-expanding region due to Nusantara’s phased build-out, coal-rail corridors, and downstream mineral processing that require robust admixtures and omniphobic coatings suitable for acidic soils. Sulawesi and Papua represent emerging frontiers where high freight costs currently limit uptake of premium systems, yet government connectivity programs promise to shrink landed prices and unlock volume. Companies that pre-stage inventories in Makassar and Sorong can bridge supply gaps and win early contractor trust.
Over the forecast horizon, regional policy incentives, including tax holidays for eastern plant construction and port modernisation grants, aim to narrow cost disparities. This realignment is expected to distribute roughly 24.60% of incremental Indonesia construction chemicals market size gains outside Java by 2031, encouraging producers to shift from single-hub logistics toward multi-node networks.
Competitive Landscape
The Indonesia construction chemicals market shows consolidated concentration. Global leaders Sika, MAPEI, and Arkema (Bostik) leverage R&D pipelines and multi-country sourcing to defend premium price tiers. Sika more than doubled capacity at its Bekasi site in 2025, installing automated lines for admixtures and acrylic waterproofers that cut batch changeovers by 25%.
Local champions PT Kimia Konstruksi Indonesia and Deltacretindo gain share through cost-competitive blends that satisfy TKDN rules and through variegated distribution that reaches second-tier cities. Chandra Asri’s upstream expansion secures styrene supply for domestic resin producers, partially insulating them from import volatility. Strategic plays center on SNI compliance audits, in-house technical service squads, and partnerships with prefab firms that specify proprietary adhesives.
Digital ordering portals launched by RPM International’s Indonesian arm illustrate a shift toward e-commerce, reducing order lead times and offering tiered pricing linked to contractor loyalty points. Emerging startups explore bio-based admixtures using palm derivatives, carving environmental niches that could grow as green-building certification gains ground.
Indonesia Construction Chemicals Industry Leaders
Arkema (Bostik)
Saint-Gobain
MAPEI S.p.A.
Ultrachem (PT. MIRANILA ABADI)
Sika AG
- *Disclaimer: Major Players sorted in no particular order

Recent Industry Developments
- February 2025: Saint-Gobain has finalized the acquisition of FOSROC, a leading global construction chemicals company with a strong geographic presence in India, the Middle East, and the Asia-Pacific region. This acquisition is expected to strengthen Saint-Gobain's position in the Indonesia construction chemicals market by enhancing its product
- August 2024: Sika announced the expansion of production capacity at its Bekasi plant, Indonesia's largest manufacturing facility. This expansion and improved distribution network position Sika to meet growing demand from infrastructure, residential, and commercial projects in the country.


Indonesia Construction Chemicals Market Report Scope
Commercial, Industrial and Institutional, Infrastructure, Residential are covered as segments by End Use Sector. Adhesives, Anchors and Grouts, Concrete Admixtures, Concrete Protective Coatings, Flooring Resins, Repair and Rehabilitation Chemicals, Sealants, Surface Treatment Chemicals, Waterproofing Solutions are covered as segments by Product.By Product
| Adhesives | Hot-Melt |
| Reactive | |
| Solvent-borne | |
| Water-borne | |
| Anchors and Grouts | Cementitious Fixing |
| Resin Fixing | |
| Concrete Admixtures | Accelerator |
| Air-Entraining | |
| Super-plasticizer | |
| Retarder | |
| Shrinkage-Reducer | |
| Viscosity-Modifier | |
| Plasticizer | |
| Other Types | |
| Concrete Protective Coatings | Acrylic |
| Alkyd | |
| Epoxy | |
| Polyurethane | |
| Other Resins | |
| Flooring Resins | Acrylic |
| Epoxy | |
| Polyaspartic | |
| Polyurethane | |
| Other Resins | |
| Repair and Rehabilitation Chemicals | Fiber-Wrapping Systems |
| Injection Grouting | |
| Micro-concrete Mortars | |
| Modified Mortars | |
| Rebar Protectors | |
| Sealants | Acrylic |
| Epoxy | |
| Polyurethane | |
| Silicone | |
| Other Resins | |
| Surface-Treatment Chemicals | Curing Compounds |
| Mold-Release Agents | |
| Other Types | |
| Waterproofing Solutions | Chemicals |
| Membranes |
By End-User Sector
| Commercial |
| Industrial and Institutional |
| Infrastructure |
| Residential |
| By Product | Adhesives | Hot-Melt |
| Reactive | ||
| Solvent-borne | ||
| Water-borne | ||
| Anchors and Grouts | Cementitious Fixing | |
| Resin Fixing | ||
| Concrete Admixtures | Accelerator | |
| Air-Entraining | ||
| Super-plasticizer | ||
| Retarder | ||
| Shrinkage-Reducer | ||
| Viscosity-Modifier | ||
| Plasticizer | ||
| Other Types | ||
| Concrete Protective Coatings | Acrylic | |
| Alkyd | ||
| Epoxy | ||
| Polyurethane | ||
| Other Resins | ||
| Flooring Resins | Acrylic | |
| Epoxy | ||
| Polyaspartic | ||
| Polyurethane | ||
| Other Resins | ||
| Repair and Rehabilitation Chemicals | Fiber-Wrapping Systems | |
| Injection Grouting | ||
| Micro-concrete Mortars | ||
| Modified Mortars | ||
| Rebar Protectors | ||
| Sealants | Acrylic | |
| Epoxy | ||
| Polyurethane | ||
| Silicone | ||
| Other Resins | ||
| Surface-Treatment Chemicals | Curing Compounds | |
| Mold-Release Agents | ||
| Other Types | ||
| Waterproofing Solutions | Chemicals | |
| Membranes | ||
| By End-User Sector | Commercial | |
| Industrial and Institutional | ||
| Infrastructure | ||
| Residential | ||


Market Definition
- END-USE SECTOR - Construction chemicals consumed in the construction sectors such as commercial, residential, industrial, institutional, and infrastructure are considered under the scope of the study.
- PRODUCT/APPLICATION - Under the scope of the study, the consumption of construction chemical products such as concrete admixtures, repair and rehabilitation chemicals, flooring resins, waterproofing solutions, anchors and grouts, adhesives and sealants, and surface treatment chemicals is considered.
| Keyword | Definition |
|---|---|
| Accelerator | Accelerators are admixtures used to fasten the setting time of concrete by increasing the initial rate and speeding up the chemical reaction between cement and the mixing water. These are used to harden and increase the strength of concrete quickly. |
| Acrylic | This synthetic resin is a derivative of acrylic acid. It forms a smooth surface and is mainly used for various indoor applications. The material can also be used for outdoor applications with a special formulation. |
| Adhesives | Adhesives are bonding agents used to join materials by gluing. Adhesives can be used in construction for many applications, such as carpet laying, ceramic tiles, countertop lamination, etc. |
| Air Entraining Admixture | Air-entraining admixtures are used to improve the performance and durability of concrete. Once added, they create uniformly distributed small air bubbles to impart enhanced properties to the fresh and hardened concrete. |
| Alkyd | Alkyds are used in solvent-based paints such as construction and automotive paints, traffic paints, flooring resins, protective coatings for concrete, etc. Alkyd resins are formed by the reaction of an oil (fatty acid), a polyunsaturated alcohol (Polyol), and a polyunsaturated acid or anhydride. |
| Anchors and Grouts | Anchors and grouts are construction chemicals that stabilize and improve the strength and durability of foundations and structures like buildings, bridges, dams, etc. |
| Cementitious Fixing | Cementitious fixing is a process in which a cement-based grout is pumped under pressure to fill forms, voids, and cracks. It can be used in several settings, including bridges, marine applications, dams, and rock anchors. |
| Commercial Construction | Commercial construction comprises new construction of warehouses, malls, shops, offices, hotels, restaurants, cinemas, theatres, etc. |
| Concrete Admixtures | Concrete admixtures comprise water reducers, air entrainers, retarders, accelerators, superplasticizers, etc., added to concrete before or during mixing to modify its properties. |
| Concrete Protective Coatings | To provide specific protection, such as anti-carbonation or chemical resistance, a film-forming protective coat can be applied on the surface. Depending on the applications, different resins like epoxy, polyurethane, and acrylic can be used for concrete protective coatings. |
| Curing Compounds | Curing compounds are used to cure the surface of concrete structures, including columns, beams, slabs, and others. These curing compounds keep the moisture inside the concrete to give maximum strength and durability. |
| Epoxy | Epoxy is known for its strong adhesive qualities, making it a versatile product in many industries. It resists heat and chemical applications, making it an ideal product for anyone needing a stronghold under pressure. It is widely used in adhesives, electrical and electronics, paints, etc. |
| Fiber Wrapping Systems | Fiber Wrapping Systems are a part of construction repair and rehabilitation chemicals. It involves the strengthening of existing structures by wrapping structural members like beams and columns with glass or carbon fiber sheets. |
| Flooring Resins | Flooring resins are synthetic materials applied to floors to enhance their appearance, increase their resistance to wear and tear or provide protection from chemicals, moisture, and stains. Depending on the desired properties and the specific application, flooring resins are available in distinct types, such as epoxy, polyurethane, and acrylic. |
| High-Range Water Reducer (Super Plasticizer) | High-range water reducers are a type of concrete admixture that provides enhanced and improved properties when added to concrete. These are also called superplasticizers and are used to decrease the water-to-cement ratio in concrete. |
| Hot Melt Adhesives | Hot-melt adhesives are thermoplastic bonding materials applied as melts that achieve a solid state and resultant strength on cooling. They are commonly used for packaging, coatings, sanitary products, and tapes. |
| Industrial and Institutional Construction | Industrial and institutional construction includes new construction of hospitals, schools, manufacturing units, energy and power plants, etc. |
| Infrastructure Construction | Infrastructure construction includes new construction of railways, roads, seaways, airports, bridges, highways, etc. |
| Injection Grouting | The process of injecting grout into open joints, cracks, voids, or honeycombs in concrete or masonry structural members is known as injection grouting. It offers several benefits, such as strengthening a structure and preventing water infiltration. |
| Liquid-Applied Waterproofing Membranes | Liquid-Applied membrane is a monolithic, fully bonded, liquid-based coating suitable for many waterproofing applications. The coating cures to form a rubber-like elastomeric waterproof membrane and may be applied over many substrates, including asphalt, bitumen, and concrete. |
| Micro-concrete Mortars | Micro-concrete mortar is made up of cement, water-based resin, additives, mineral pigments, and polymers and can be applied on both horizontal and vertical surfaces. It can be used to refurbish residential complexes, commercial spaces, etc. |
| Modified Mortars | Modified Mortars include Portland cement and sand along with latex/polymer additives. The additives increase adhesion, strength, and shock resistance while also reducing water absorption. |
| Mold Release Agents | Mold release agents are sprayed or coated on the surface of molds to prevent a substrate from bonding to a molding surface. Several types of mold release agents, including silicone, lubricant, wax, fluorocarbons, and others, are used based on the type of substrates, including metals, steel, wood, rubber, plastic, and others. |
| Polyaspartic | Polyaspartic is a subset of polyurea. Polyaspartic floor coatings are typically two-part systems that consist of a resin and a catalyst to ease the curing process. It offers high durability and can withstand harsh environments. |
| Polyurethane | Polyurethane is a plastic material that exists in various forms. It can be tailored to be either rigid or flexible and is the material of choice for a broad range of end-user applications, such as adhesives, coatings, building insulation, etc. |
| Reactive Adhesives | A reactive adhesive is made of monomers that react in the adhesive curing process and do not evaporate from the film during use. Instead, these volatile components become chemically incorporated into the adhesive. |
| Rebar Protectors | In concrete structures, rebar is one of the important components, and its deterioration due to corrosion is a major issue that affects the safety, durability, and life span of buildings and structures. For this reason, rebar protectors are used to protect against degrading effects, especially in infrastructure and industrial construction. |
| Repair and Rehabilitation Chemicals | Repair and Rehabilitation Chemicals include repair mortars, injection grouting materials, fiber wrapping systems, micro-concrete mortars, etc., used to repair and restore existing buildings and structures. |
| Residential Construction | Residential construction involves constructing new houses or spaces like condominiums, villas, and landed homes. |
| Resin Fixing | The process of using resins like epoxy and polyurethane for grouting applications is called resin fixing. Resin fixing offers several advantages, such as high compressive and tensile strength, negligible shrinkage, and greater chemical resistance compared to cementitious fixing. |
| Retarder | Retarders are admixtures used to slow down the setting time of concrete. These are usually added with a dosage rate of around 0.2% -0.6% by weight of cement. These admixtures slow down hydration or lower the rate at which water penetrates the cement particles by making concrete workable for a long time. |
| Sealants | A sealant is a viscous material that has little or no flow qualities, which causes it to remain on surfaces where they are applied. Sealants can also be thinner, enabling penetration to a certain substance through capillary action. |
| Sheet Waterproofing Membranes | Sheet membrane systems are reliable and durable thermoplastic waterproofing solutions that are used for waterproofing applications even in the most demanding below-ground structures, including those exposed to highly aggressive ground conditions and stress. |
| Shrinkage Reducing Admixture | Shrinkage-reducing admixtures are used to reduce concrete shrinkage, whether from drying or self-desiccation. |
| Silicone | Silicone is a polymer that contains silicon combined with carbon, hydrogen, oxygen, and, in some cases, other elements. It is an inert synthetic compound that comes in various forms, such as oil, rubber, and resin. Due to its heat-resistant properties, it finds applications in sealants, adhesives, lubricants, etc. |
| Solvent-borne Adhesives | Solvent-borne adhesives are mixtures of solvents and thermoplastic or slightly cross-linked polymers such as polychloroprene, polyurethane, acrylic, silicone, and natural and synthetic rubbers. |
| Surface Treatment Chemicals | Surface treatment chemicals are chemicals used to treat concrete surfaces, including roofs, vertical surfaces, and others. They act as curing compounds, demolding agents, rust removers, and others. They are cost-effective and can be used on roadways, pavements, parking lots, and others. |
| Viscosity Modifier | Viscosity Modifiers are concrete admixtures used to change various properties of admixtures, including viscosity, workability, cohesiveness, and others. These are usually added with a dosage of around 0.01% to 0.1% by weight of cement. |
| Water Reducer | Water reducers, also called plasticizers, are a type of admixture used to decrease the water-to-cement ratio in the concrete, thereby increasing the durability and strength of concrete. Various water reducers include refined lignosulfonates, gluconates, hydroxycarboxylic acids, sugar acids, and others. |
| Water-borne Adhesives | Water-borne adhesives use water as a carrier or diluting medium to disperse resin. They are set by allowing the water to evaporate or be absorbed by the substrate. These adhesives are compounded with water as a dilutant rather than a volatile organic solvent. |
| Waterproofing Chemicals | Waterproofing chemicals are designed to protect a surface from the perils of leakage. A waterproofing chemical is a protective coating or primer applied to a structure's roof, retaining walls, or basement. |
| Waterproofing Membranes | Waterproofing membranes are liquid-applied or self-adhering layers of water-tight materials that prevent water from penetrating or damaging a structure when applied to roofs, walls, foundations, basements, bathrooms, and other areas exposed to moisture or water. |


Research Methodology
Mordor Intelligence follows a four-step methodology in all our reports.
- Step-1: Identify Key Variables: The quantifiable key variables (industry and extraneous) pertaining to the specific product segment and country are selected from a group of relevant variables & factors based on desk research & literature review; along with primary expert inputs. These variables are further confirmed through regression modeling (wherever required).
- Step-2: Build a Market Model: In order to build a robust forecasting methodology, the variables and factors identified in Step-1 are tested against available historical market numbers. Through an iterative process, the variables required for market forecast are set and the model is built on the basis of these variables.
- Step-3: Validate and Finalize: In this important step, all market numbers, variables and analyst calls are validated through an extensive network of primary research experts from the market studied. The respondents are selected across levels and functions to generate a holistic picture of the market studied.
- Step-4: Research Outputs: Syndicated Reports, Custom Consulting Assignments, Databases & Subscription Platforms


