
Market Overview
| Study Period | 2021 - 2031 |
|---|---|
| Forecast Data Period | 2026 - 2031 |
| Historical Data Period | 2021 - 2024 |
| Market Volume (2026) | 331.67 gigawatt |
| Market Volume (2031) | 355.75 gigawatt |
| Growth Rate (2026 - 2031) | 1.41 % |
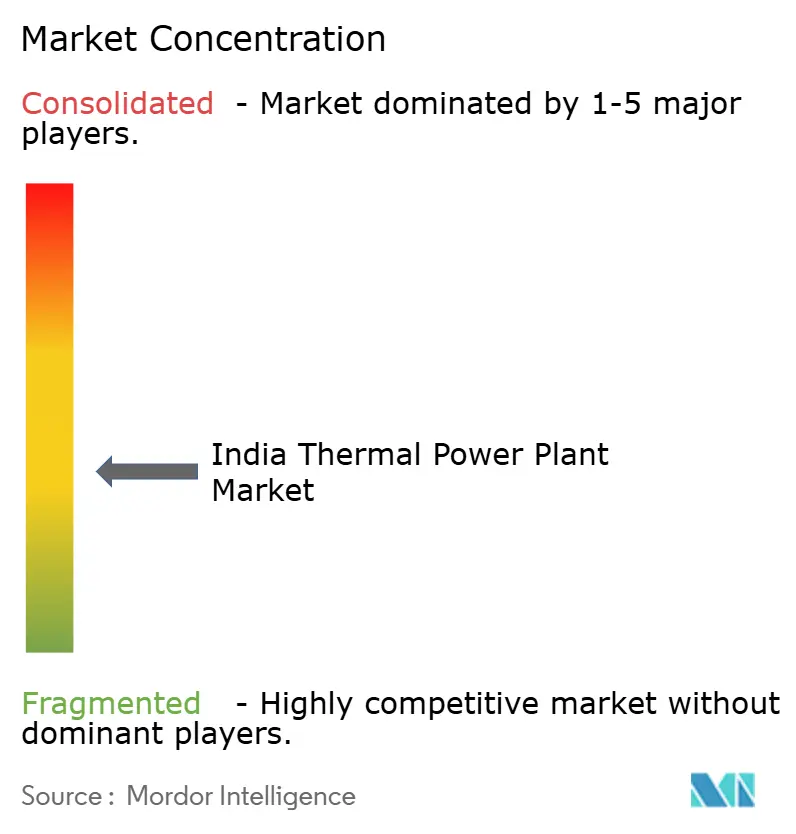
| Market Concentration | Medium |
Major Players *Disclaimer: Major Players sorted in no particular order Image © Mordor Intelligence. Reuse requires attribution under CC BY 4.0. | |
India Thermal Power Plant Market Analysis by Mordor Intelligence
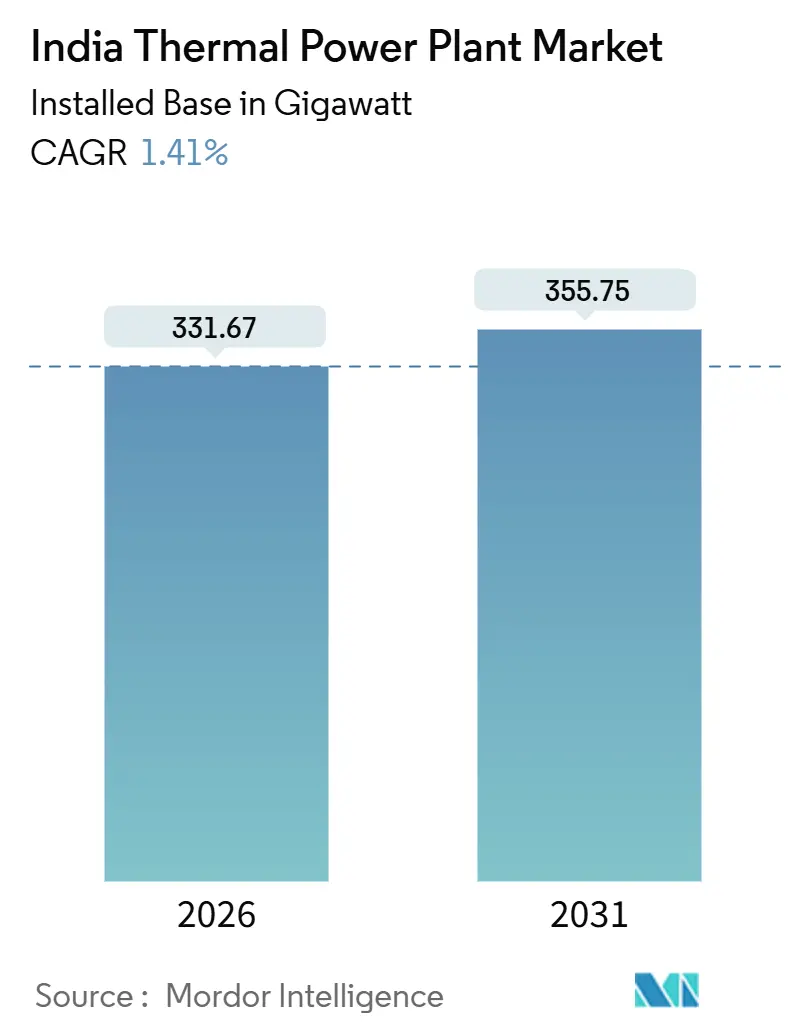
The India Thermal Power Plant Market size in terms of installed base is expected to grow from 331.67 gigawatt in 2026 to 355.75 gigawatt by 2031, at a CAGR of 1.41% during the forecast period (2026-2031).
Viewed beneath the headline figures, the India thermal power plant market is quietly realigning around flexibility, efficiency, and fuel security. Coal-fired units remain the backbone because domestic reserves keep delivering energy costs low, yet natural-gas and hybrid configurations are attracting capital where rapid ramping and black-start capability carry a premium. Developers are also threading supercritical retrofits into existing stations to reclaim lost heat and squeeze more electricity from every tonne of coal, while industrial consumers lock in round-the-clock power through captive combined-heat-and-power (CHP) projects. Meanwhile, the India thermal power plant market must juggle the twin pressures of a swelling 500 GW renewable pipeline and tougher environmental rules that threaten to strand subcritical assets. Equipment vendors are responding with divergent portfolios: BHEL books steady coal-boiler orders, whereas Siemens and GE Power India pitch aeroderivative turbines to data-center operators chasing ten-minute start times.
Key Report Takeaways
- By fuel type, coal held 87.2% of India's thermal power plant market share in 2025, while natural-gas units are poised to grow at a 6.1% CAGR through 2031.
- By technology, steam-cycle plants controlled 84.9% of capacity in 2025; CHP installations are projected to expand at a 6.6% CAGR during 2026-2031.
- By combustion method, pulverized-fuel designs accounted for 73.3% share of the India thermal power plant market size in 2025, whereas turbine-based facilities are advancing at a 6.9% CAGR through 2031.
- By application, utility-scale stations commanded 75.5% capacity in 2025, and peaker plants are forecast to record the fastest growth at a 9.0% CAGR to 2031.
- NTPC, Adani Power, and Tata Power jointly controlled roughly 45% of installed capacity in 2025, underscoring a moderately concentrated competitive landscape.
Note: Market size and forecast figures in this report are generated using Mordor Intelligence’s proprietary estimation framework, updated with the latest available data and insights as of January 2026.
India Thermal Power Plant Market Trends and Insights
Drivers Impact Analysis*
| Driver | (~) % Impact on CAGR Forecast | Geographic Relevance | Impact Timeline |
|---|---|---|---|
| Rising peak-load demand from AC & data-center boom | +0.4% | Mumbai, Bengaluru, Hyderabad, Chennai metros | Short term (≤ 2 years) |
| 80 GW coal-capacity expansion mandate to 2032 | +0.3% | Chhattisgarh, Odisha, Jharkhand coal belts | Long term (≥ 4 years) |
| Domestic coal output nearing 1 Bt improving fuel security | +0.2% | Eastern coalfields nationwide | Medium term (2-4 years) |
| Super/ultra-supercritical retrofits boosting efficiency | +0.2% | Flagship plants of NTPC & Adani Power | Medium term (2-4 years) |
| Captive RTC industrial PPAs for flexible thermal supply | +0.2% | Gujarat, Maharashtra, Karnataka corridors | Medium term (2-4 years) |
| Data-center driven fast-ramping gas-turbine demand | +0.3% | Tier-1 and emerging Tier-2 cities | Short term (≤ 2 years) |
| Source: Mordor Intelligence | |||
Rising Peak-Load Demand From AC & Data-Center Boom
Peak electricity demand climbed to 250 GW in summer 2025 and is expected to cross 270 GW by 2027, with air-conditioning loads and hyperscale data centers supplying most of the incremental draw.[1]Central Electricity Authority, “Monthly Generation Reports FY24,” cea.nic.in Data-center capacity is projected to swell from 1.4 GW in 2024 to 9 GW by 2030 as sovereign data rules compel cloud providers to localize compute clusters. AI training workloads require 99.999% uptime, and batteries alone remain too costly to guarantee sub-15-minute failover at the gigawatt scale. Aeroderivative gas turbines can reach full output in under 10 minutes, making thermal peakers the default insurance policy for campus-style data hubs.[2]Siemens India, “SGT-800 Installation in Hyderabad,” siemens.com The pull from digital infrastructure is therefore steering fresh capacity toward flexible combined-cycle units that traditional pulverized-fuel boilers cannot emulate without costly retrofits. This trend ensures the India thermal power plant market keeps a foot firmly in both baseload and fast-ramp camps.
80 GW Coal-Capacity Expansion Mandate to 2032
The Ministry of Power’s call for 80 GW of new coal capacity by 2032 balances grid-stability priorities against the rapid arrival of intermittent renewables.[3]Ministry of Power, “National Electricity Plan Draft 2024,” powermin.gov.in NTPC has already broken ground on multiple supercritical projects, including the 1,600 MW Lara plant in Chhattisgarh slated for full completion by 2027. Supercritical units deliver 38-40% efficiency versus 32-35% for legacy subcritical fleets, yielding 15-20% fuel savings per megawatt-hour. Policymakers also view the mandate as a sink for expanding domestic coal production that aims to eclipse 1 billion tonnes, thereby paring exposure to volatile Indonesian imports. While the bulk of additions front-load before 2029, the directive keeps engineering, procurement, and construction (EPC) pipelines healthy and underpins the India thermal power plant market during a volatile energy transition.
Super/Ultra-Supercritical Retrofits Boosting Efficiency
Ultra-supercritical steam cycles operate above 22.1 MPa and 600 °C, lifting net efficiency to the 38-45% band and trimming coal use by up to 18% per kilowatt-hour generated. NTPC’s Lara unit targets 42% efficiency, and Tata Power’s Trombay retrofit slashed specific coal consumption from 0.72 kg/kWh to 0.61 kg/kWh after commissioning in 2024. The gains matter because Indian coal averages only 3,500-4,000 kcal/kg, forcing generators to burn more volume than international peers. Yet implementation costs are steep, adding 25-30% to boiler bills and limiting scope to post-2010 builds that possess adequate structural headroom. Even so, retrofit economics resonate wherever fuel security, emission compliance, and grid efficiency converge, cementing an upgrade cycle that steadily reshapes the India thermal power plant market.
Captive RTC Industrial PPAs for Flexible Thermal Supply
Energy-intensive industries are signing round-the-clock power-purchase agreements to shield production lines from renewable curtailment and transmission congestion. JSW Energy leads the trend, backing 3.8 GW of thermal capacity tied to steel and cement plants through 15-20-year contracts that blend baseload and peaking services. Under captive-plus-surplus models, electricity and process steam flow to onsite mills, while excess units clear on the merchant market, creating diversified revenue stacks. Flexible CHP assets reach 70-80% overall efficiency and qualify for accelerated depreciation, reinforcing their pull among balance-sheet-conscious corporates. The arrangement keeps industrial buyers insulated from grid volatility and sustains a distributed backbone within the India thermal power plant market.
Restraints Impact Analysis*
| Restraint | (~) % Impact on CAGR Forecast | Geographic Relevance | Impact Timeline |
|---|---|---|---|
| 500 GW RE pipeline eroding thermal PLFs | -0.5% | National, most acute in Tamil Nadu, Karnataka, Rajasthan, Gujarat with high solar penetration | Medium term (2-4 years) |
| Costly FGD/De-NOx retrofit compliance | -0.3% | National, concentrated in non-compliant plants in Uttar Pradesh, Madhya Pradesh, Gujarat, Chhattisgarh | Short term (≤ 2 years) |
| Shrinking fly-ash demand from green-cement shift | -0.1% | National, with spillover effects in coal-belt states (Chhattisgarh, Odisha, Jharkhand) where disposal infrastructure is limited | Long term (≥ 4 years) |
| Post-2028 LNG contract cliff for gas plants | -0.2% | Regional, primarily affecting Gujarat, Maharashtra, Andhra Pradesh, Tamil Nadu with gas-pipeline infrastructure | Medium term (2-4 years) |
| Source: Mordor Intelligence | |||
500 GW RE Pipeline Eroding Thermal PLFs
Renewable capacity hit 203 GW in 2025, and another 297 GW is under development to meet the 500 GW target by 2030. Must-run priority pushes solar and wind to the front of the dispatch queue, dragging thermal plant load factors down to 53.8% in FY24 and even lower in solar-rich Tamil Nadu, where PLFs slumped to 48%. Merchant generators without long-term PPAs face acute revenue stress; Reliance Power’s fleet averaged only 42% PLF in FY24 and entered debt negotiations with banks. Two-shifting coal units accelerate boiler wear, lifting maintenance expenses by 20-30% and trimming residual life. The Central Electricity Authority expects PLFs to stabilize near 55-58% by 2030 only if battery storage scales to at least 40 GWh, a scenario still short of financial closure. Until then, renewable crowd-out remains the most potent drag on the India thermal power plant market.
Costly FGD/De-NOx Retrofit Compliance
Retrofitting flue-gas desulfurization and selective catalytic reduction systems costs INR 0.8-1.2 crore per MW, translating to INR 2.6 lakh crore for the entire fleet.[4]Ministry of Environment, Forest and Climate Change, “Revised Emission Norms 2024,” moef.gov.in In 2024, 78% of capacity received temporary exemptions, which leaves only 8% fully compliant and creates a looming cliff if enforcement tightens after 2028. NTPC has upgraded 6.8 GW but reports a 1-1.5% rise in auxiliary consumption and an INR 0.30-0.40 per kWh cost uptick after FGD installation. Plants burning high-sulfur coal in Uttar Pradesh and Madhya Pradesh breach the 200 mg/Nm³ SO₂ norm by factors of two to three, placing them at the highest compliance risk. If mandates crystallize, stranded-asset write-offs could follow, squeezing the India thermal power plant market’s profitability during the transition window.
*Our forecasts treat driver/restraint impacts as directional, not additive. The impact forecasts reflect baseline growth, mix effects, and variable interactions.
Segment Analysis
By Fuel Type: Coal Remains Anchor While Gas Monetizes Flexibility
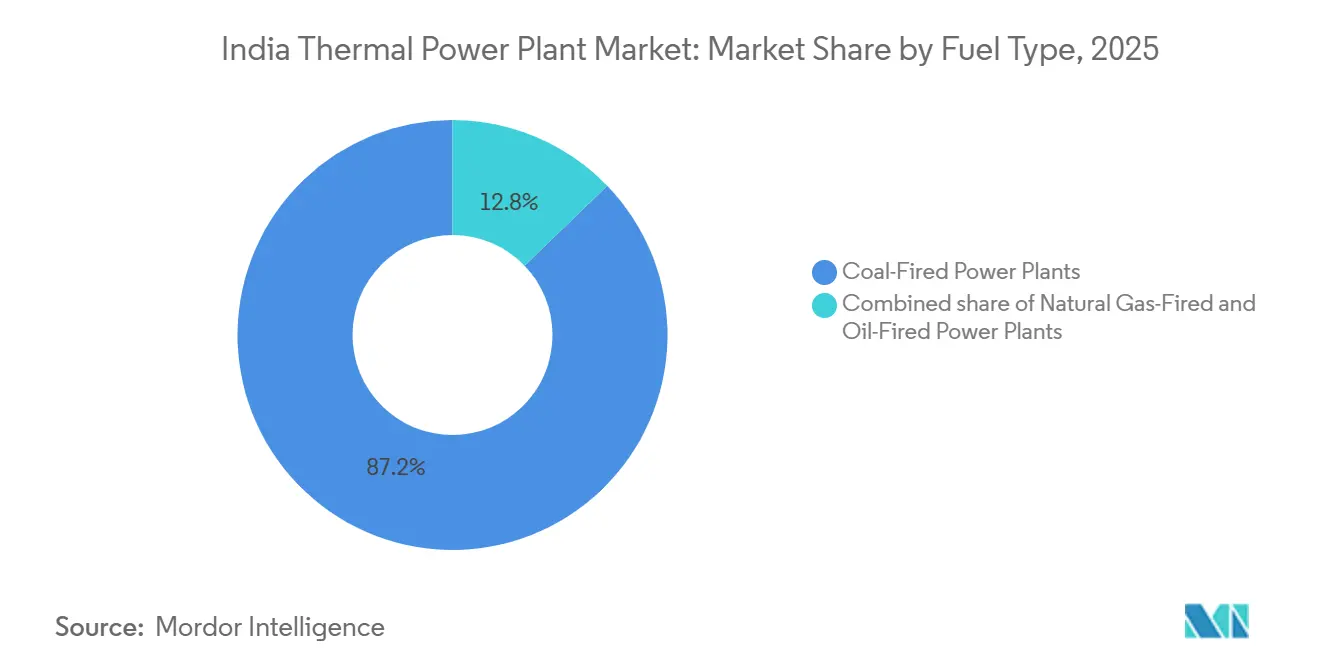
Coal held 87.2% of capacity in 2025 because domestic reserves support delivered tariffs of INR 2.5-3.0 per kWh. Natural-gas plants are nevertheless pacing forward at a 6.1% CAGR through 2031, rewarded by their ability to ramp 50-100 MW per minute when the grid swings. Adani Total Gas inaugurated a 150 MW combined-cycle block in Gujarat during 2025 that sells both electricity and 300 t/h of process steam to nearby factories, illustrating how CHP economics blunt the sting of USD 12-15 per MMBtu LNG. The India thermal power plant market size for gas assets is expected to widen as peaker roles multiply, although absolute coal capacity still rises 25-30 GW to underpin baseload demand. The India thermal power plant market continues to price in the post-2028 LNG contract cliff, nudging developers toward dual-fuel turbines and shorter payback horizons.
Second-order impacts flow through fuel-supply ecosystems. Domestic production satisfies only half of the gas demand, leaving volatility to spill into merchant tariffs whenever Japan-Korea Marker spot prices spike. Conversely, Coal India’s 1 billion-tonne roadmap enhances the India thermal power plant market’s long-term coal security, even if rail and washery bottlenecks persist. Investors, therefore, balance coal’s cost certainty against gas’s revenue upside from capacity markets. In practice, both fuels coexist: coal anchors base generation, while gas monetizes flexibility premiums that a renewable-heavy grid increasingly pays for in the India thermal power plant market.



By Technology: Steam Dominance Meets an Expanding CHP Niche
Steam-cycle stations captured 84.9% capacity in 2025 because their robust design tolerates high-ash coal and delivers proven availability above 85%. NTPC alone operates 50 GW of such units, standardized around 210-800 MW blocks that simplify spares and maintenance logistics. Yet CHP systems, though barely 4% of current capacity, are cruising at a 6.6% CAGR to 2031 as industrial clusters seek 70-80% overall efficiency from waste-heat recovery. JSW Steel’s 1,200 MW captive CHP station in Karnataka trims grid purchases by 40% and sells surplus steam to a neighboring cement mill, a template replicating across steel and refinery hubs.
The India thermal power plant market size allocated to CHP could double by 2031 if policy perks such as accelerated depreciation persist. However, deployment depends on geographical co-location with heat sinks, confining growth to manufacturing corridors. Steam dominance therefore endures, but CHP offers a profitable adjunct where industrial heat demand and grid congestion intersect. Both streams interact synergistically: CHP offloads baseload from utility plants, allowing larger stations to pivot toward flexible operation in the evolving India thermal power plant market.
By Combustion Method: Pulverized Fuel Retains Majority as Turbines Scale
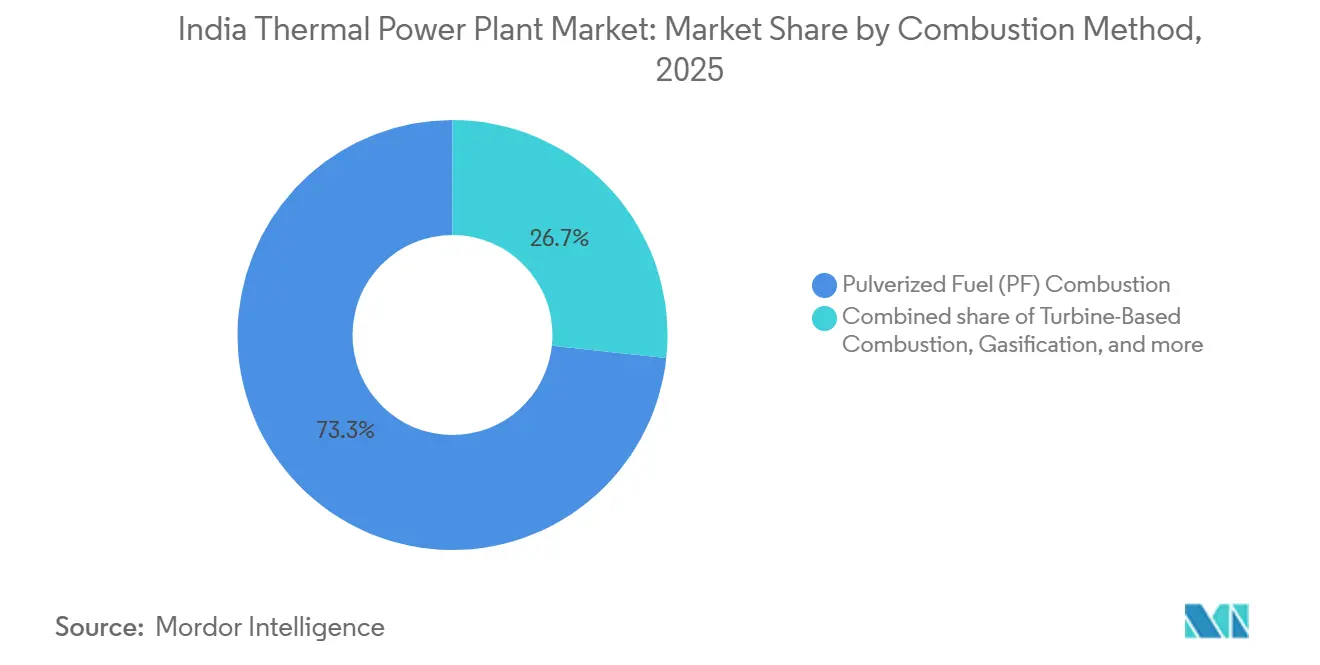
Pulverized-fuel boilers supplied 73.3% of capacity in 2025, their tolerance for 30-45% ash coal sustaining position despite falling load factors. Gas turbines and combined-cycle units, grouped under turbine-based combustion, are expanding at a 6.9% CAGR through 2031 because spinning-reserve markets reward 50-100 MW per-minute ramp rates. Circulating fluidized beds occupy an 8-10% share, favored for inferior coal grades prevalent in Uttar Pradesh and Rajasthan, and provide biomass co-firing flexibility that helps meet renewable-purchase obligations.
In the India thermal power plant market, turbines shine in peaker roles: Tata Power’s 250 MW open-cycle block in Gujarat reaches full power in ten minutes, stabilizing the state’s 12 GW solar fleet. Gasification remains nascent due to 40-50% higher capex, though policy pilots may yet surface in coal-rich but water-scarce belts. Overall, pulverized fuel keeps the majority stake, but turbines escalate their strategic relevance as renewable swings widen, ensuring a diversified combustion portfolio across the India thermal power plant market.
By Application: Utility-Scale Base Meets Accelerating Peaker Growth
Utility-scale projects dominated 75.5% capacity in 2025, centered on NTPC’s 73 GW fleet and state generators that anchor long-term PPAs priced at INR 3.5-4.5 per kWh. Peaker plants, only 4-5% today, are on track for a 9.0% CAGR to 2031 as grid operators pay INR 10-12 per kW-month for ten-minute start guarantees. Industrial captive units, at 15-16% share, hedge factories against grid brownouts and tariff volatility, while distributed thermal blocks under 50 MW supply industrial parks beyond transmission corridors.
Capacity payments rather than energy sales propel peaker economics. Adani Power’s 400 MW Haryana plant, fired on naphtha, dispatched only 240 hours in 2025 yet earned stable revenue through availability contracts. Captive projects are bifurcating: mega steelmakers retrofit supercritical units that export surplus, whereas small manufacturers install diesel engines as emergency backup. Distributed assets face cost pressure from rooftop solar plus batteries, but remain viable for 24/7 chemical and textile lines. Together, the mosaic sustains a layered demand profile in the India thermal power plant market, where each application stakes out a distinct risk-return niche.
Geography Analysis
NTPC, Adani Power, and state utilities cluster coal megaprojects in Chhattisgarh, Odisha, and Jharkhand because these regions sit atop the largest proven reserves, hold railway linkages, and face fewer land-acquisition bottlenecks. In 2025, the eastern belt accounted for just over 40% of national thermal capacity, a share that inches higher as new supercritical units such as Lara and Talcher-III synchronize from 2026 onward. Gujarat and Maharashtra rank next, thanks to deep-draft ports that streamline coal imports when domestic supply falters.
Southern states hinge on hybrid portfolios. Tamil Nadu’s thermal fleet slipped to a 48% load factor in FY24 after its 18 GW renewable base flooded daytime supply. Karnataka follows a similar curve, prompting state load-dispatch centers to place seasonal capacity bids for peaker gas blocks stationed near Bengaluru’s technology corridor. Andhra Pradesh, endowed with LNG regas terminals at Kakinada and Krishnapatnam, sustains India's thermal power plant market growth for combined-cycle assets co-located with fertilizer and petrochemical clusters. Despite variations, every region leans on flexible thermal reserve to soften renewable intermittency.
In the north, Uttar Pradesh and Madhya Pradesh confront high-sulfur coal issues and lag on FGD compliance, making them focal points for future retrofit mandates. Rajasthan uses a mixed approach: lignite-rich Barmer district underpins subcritical units, while high-irradiance zones feed the country’s largest solar parks. The national transmission grid, now threaded by the Green Energy Corridor, ferries surplus solar from western deserts to the north-east evening peaks, yet still counts on quick-start thermal nodes to maintain frequency. Consequently, the India thermal power plant market displays pronounced regional asymmetries but remains nationally interdependent.
Regulatory Landscape
India's thermal generation economics are shaped by Central Electricity Regulatory Commission tariff frameworks. The CERC (Terms and Conditions of Tariff) Regulations, 2024 (effective April 1, 2024 through March 31, 2029) retains the two-part tariff structure (capacity charge and energy charge), which influences dispatch, availability incentives, and cost pass-through for fuel and O&M. Planning and project appraisal are anchored in Central Electricity Authority processes, and FY2025-26 reporting (up to November 30, 2025) indicated 7.21 GW of capacity commissioned and 13.32 GW awarded, underscoring continued central and state procurement for new thermal builds.
On fuel security and compliance, the Cabinet Committee on Economic Affairs approved the revised SHAKTI policy in May 2025 to streamline domestic coal linkage and allocation mechanisms, supporting new and replacement capacity while reducing import exposure. Environmental compliance is tightening around MoEF&CC emission norms and the mandate for 100% ash utilization, with plant categorization used to map implementation timelines. At the same time, the high retrofit burden for FGD and De-NOx remains a key regulatory cost driver for the installed fleet.
Competitive Landscape
The India thermal power plant market operates under moderate concentration. NTPC commands 73 GW, Adani Power 16 GW, and Tata Power nearly 14 GW, bringing their combined hold to about 45% of installed capacity in 2025. NTPC spearheads an efficiency push by integrating 200 MW of solar at its Lara ultra-supercritical complex, reducing coal burn during daylight hours. Adani Power pursues vertical integration through captive mines that supply plants such as Godda, sheltering margins from import volatility. Tata Power leverages retrofit expertise, making Trombay Unit 9 India’s most efficient sub-1 GW coal station after a 2024 upgrade.
Equipment suppliers mirror this two-track strategy. BHEL’s INR 1.35 lakh crore order backlog underscores resilient demand for domestic coal boilers, though Chinese EPC bidders, discounted by up to 20%, keep margins thin. Siemens and GE Power India pivot to aeroderivative turbines that cater to data-center campuses; their turnkey packages bundle black-start, microgrid software, and fifteen-year service agreements, carving out a premium niche. JSW Energy, meanwhile, bought 1,040 MW of distressed capacity in Odisha at a 35% discount, betting on post-retrofit PPAs and ancillary-service revenue to lift returns.
Regulatory compliance splits the field. NTPC and Tata Power secure higher-tariff contracts by pre-installing FGD kits, whereas non-compliant fleets face downward pressure on capacity utilization. Merchant players with debt-laden balance sheets are prime candidates for consolidation, an avenue private infrastructure funds increasingly explore. Over time, expertise in flexible operation, fuel integration, and emissions management will prove more determinative than raw capacity, shaping competitive dynamics throughout the India thermal power plant market.
India Thermal Power Plant Industry Leaders
NTPC Limited
Adani Power Limited
Tata Power Company Ltd
Maharashtra State Power Generation Co. Ltd
Reliance Power Limited
- *Disclaimer: Major Players sorted in no particular order

Market Opportunities and Future Outlook
The near-term whitespace is concentrated in new-build and replacement capacity progressing through the government planning pipeline, with flexibility additions targeted for peak management. Official planning documents reference a 97,000 MW coal and lignite capacity addition program by 2034-35, and as of January 2026, 38,745 MW of thermal capacity was under construction, with a further 22,920 MW awarded and awaiting construction. This intake continues to support demand for EPC, boilers, turbines, and balance-of-plant across coal-belt states and key load centers.
A second opportunity band is shifting contracting toward higher-efficiency designs and availability-backed thermal supply. This shows up in ultra-supercritical project development and long-tenor procurement, including Adani Power's 25-year power supply agreement (September 2025) for a 2,400 MW greenfield plant in Bihar and the Terms of Reference secured for JSW Thermal Energy Limited's proposed 2x800 MW ultra-supercritical Salboni project in West Bengal. In the public sector, NTPC's board approval in July 2026 for the 1,600 MW Lara Stage-III investment supports the role of large central utilities in bringing additional capacity into execution, alongside revised SHAKTI coal-linkage rules (May 2025) that reduce one of the main bottlenecks for firming and baseload thermal operations.
Recent Industry Developments
- July 2026: NTPC Limited's board approved an investment of INR 20,456.70 crore for the 1,600 MW Lara Super Thermal Power Project Stage-III in Chhattisgarh. The decision advances a large supercritical addition within NTPC's pipeline and reinforces its commitment to high-efficiency coal capacity where fuel linkage and grid reliability needs align.
- July 2026: Adani Power Limited signed a 25-year power supply agreement with Maharashtra State Electricity Distribution Company Ltd to supply 1,600 MW from a new ultra-supercritical thermal plant under the DBFOO model. The long-tenor structure supports bankability for greenfield capacity and reflects state discom procurement for firm power alongside renewables.
- December 2025: NLC India Limited called for global EPC bids for the second expansion of its Thermal Power Station-II in Neyveli, Tamil Nadu, covering a 2x500 MW coal-based project. The tender expands the near-term EPC addressable market and points to continued state-linked coal capacity development in a high-demand southern grid.


Research Methodology Framework and Report Scope
Market Definition and Coverage
For this study, the India thermal power plant market is defined as the country level installed base of thermal generation capacity that is operational or available for dispatch, expressed in gigawatts and tied to the physical plant fleet.
Scope exclusions: We exclude upstream fuel mining, transmission and distribution assets, and annual generation output measured in kWh because the metric here is installed capacity.
Segmentation Overview
- By Fuel Type
- Coal-Fired Power Plants
- Natural Gas-Fired Power Plants
- Oil-Fired Power Plants
- By Technology
- Steam Cycle-Based
- Gas Turbine/Combined Cycle
- Combined Heat and Power (CHP)
- By Combustion Method
- Pulverized Fuel (PF) Combustion
- Fluidized Bed Combustion
- Gasification
- Internal Combustion Engines
- Turbine-Based Combustion
- By Application
- Utility-Scale Thermal Plants
- Industrial Captive Power Plants
- Distributed Thermal Plants
- Peaker Plants
Data Sources, Market Sizing, and Validation
Desk Research
Desk work starts with building a clean view of the thermal fleet and how it changes through retirements, new commissioning, and long term outage status. We use public statistics and policy documents to anchor the numbers, such as Central Electricity Authority (CEA) capacity publications, Ministry of Power updates, national accounts and energy tables published by official statistical bodies, and IEA energy balances where India series are available.
To make the installed base consistent, we also review regulatory and grid planning material such as CERC orders, state discom filings where capacity is referenced, and project level announcements in reputed press. Company annual reports and investor presentations help confirm unit status, nameplate capacity, and expected commissioning dates, and a paid subscription for company financials, news screening, and import and export shipments is used selectively to validate timelines and disclosures. The sources listed here are illustrative rather than exhaustive, and additional public documents were also reviewed for data collection, cross checks, and clarification.
Primary Interviews and Surveys
Primary work is used to validate what is operational versus only announced, and to pressure test assumptions that desk sources do not make explicit (for example, expected slippage in commissioning schedules and the practical impact of compliance driven retrofits). We speak with plant operators, EPC and O&M participants, regulators, and sector consultants across major thermal states so that the installed base model reflects real plant availability and near term pipeline realism.
Distribution of primary research fieldwork respondents
| Company type | Respondent position |
|---|---|
| Top tier: 34% | CXOs: 14% |
| Mid tier: 50% | Functional/Unit leaders: 35% |
| Smaller Players: 16% | Managers: 51% |
Market-Sizing & Forecasting
Sizing is built around the top-down reconstruction of the installed thermal fleet, where official capacity series and unit status disclosures are used to form the opening installed base and then adjusted by confirmed additions and retirements. To keep the totals practical, we corroborate the outcome with selective bottom-up checks, such as sampling unit level capacity by major operators and matching commissioning pipelines against public project announcements and equipment delivery signals.
Key inputs used in the model include installed capacity by thermal category, commissioning and retirement schedules, prolonged outage and derating flags, emission compliance milestones that influence unit continuation, and dispatch trends that indicate whether units remain active. When gaps exist (for example, unclear COD shifts for a specific unit), we apply conservative timing rules and then recheck them through interviews before finalizing.
Forecasting is done using scenario analysis supported by time series smoothing on additions and retirements, and then refined using expert consensus on schedule slippages and policy enforcement. The result is a traceable capacity path that can be recreated by a junior analyst using the same public datasets and targeted calls.
Data Validation & Update Cycle
Outputs are validated through multiple checks, where the modeled installed base is compared against independent capacity tables, unit wise status lists, and observed commissioning patterns. Any sharp step changes are flagged, and then the underlying plant list is reviewed to confirm whether a shutdown, derating, or delayed COD caused the variance.
We run internal review steps before sign-off, and we re-contact sources if a key assumption does not align across datasets. Reports are refreshed annually, with interim updates when a material commissioning wave, regulation change, or large retirement announcement shifts the near term view. Before delivery, a final pass is completed so clients receive the most current numbers available at that time.
Mordor Intelligence's India Thermal Power Plant Market Size Compared With Other Published Estimates
Published market sizes for India thermal power plants often differ because authors do not always measure the same output, and the update timing can also shift results when units are commissioned or retired near fiscal year-end. Some figures are presented as investment value or EPC opportunity, while others refer to installed capacity, which naturally leads to a wide spread.
A refresh led gap shows up when capacity additions are captured using different cutoffs (calendar year versus fiscal year) and when older plant lists are not cleaned for retirements, deratings, or prolonged outages. Exchange rate timing can further distort any USD conversion for capex style estimates, and some publications rely on broad average cost per MW without separating new build spending from renovation and compliance spend.
Benchmark comparison
| Source | Market Size | Gaps in Research Methodology |
|---|---|---|
| Mordor Intelligence | USD 331.67 B (2026) | |
| Industry Publisher A | USD 53.27 B (2026) | This figure appears to represent revenue or investment value tied to projects, so it will move with assumed cost per MW and exchange rate timing, and it does not reflect the cumulative installed capacity stock. |
| Financial Daily B | USD 27.60 B (2028) | This estimate is disclosed as an investment pool over a future multi year window, so it captures spending flow rather than the installed base in GW, and the number depends on the rupee to dollar conversion date used. |
The spread in the table is mainly explained by mixing a capacity stock metric with spending flow metrics, followed by different year cutoffs and currency conversion timing. By refreshing the unit status list close to publication and validating COD and retirement timing against official capacity releases and interview checks, a cleaner installed base total is reached, which is the approach applied by Mordor Intelligence.


Key Questions Answered in the Report
What is the projected capacity of the India thermal power plant market by 2031?
Installed capacity is forecast to reach 355.75 GW by 2031, reflecting a 1.41% CAGR from 2026.
Which fuel type dominates thermal generation in India?
Coal accounts for 87.2% of capacity in 2025 and remains the principal baseload source through 2031.
Why are peaker plants growing faster than other applications?
Grid operators pay capacity charges for ten-minute start capability, driving a 9.0% CAGR for peaker units.
How will emission-control mandates affect plant economics?
FGD and De-NOx retrofits can raise levelized costs by INR 0.30-0.40 per kWh, pressuring non-compliant assets.
Which companies lead the India thermal power plant market?
NTPC, Adani Power, and Tata Power together hold about 45% of national capacity.
What role does domestic coal production play?
Expanding to 1 billion tonnes by 2027, local coal improves fuel security and underpins new supercritical projects.
Page last updated on:




