
Market Overview
| Study Period | 2021 - 2031 |
|---|---|
| Forecast Data Period | 2026 - 2031 |
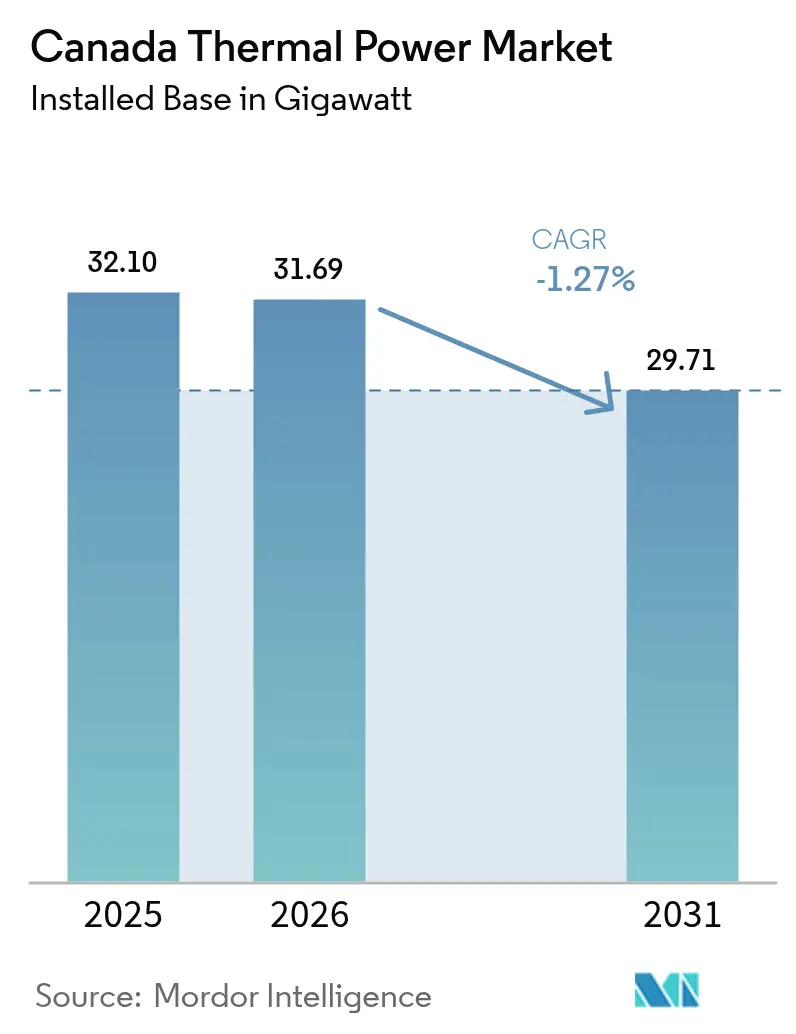
| Base Year Market Size (2025) | 32.10 gigawatt |
| Market Volume (2026) | 31.69 gigawatt |
| Market Volume (2031) | 29.71 gigawatt |
| Growth Rate (2026 - 2031) | -1.27 % |
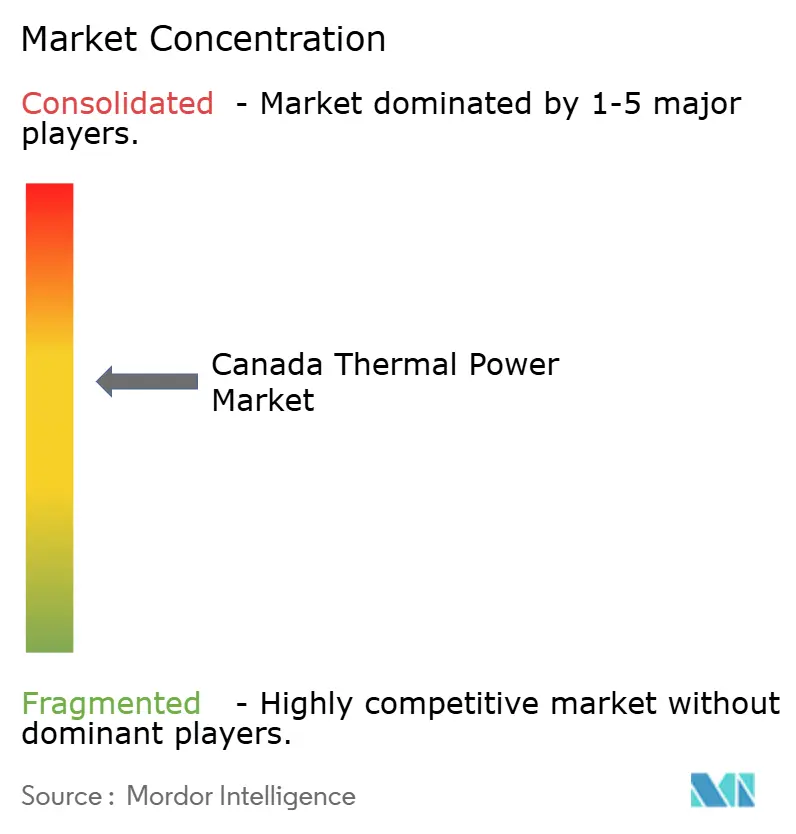
| Market Concentration | Medium |
Major Players *Disclaimer: Major Players sorted in no particular order Image © Mordor Intelligence. Reuse requires attribution under CC BY 4.0. | |
Canada Thermal Power Market Analysis by Mordor Intelligence
Canada Thermal Power Market size in 2026 is estimated at 31.69 gigawatt, growing from 2025 value of 32.10 gigawatt with 2031 projections showing 29.71 gigawatt, growing at -1.27% CAGR over 2026-2031.
Coal’s accelerated retirement under the federal phase-out mandate and the 65 tCO₂/GWh ceiling embedded in the 2024 Clean Electricity Regulations are the core shrinkage catalysts, yet natural-gas combined-cycle upgrades cushion the headline decline by lifting fleet efficiency and lowering per-unit emissions. Alberta’s deregulated power market, British Columbia’s LNG-driven load growth, and Saskatchewan’s post-coal reliability gap collectively underpin replacement demand, while federal investment and carbon-capture tax credits tilt project economics toward gas-fired assets with CCS. Industrial cogeneration additions inside the oil sands, fast-start peakers chasing capacity payments, and hydrogen-ready turbines that future-proof plants against rising carbon prices are the primary opportunity nodes. Meanwhile, corporate renewable PPAs, expanding Québec intertie capacity, and rising carbon costs compress merchant spark spreads and reinforce the shift from baseload to flexibility-focused revenue streams.
Key Report Takeaways
- By fuel type, natural gas captured 46.85% of Canada thermal power plant market share in 2025, and the segment is forecast to expand at a 2.66% CAGR through 2031.
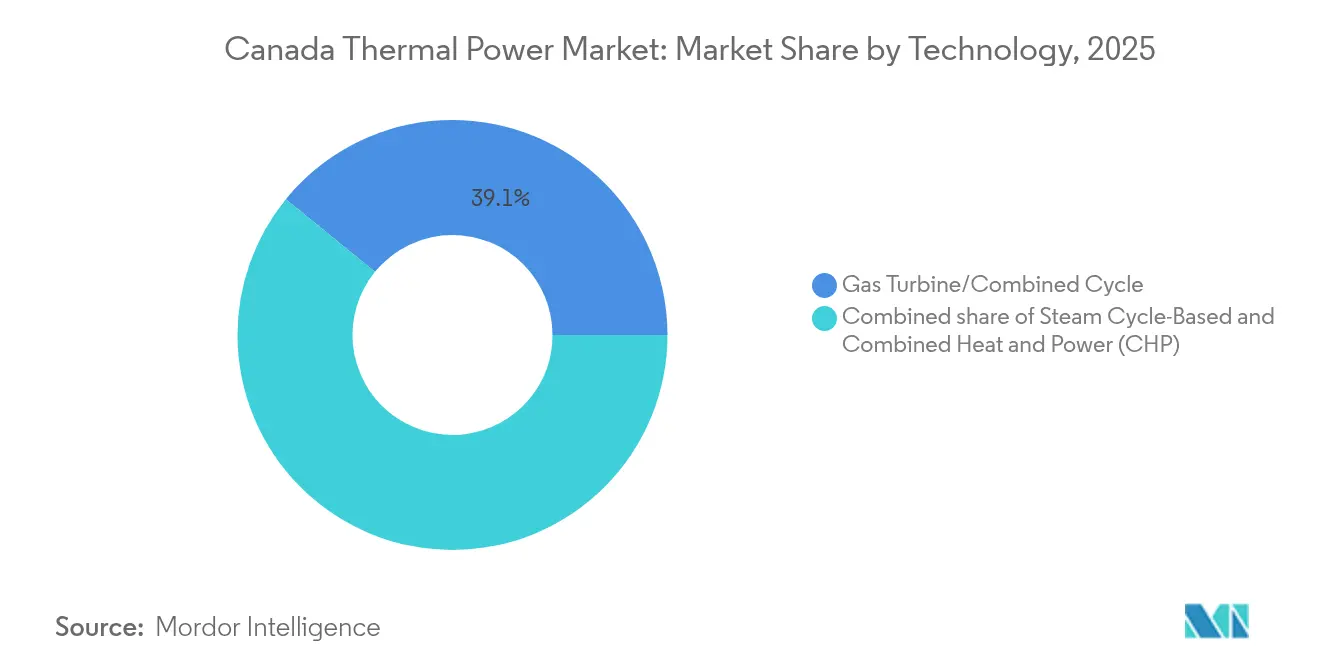
- By technology, gas turbine and combined-cycle units held 39.12% share of the Canada thermal power plant market size in 2025 and are expected to climb at a 2.02% CAGR up to 2031.
- By combustion method, turbine-based systems accounted for 59.15% share of the Canada thermal power plant market size in 2025 and will advance at a 2.55% CAGR between 2026 and 2031.
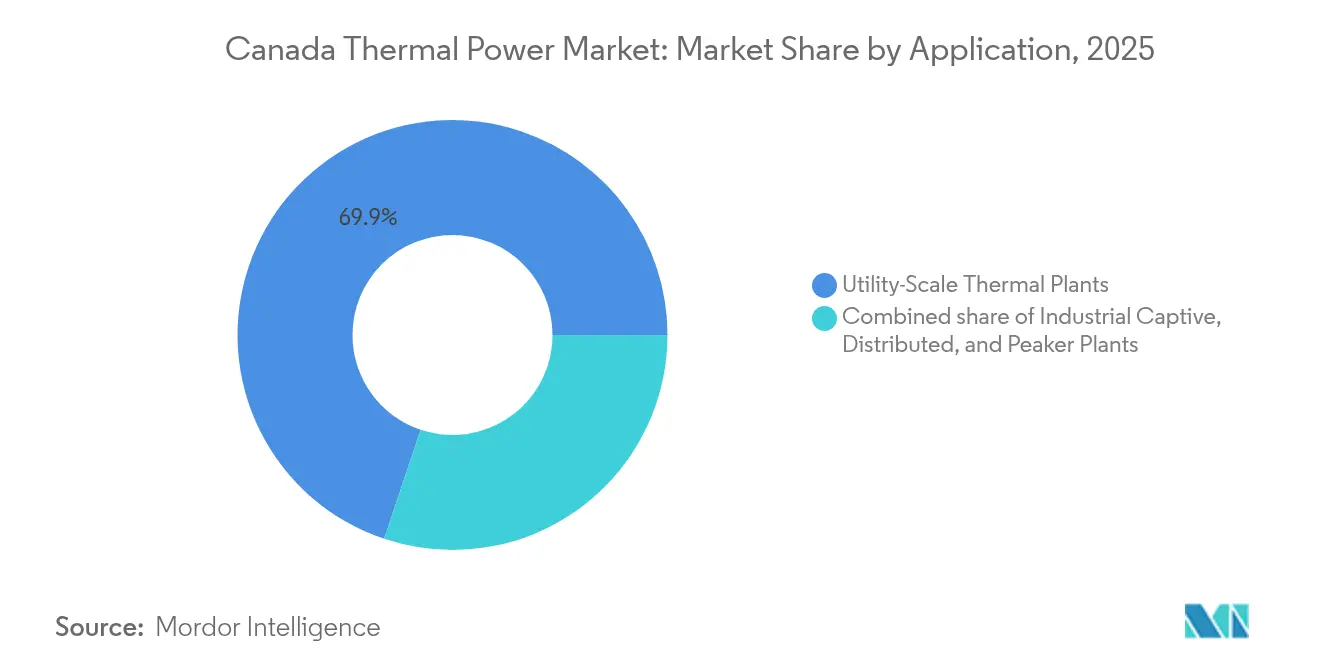
- By application, industrial captive power plants posted 15.35% of the Canada thermal power plant market share in 2025 and are forecast to record the fastest 3.19% CAGR through 2031.
Note: Market size and forecast figures in this report are generated using Mordor Intelligence’s proprietary estimation framework, updated with the latest available data and insights as of 2026.
Canada Thermal Power Market Trends and Insights
Drivers Impact Analysis*
| Driver | (~) % Impact on CAGR Forecast | Geographic Relevance | Impact Timeline |
|---|---|---|---|
| Aging coal fleet replacements with high-efficiency CCGT plants | +2.1% | Alberta, Saskatchewan | Medium term (2–4 years) |
| Increasing grid-reliability concerns amid rising variable renewables | +1.4% | Alberta, Ontario | Short term (≤ 2 years) |
| LNG export growth spurring western-Canada gas-fired capacity | +0.9% | British Columbia, northern Alberta | Long term (≥ 4 years) |
| Provincial carbon-credit floor catalyzing efficiency retrofits | +0.6% | Alberta, Saskatchewan | Medium term (2–4 years) |
| Small modular reactor pilots reshaping long-term baseload mix | +0.3% | Ontario, Saskatchewan, New Brunswick | Long term (≥ 4 years) |
| Oil-sands cogeneration expansions for steam & power self-sufficiency | +0.8% | Alberta oil sands | Medium term (2–4 years) |
| Source: Mordor Intelligence | |||
Aging Coal Fleet Replacements With High-Efficiency CCGT Plants
Ottawa’s 2030 coal ban compressed a decade of retirements into six years, forcing utilities to swap 8 GW of coal with dispatchable alternatives.[1]Canada Energy Regulator, “Canada’s Power Generation Outlook,” cer-rec.gc.ca Alberta finalized its coal exit in June 2024, and Saskatchewan shuttered Boundary Dam Units 4-6 the same year, leaving a reliability gap that only modern CCGT capacity can close. Capital Power’s 1,857 MW Genesee repowering, online since December 2024, sets a 64% thermal-efficiency benchmark and slices emissions intensity by 60%. The Clean Electricity Regulations permit compliant gas units to run to 2050, locking in 25-year revenue visibility and stimulating a USD 2 billion project pipeline. Developers are also designing new turbines with carbon-capture tie-ins or hydrogen co-fire options to future-proof assets against stricter post-2035 rules.
Increasing Grid-Reliability Concerns Amid Rising Variable Renewables
Alberta added more than 4 GW of wind and solar between 2023 and 2024, lifting renewable penetration above 20% on peak days and producing sub-hourly frequency swings that exposed the AESO to reserve shortfalls.[2]Alberta Electric System Operator, “2024 Market Statistics,” aeso.ca The province’s delayed capacity market, now scheduled for 2027, aims to procure 4,500 MW of firm supply, with aeroderivative gas turbines favored for their ten-minute start capability. Ontario faces a parallel 3,000 MW supply gap by 2027 as Pickering nuclear retires and EV-driven load accelerates, pushing the IESO to contract fast-ramp peakers and batteries. January 2024 cold snaps saw Alberta pool prices spike to CAD 999/MWh, reinforcing the economic case for quick-start thermal flexibility.
LNG Export Growth Spurring Western-Canada Gas-Fired Capacity
LNG Canada’s 14 Mtpa Phase 1 terminal, operational since October 2024, devours roughly 300 MW of electricity and anchors a future requirement of 500-700 MW once Phase 2 doubles liquefaction volumes. Joint-venture partners are contemplating on-site cogeneration to trim bought power, a model mirrored by Woodfibre and Cedar LNG. Rising petrochemical investments in Alberta’s Industrial Heartland add another demand node, with pipeline-adjacent merchant CCGTs emerging as the lowest-cost supply choice.
Provincial Carbon-Credit Floor Catalyzing Efficiency Retrofits
Alberta’s TIER scheme generated CAD 500 million of credit trades in 2024 and sets declining intensity baselines that reward CCGT efficiency upgrades or CCS integration. Saskatchewan’s OBPS mirrors TIER and, alongside a federal CCUS investment tax credit covering up to 50% of capture equipment, narrows payback for large-scale retrofits such as Capital Power’s 2 Mtpa Genesee CCS unit.[3]Capital Power, “Genesee Repowering Project Update,” capitalpower.com
Restraints Impact Analysis*
| Restraint | (~) % Impact on CAGR Forecast | Geographic Relevance | Impact Timeline |
|---|---|---|---|
| Federal 2030 coal phase-out mandate | –3.2% | Alberta, Saskatchewan, Nova Scotia | Short term (≤ 2 years) |
| Escalating federal & provincial carbon pricing | –1.8% | National (highest in Alberta, Saskatchewan) | Medium term (2–4 years) |
| Corporate renewable PPAs eroding baseload demand | –1.1% | Alberta, Ontario | Medium term (2–4 years) |
| Inter-provincial transmission favoring hydro imports from Québec | –0.9% | Ontario, New Brunswick | Long term (≥ 4 years) |
| Source: Mordor Intelligence | |||
Federal 2030 Coal Phase-Out Mandate
The coal ban removes 8 GW of capacity by end-2029, stranding CAD 2-3 billion in book value and triggering 8–12% retail-rate hikes in Alberta and Saskatchewan.
Escalating Federal & Provincial Carbon Pricing
The industrial carbon floor climbs toward CAD 170/tonne by 2030, inflating unabated gas-plant variable costs by CAD 68-77/MWh and narrowing merchant spark spreads.
*Our forecasts treat driver/restraint impacts as directional, not additive. The impact forecasts reflect baseline growth, mix effects, and variable interactions.
Segment Analysis
By Fuel Type: Natural Gas Extends Its Lead As Coal Exits
Natural gas-fired assets held 46.85% of the Canada thermal power plant market in 2025 and will climb at a 2.66% CAGR as CCGT replacements fill the coal vacuum. Coal capacity will collapse to negligible relevance by 2029, while oil-fired generation in Atlantic Canada and remote communities retreats below 5% share, squeezed by hydro imports and battery storage. Western Canada's abundant Montney supply anchors gas prices below CAD 3/GJ, keeping dispatch economics competitive even under rising carbon costs. The natural-gas slice of Canada's thermal power plant market size is projected at 17.53 GW in 2031, equivalent to 58.98% of fleet capacity. Hydrogen-ready turbines and CCUS tax incentives provide a hedge against future carbon tightening.
Regional supply dynamics reinforce the trend. Alberta's post-coal demand plus LNG Canada's load in British Columbia lock in 1.5-2 GW of greenfield gas builds through 2030. Oil-fired peakers at Coleson Cove and maritime diesel units face a rapid utilization decline once Churchill Falls exports scale. With no new coal or heavy-oil projects in the pipeline, natural gas secures the only positive growth path within the fuel mix.
By Technology: CCGT Efficiency Sets The Competitive Bar
Gas turbine and combined-cycle units made up 39.12% of installed capacity in 2025 and will advance at a 2.02% CAGR, buoyed by 64% thermal-efficiency benchmarks set by GE 7HA.03 turbines at Genesee. The Canada thermal power plant market size tied to CCGT technology is expected to reach 13.88 GW in 2031. CHP systems linked to oil-sands operations, although smaller, deliver the fastest 2.86% CAGR because waste-heat recovery pushes plant thermal efficiency past 75% and qualifies for provincial TIER credits. Steam-cycle coal stations, down to 2 GW by 2025, are on an irreversible exit trajectory.
Digital-twin analytics reduce forced outages and extend maintenance cycles, slicing LCOE by up to CAD 5/MWh. Aeroderivative simple-cycle units plug peak gaps and win capacity auctions thanks to zero-to-full-load ramps under ten minutes. Older 55-58% CCGTs become marginal unless retrofitted with dry-low-NOx combustors, hydrogen capability, or CCS modules.



By Combustion Method: Turbine-Based Systems Outpace Legacy PF
Turbine-based firing methods controlled 59.15% of installed capacity in 2025 and will grow at a 2.55% CAGR as pulverized-fuel combustion shrinks from 40.85% share to near zero by 2029. Turbine-based capacity within the Canada thermal power plant market size will expand from 18.98 GW in 2025 to 22.05 GW in 2031. Fluidized-bed installations linger in niche biomass and CCS pilots, while internal-combustion engines recede under renewable-plus-storage microgrids in the North. Hydrogen co-firing certification at 50% blend ratios future-proofs large turbines, albeit with cost barriers until green hydrogen drops below CAD 3/kg.
Operational agility defines the method split. Aeroderivative turbines assure ten-minute starts, enabling ancillary-service revenues during renewable volatility, whereas PF boilers need multiple hours, eroding marketability under new capacity market rules. Cap-ex for PF-to-gas conversions rivals greenfield CCGT builds, sealing PF’s phase-out.
By Application: Industrial Captive Power Surges Ahead
Utility-scale stations commanded a 69.85% share in 2025 but hold flat outlooks as corporate PPAs siphon baseload loads. Industrial captive plants, now 15.35%, will post a 3.19% CAGR on the back of oil-sands cogeneration, lifting their share to 19.62% by 2031. Captive additions of 1.2-1.4 GW, led by Suncor and Imperial Oil, push the Canada thermal power plant market size for industrial power toward 5.86 GW in 2031. Distributed plants under 50 MW fade in urban centers where rooftop PV and batteries undercut gas CHP, yet remain viable for data centers, hospitals, and campuses that prize resilience.
Peaker projects flourish: Alberta’s 2027 capacity auction and Ontario’s annual IESO procurements pay CAD 50-80/kW-year, strengthening investment cases for fast-start turbines. Merchant operators such as ENMAX and ATCO already extract 15-25% capacity factors from peaker fleets, monetizing reserve and black-start services during renewable troughs.
Geography Analysis
Alberta remains the epicenter, owning 44.70% of Canada's thermal power plant market capacity in 2025. Coal’s June 2024 exit and a deregulated pool structure fuel a 2 GW queue of CCGT builds, while peak-period pool prices above CAD 999/MWh validate fast-start gas economics. TIER credit liquidity, worth CAD 500 million in 2024, offsets carbon-price escalation and accelerates CCS retrofits.
Saskatchewan’s market contracts as 1.2 GW of coal shut in 2024, yet Aspen CCGT and prospective SMRs plug part of the gap. Ontario pivots to nuclear refurbishments and 2 GW of firm hydro imports from Québec, constraining gas dispatch mainly to peaking duty. British Columbia’s northeast emerges as a growth pocket, where LNG Canada’s rising load could trigger 700 MW of gas builds post-2025. Atlantic Canada leans on hydro imports via Hydro-Québec’s CAD 10 billion intertie, eroding thermal utilization at Coleson Cove below 30%. Manitoba and Québec, both hydro-dominant, keep thermal to diesel backup in remote grids.
Regulatory Landscape
Canada’s thermal fleet operates under overlapping federal and provincial rules that tighten emissions compliance while preserving reliability carve-outs. Environment and Climate Change Canada (ECCC) finalized the Clean Electricity Regulations in 2024 (SOR/2024-263), including a 65 tCO2/GWh performance-threshold framework that becomes the central compliance test for fossil-fired generation, alongside the federal requirement to phase out conventional coal-fired electricity by December 31, 2029. These rules shape new-build and life-extension decisions toward high-efficiency gas technologies and retrofit pathways that can meet or offset emissions limits.
On permitting and governance, the Canada Energy Regulator (CER) continues to anchor federal oversight for energy infrastructure. Separately, the Government of Canada has highlighted streamlined federal decision-making and shorter review timelines as part of broader electricity-system policy work. In May 2026, the federal government initiated a National Electricity Strategy consultation process aimed at doubling grid capacity by 2050 and improving approval processes, adding a policy signal that links generation compliance requirements with faster build-out of enabling grid infrastructure.
Competitive Landscape
Competitive Landscape
Provincial incumbents, TransAlta, Capital Power, Ontario Power Generation, SaskPower, and Emera, control around 60% of total capacity, but divestitures and strategy pivots generate churn. TransAlta’s CAD 1.0 billion Sundance sale to Heartland in March 2024 funds renewable and battery moves, while Capital Power offloaded the 144 MW Joffre cogeneration unit to Pembina and poured proceeds into Genesee CCS.[4]TransAlta Corporation, “Asset Portfolio Review 2024,” transalta.com Alberta’s merchant arena adds competitive tension, with Maxim, ATCO, and ENMAX battling on dispatch economics against carbon costs nearing CAD 95/tonne.
Oil-sands producers emerge as embedded-generation challengers; Suncor, Imperial Oil, and CNRL collectively add over 1 GW of cogeneration and bypass grid suppliers. Technology leadership swings to operators of GE 7HA.03 and Siemens D-Series turbines, which enjoy 64% efficiency and digital-twin availability gains that older plants struggle to match. Federal CCUS and Clean Electricity credits tilt the playing field toward balance-sheet-strong incumbents able to underwrite capture units or hydrogen pilots, potentially squeezing out thinly capitalized merchants by 2030.
Regulatory certainty under the Clean Electricity Regulations secures 25-year runways for compliant gas assets but obliges 65 tCO₂/GWh or better performance from 2035, effectively making CCS or hydrogen readiness a license to operate. White-space investment concentrates in Alberta peakers, Saskatchewan CCGTs, and industrial CHP, where dual heat-power revenues sweeten project IRRs.
Canada Thermal Power Industry Leaders
SaskPower International Inc
TransAlta Corporation
Ontario Power Generation Inc
Capital Power Corporation
Emera Inc.
- *Disclaimer: Major Players sorted in no particular order

Market Opportunities and Future Outlook
Compliance-driven replacement and retrofit activity is concentrated in dispatchable, lower-emitting thermal assets and industrial self-generation that can satisfy tightening federal standards. With finalization of the Clean Electricity Regulations in December 2024 for fossil fuel-fired units (>=25 MW), together with the mandatory coal phase-out by December 31, 2029, developers have clearer whitespace for efficient combined-cycle additions, conversions, and peaking capacity where provinces face near-term adequacy constraints. Gas-project economics improve when decarbonization options are designed in early, including CCS-ready designs and hydrogen-capable turbines, which aligns with the report’s observed shift from baseload operation to flexibility-led revenue stacks in markets such as Alberta.
Industrial development and large contractual off-take arrangements also provide a more direct route to thermal investment. In 2025, combustible fuels contributed 143.4 million MWh (22.9%) of total Canadian electricity generation, underscoring the role of thermal supply in balancing variable renewables. The federal government’s May 2026 consultations on a National Electricity Strategy to double grid capacity by 2050, together with CER energy-system scenario work, reinforces near-term demand for firm capacity while transmission and interties expand, supporting thermal projects that secure long-term contracts and integrate emissions-reduction measures rather than relying only on merchant dispatch margins.
Recent Industry Developments
- July 2026: Capital Power reached a final investment decision for the Greenlight Electricity Centre in Sturgeon County, Alberta, a gas-fired power plant designed to supply electricity to a Meta Platforms data center. The decision points to growing reliance on long-term, large-load contracts to underwrite new thermal capacity and reduce exposure to pool-price volatility in Alberta.
- April 2026: TransAlta mothballed Sheerness Unit 1 in Alberta effective April 1, 2026, for up to two years, while retaining the option to return the unit to service. The move shows how operators are managing thermal asset optionality as coal exits and emissions compliance tightens, keeping flexibility available if regional supply-demand conditions shift.
- May 2025: TransAlta finalized the acquisition of Heartland Generation, expanding its position in Alberta’s gas-fired fleet. The transaction strengthens its scale in a deregulated market where fast-ramping thermal capacity competes for energy and reliability revenues as variable renewable penetration rises.


Research Methodology Framework and Report Scope
Market Definition and Coverage
For this methodology, the Canada thermal power market is measured as the country's installed thermal generation capacity in operation, reported in gigawatts, and tied to utility and non-utility assets that supply electricity.
Scope exclusions: We exclude non-thermal generation such as hydro, wind, solar, and other renewable-only assets, along with pure transmission and distribution activities.
Segmentation Overview
- By Fuel Type
- Coal-Fired Power Plants
- Natural Gas-Fired Power Plants
- Oil-Fired Power Plants
- By Technology
- Steam Cycle-Based
- Gas Turbine/Combined Cycle
- Combined Heat and Power (CHP)
- By Combustion Method
- Pulverized Fuel (PF) Combustion
- Fluidized Bed Combustion
- Gasification
- Internal Combustion Engines
- Turbine-Based Combustion
- By Application
- Utility-Scale Thermal Plants
- Industrial Captive Power Plants
- Distributed Thermal Plants
- Peaker Plants
Data Sources, Market Sizing, and Validation
Desk Research
Desk work started with a clear picture of Canada's generation fleet and how it changes over time, since capacity additions and retirements drive the thermal outlook. We referenced public datasets and reporting such as Statistics Canada energy tables, Natural Resources Canada energy publications, the Canada Energy Regulator market snapshots, and International Energy Agency and U.S. EIA cross-country power statistics for consistency checks.
To make the inputs usable in a forecast, we also reviewed system operator and provincial documents for planned unit retirements, refurbishments, and resource plans, followed by company filings and investor presentations for plant level timelines and utilization context. Where needed, we used paid subscriptions for company financials and intelligence and for a patent database to understand equipment upgrade direction, and then reconciled those signals back to public capacity listings. The sources listed here are illustrative, and many other public and paid references were also used for data collection, validation, and clarification.
Primary Interviews and Surveys
Primary work was used to pressure-test what is actually likely to stay online, what is likely to retire early, and which projects are real versus still conceptual. We spoke with a mix of developers, operators, EPC and maintenance participants, and large power buyers across Canada so we could validate assumptions on fuel switching, permitting pace, and the practical role of peaker and industrial captive assets.
Distribution of primary research fieldwork respondents
| Company type | Respondent position |
|---|---|
| Top tier: 37% | CXOs: 14% |
| Mid tier: 45% | Functional/Unit leaders: 40% |
| Smaller Players: 18% | Managers: 46% |
Market-Sizing & Forecasting
Sizing is built mainly from a top-down capacity reconstruction, where published plant listings, commissioning schedules, and retirement notices are converted into a year-by-year installed GW view for thermal assets across Canada. To keep the totals realistic, we then corroborated the results with selective bottom-up approximations, using sampled plant roll-ups and sanity checks on typical unit sizes by technology before any final adjustment.
Key inputs we used include announced retirements and refurbishments, new-build and repowering pipelines, expected capacity factors for coal, gas, and oil units, fuel availability and pricing direction (as reflected in public energy statistics), and grid reliability needs that can keep peakers online longer than planned. For forecasting, scenario analysis was used so timing-sensitive items, like permitting delays and policy-driven phaseouts, could be reflected as a base case with clear alternative paths. When gaps appeared in project details, the missing pieces were filled using peer-plant benchmarks and then re-checked with interview feedback before locking the model.
Data Validation & Update Cycle
Validation is done through triangulation across independent signals, including total installed capacity series, known unit retirements, and the plausibility of annual net additions against announced pipelines. Outliers are flagged early, followed by a second pass where assumptions like retirement timing or technology classification are revisited, and then a separate analyst review is completed before sign-off.
The model is refreshed annually, and interim updates are made when material events occur, such as a major plant closure, a policy change that impacts thermal dispatch, or a confirmed new-build reaching financial close. Right before delivery, we perform a fresh check so clients receive the most current view aligned to the latest public releases and interview learnings.
Mordor Intelligence's Canada Thermal Power Market Sizing Compared With Other Published Estimates
Published market sizes for Canada thermal power do not always line up because some sources measure installed capacity, while others report industry revenue, and they may also treat fuel types and captive assets differently. Differences in base year choice and how planned retirements are timed can further widen the spread.
A common gap driver is that revenue-based estimates can move sharply with fuel costs and power prices even if the physical fleet stays similar, while capacity-based estimates move mainly with commissioning and retirement events. Another driver is scope, since some publications fold nuclear and broader power value chain activities into a thermal label, and currency timing can also shift USD values across years.
Benchmark comparison
| Source | Market Size | Gaps in Research Methodology |
|---|---|---|
| Mordor Intelligence | USD 32.10 B (2025) | |
| Industry Database A | USD 19.00 B (2025) | This figure is reported as industry revenue, so it is influenced by power prices and fuel cost pass-through, and it does not map cleanly to an installed GW capacity boundary. |
| Market Report B | USD 17.50 B (2024) | This estimate appears to mix a broader fuel and end-user scope with a different base year, and it is less explicit on how retirements and repowering are carried year to year. |
The table shows that the biggest spread comes from mixing revenue and capacity metrics, plus how adjacent generation types and timing assumptions are handled. By keeping the market unit tied to installed thermal GW and re-checking retirements and project status through interviews, the sizing choice is applied consistently in Mordor Intelligence.


Key Questions Answered in the Report
What capacity did the Canada thermal power plant market add or retire in 2024?
The fleet shed 3.8 GW of coal in Alberta and 1.2 GW in Saskatchewan while adding 1.9 GW of new CCGT at Genesee.
Which province currently has the largest share of Canada's operating thermal capacity?
Alberta, with about 44.70% of installed gas-fired capacity after its complete coal exit.
How will the Clean Electricity Regulations affect new gas projects after 2035?
Gas plants must meet or offset a 65 tCO?/GWh intensity cap, steering developers toward CCS integration or hydrogen blends to stay compliant.
Where are the fastest-growing captive power opportunities?
Oil-sands sites in northern Alberta are adding more than 1 GW of high-efficiency cogeneration by 2030.
What incentives support carbon-capture retrofits on Canadian gas plants?
A federal CCUS investment tax credit covering up to 50% of eligible capital and a 15% Clean Electricity ITC significantly improve project economics.
Which technology currently sets the efficiency benchmark in Canadian CCGT plants?
GE's 7HA.03 turbine, operating at 64% combined-cycle efficiency at the Genesee site in Alberta.
Page last updated on:





