
India Spectator Sports Market Size and Share
Market Overview
| Study Period | 2020 - 2031 |
|---|---|
| Forecast Data Period | 2026 - 2031 |
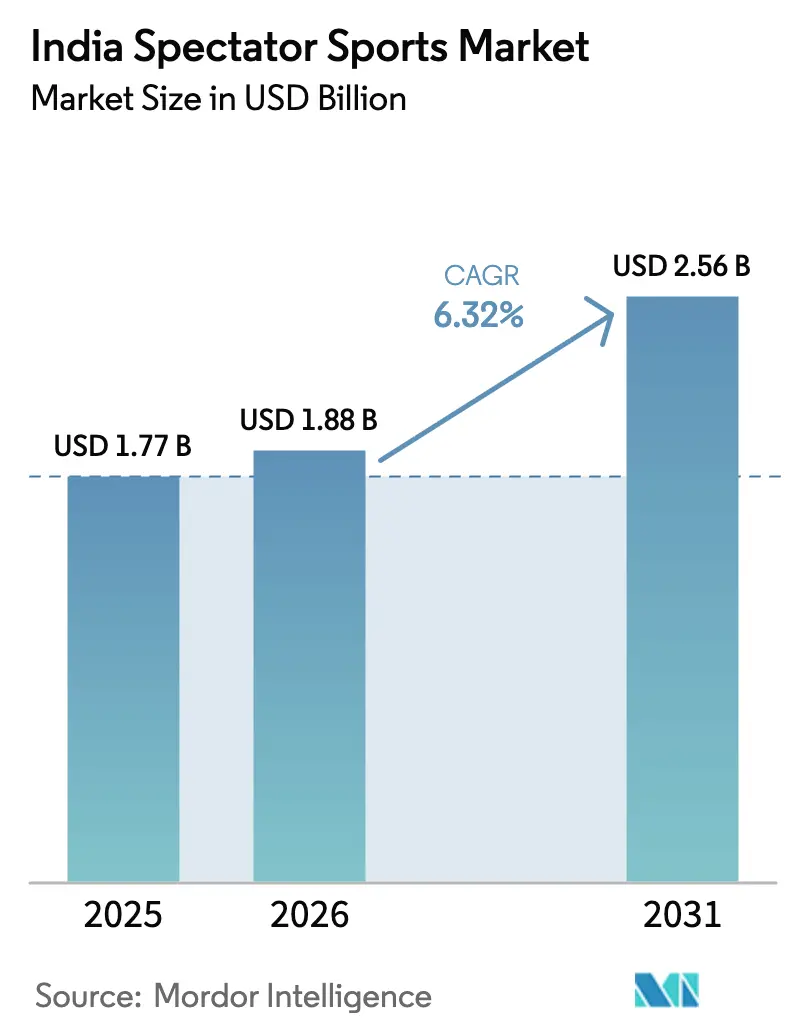
| Base Year Market Size (2025) | USD 1.77 Billion |
| Market Size (2026) | USD 1.88 Billion |
| Market Size (2031) | USD 2.56 Billion |
| Growth Rate (2026 - 2031) | 6.32 % |
| Market Concentration | Medium |
Major Players *Disclaimer: Major Players sorted in no particular order Image © Mordor Intelligence. Reuse requires attribution under CC BY 4.0. | |
India Spectator Sports Market Analysis by Mordor Intelligence
India spectator sports market size in 2026 is estimated at USD 1.88 billion, growing from 2025 value of USD 1.77 billion with 2031 projections showing USD 2.56 billion, growing at 6.32% CAGR over 2026-2031. Growth momentum stems from digital streaming consolidation, rising disposable income in metropolitan areas, and government-backed infrastructure programmes that raise stadium capacity and fan accessibility. Corporate sponsorship budgets continue to migrate from traditional advertising into live sports because broadcast reach and emotional resonance remain unrivalled. At the same time, fantasy-sports engagement and smart-stadium rollouts convert passive viewers into high-spending participants, thereby diversifying revenue beyond media rights. Although piracy and rising player costs weigh on profitability, technology-enabled per-ticket yield uplift and bundled streaming packages mitigate these headwinds.
Key Report Takeaways
- By type, sports teams and clubs commanded a 48.74% share of the India spectator sports market size in 2025, while individual sports are on track for a 16.1% CAGR between 2026 and 2031.
- By revenue source, media rights contributed 42.85% of the India spectator sports market share in 2025; merchandising is projected to accelerate at a 18.55% CAGR through 2031.
- By sport, cricket retained a 60.65% share of the India spectator sports market in 2025; women’s cricket is estimated to expand at a 23.85% CAGR through 2031.
- By geography, West India led with 29.05% revenue contribution of the India spectator sports market in 2025; East India is poised for a 14.05% CAGR to 2031.
Note: Market size and forecast figures in this report are generated using Mordor Intelligence’s proprietary estimation framework, updated with the latest available data and insights as of 2026.
India contributes to a system defined not by any single country or region but by the interaction of many. The global spectator sports market data by Mordor Intelligence represents that combined structure.
India Spectator Sports Market Trends and Insights
Drivers Impact Analysis*
| Driver | (~) % Impact on CAGR Forecast | Geographic Relevance | Impact Timeline |
|---|---|---|---|
| Rising disposable income & urban middle-class spend | +1.2% | Metros & Tier-1 cities | Medium term (2-4 years) |
| Expansion of digital streaming platforms | +1.8% | National, faster in South & West | Short term (≤2 years) |
| Government programmes supporting infrastructure | +0.9% | Nationwide, focus on North & Central | Long term (≥4 years) |
| Escalating corporate sponsorship anchored by IPL | +1.4% | National, dense in the West & South | Medium term (2-4 years) |
| Fantasy-sports engagement converting to live attendance | +0.7% | Urban markets | Short term (≤2 years) |
| Smart multi-purpose stadium projects | +0.5% | Metros & state capitals | Long term (≥4 years) |
| Source: Mordor Intelligence | |||
Rising Disposable Income & Urban Middle-Class Spend
Acceleration in salaried employment across technology and financial-services hubs is lifting discretionary budgets and shifting entertainment habits toward premium live experiences. Ticket packages that include hospitality lounges, curated food services, and merchandise bundles sell out faster than general admission, indicating willingness to pay for exclusivity. The trend also fuels higher average selling prices for replica jerseys and licensed collectibles that celebrate franchise identity. Metropolitan consumers demonstrate stronger brand loyalty when experiential value aligns with aspirational lifestyles, a fact reflected in consistently higher per-capita gate receipts in Mumbai, Bengaluru, and Delhi [1]Source: Business Standard Staff, “India’s urban consumption story intact despite some softness: Report,” business-standard.com . Growing disposable income, therefore, supports top-line resilience even when macroeconomic volatility curbs other discretionary categories.
Expansion of Digital Streaming Platforms
The Disney-Reliance combination of Hotstar and Viacom18 amasses roughly 750 million monthly users, enabling national reach and granular audience targeting. Free-to-view IPL matches on JioCinema rewired viewer expectations in 2024, forcing rivals to innovate around freemium tiers, regional-language commentary, and augmented-reality statistics overlays. Consolidated buying power is already influencing future media-rights tenders as leagues gauge whether fewer bidders will cap escalation in contract value. Meanwhile, advertisers benefit from cross-platform frequency capping and unified measurement dashboards that reduce wastage. The rapid shift toward connected-TV consumption in smaller cities shortens monetization cycles for niche sports once limited to pay-TV windows, accelerating revenue diversification.
Government Programmes Supporting Infrastructure
Khelo India financing and state-level allocations are converting outdated grounds into multi-sport arenas equipped with LED floodlights, automated ticketing, and athlete support facilities. Odisha’s INR 1,000 crore (USD 120 million) outlay for the 2025 National Games exemplifies long-horizon investment that boosts local employment, tourism, and venue utilization[2]Source: Times of India Sports Desk, “National Sports Policy 2025 to be launched soon,” timesofindia.indiatimes.com . Improved supply chains for turf management and broadcast infrastructure lower operating costs for event organizers, permitting more competitive pricing in markets previously constrained by poor facilities. Over time, quality assets in Tier-2 cities unlock fresh fan bases, balancing the geographic skew toward legacy metros.
Escalating Corporate Sponsorship Anchored by IPL Success
Tata’s record INR 2,500 crore (USD 300 million) title-sponsorship renewal through 2028 reset valuation benchmarks across all Indian sport properties [4]Source: SportBusiness Staff, “Tata retains IPL title sponsor rights in record deal,” sportbusiness.com . Brands outside endemic categories, such as fintech wallets and electric-vehicle OEMs, now commit to multi-year deals to secure marquee inventory. Cross-platform activations that mix television, streaming, and on-ground engagements deliver measurable lift in brand affinity among 18-34-year-olds, prompting boardrooms to reallocate budgets away from traditional television. Sponsorship fee inflows improve league working capital and encourage expansion into women’s formats and new geographies, compounding the growth flywheel.
Restraints Impact Analysis*
| Restraint | (~) % Impact on CAGR Forecast | Geographic Relevance | Impact Timeline |
|---|---|---|---|
| Piracy of live broadcasts eroding media rights value | -1.1% | Urban markets with high internet penetration | Short term (≤2 years) |
| Franchise fees & player salaries compressing margins | -0.8% | Premium leagues nationwide | Medium term (2-4 years) |
| Tier-2 city transport bottlenecks are limiting events | -0.6% | Tier-2 & Tier-3 cities | Long term (≥4 years) |
| Cybersecurity risks for ticketing/fantasy platforms | -0.4% | Digital-first markets | Short term (≤2 years) |
| Source: Mordor Intelligence | |||
Piracy of Live Broadcasts Eroding Media-Rights Value
Unofficial streaming platforms divert advertising impressions, distort audience measurement metrics, and reduce broadcasters' motivation to increase bids for broadcasting rights. A notable proportion of Indian viewers reportedly engage in password sharing or access illegal streaming links, resulting in substantial annual revenue losses amounting to hundreds of millions. This directly impacts the profitability of the most lucrative segment within the Indian spectator sports market. The enforcement of anti-piracy measures is further challenged by the rapid reappearance of mirror sites shortly after takedown efforts. Consequently, rights holders are compelled to allocate significant resources toward technologies such as watermarking and legal interventions, which escalate operational costs. Additionally, advertisers increasingly scrutinize audience reach claims, prompting the inclusion of stricter contractual terms and contributing to a decline in cost-per-thousand impressions (CPMs).
Franchise Fees & Player Salaries Compressing Margins
In 2024, the Indian Premier League (IPL) experienced a notable increase in player salaries, attributed to rising auction prices. This upward trend reflects the growing financial competitiveness within the league. Concurrently, the introduction of new leagues witnessed a significant rise in team entry fees, driven by heightened media attention and market enthusiasm. These developments underscore the expanding commercial landscape of cricket and its increasing appeal to investors and stakeholders. These outlays challenge cash flows because revenue sharing from central pools often lags by a season, requiring bridge financing at high interest rates. Women’s Premier League clubs, though enjoying rapid fanfare, already face cap-hit ratios that mirror early-era men’s IPL, signalling sustainability risks if sponsorship softens. Smaller disciplines such as kabaddi and hockey encounter similar wage inflation as they strive to retain marquee athletes against overseas offers.
*Our forecasts treat driver/restraint impacts as directional, not additive. The impact forecasts reflect baseline growth, mix effects, and variable interactions.
Segment Analysis
By Type: Franchise Models Drive Commercial Success
The sports teams and clubs segment held 48.74% of the India spectator sports market in 2025, powered by the franchise model that blends local fandom with corporate governance standards. Individual sports collectively posted a 16.1% CAGR outlook, signalling diversified appetites beyond team formats. Franchise cricket remains the reference point for operational best practice, but kabaddi, football, and volleyball leagues emulate its revenue sharing, salary caps, and marquee-player auctions. Enhanced broadcast packages and fixture uniformity foster appointment viewing, boosting advertiser demand. Meanwhile, individual-sport promoters leverage athlete storytelling to ignite fan passion and command premium appearance fees.
Commercial frameworks under the franchise system deliver predictable income streams, central media pools, licensing payouts, and hospitality share, mitigating seasonality. Conversely, individual sports rely on marquee event calendars, necessitating strong sponsorship pipelines and nimble cost management. Both tracks benefit from digital collectibles that turn highlights into monetizable non-fungible tokens, adding incremental revenue without stadium overheads. The coexistence of these models broadens the India spectator sports market, ensuring that local heroics in boxing or badminton can secure national airtime alongside cricket blockbusters.




By Revenue Source: Media Rights Dominance Faces Digital Disruption
Media rights accounted for 42.85% of 2025 revenue but intensified streaming consolidation is already moderating auction fever. Merchandising, projected at 18.55% CAGR to 2031, exploits e-commerce reach, influencer marketing, and rapid-design supply chains to convert emotional fandom into year-round purchasing. Sponsorship remains the steady second pillar as brands see rising ROI from real-time engagement metrics and data-driven activation. Ticket income, though still cyclical, is benefitting from smart-stadium value-adds that lift spend per head.
The India spectator sports market size tied to media rights will still edge higher in absolute terms because more properties reach broadcast quality; however, its share may dip as ancillary streams accelerate. Merchandise strategies now include limited-edition drops, sustainable fabrics, and athlete-signed items sold via live commerce during matches. Sponsorship bundling across men’s and women’s leagues encourages advertisers to lock multi-property deals, reducing renewal risk for rights holders. Taken together, these shifts enhance revenue stability while lowering systemic exposure to any single channel.
By Type of Sport: Cricket Hegemony Faces Demographic Challenges
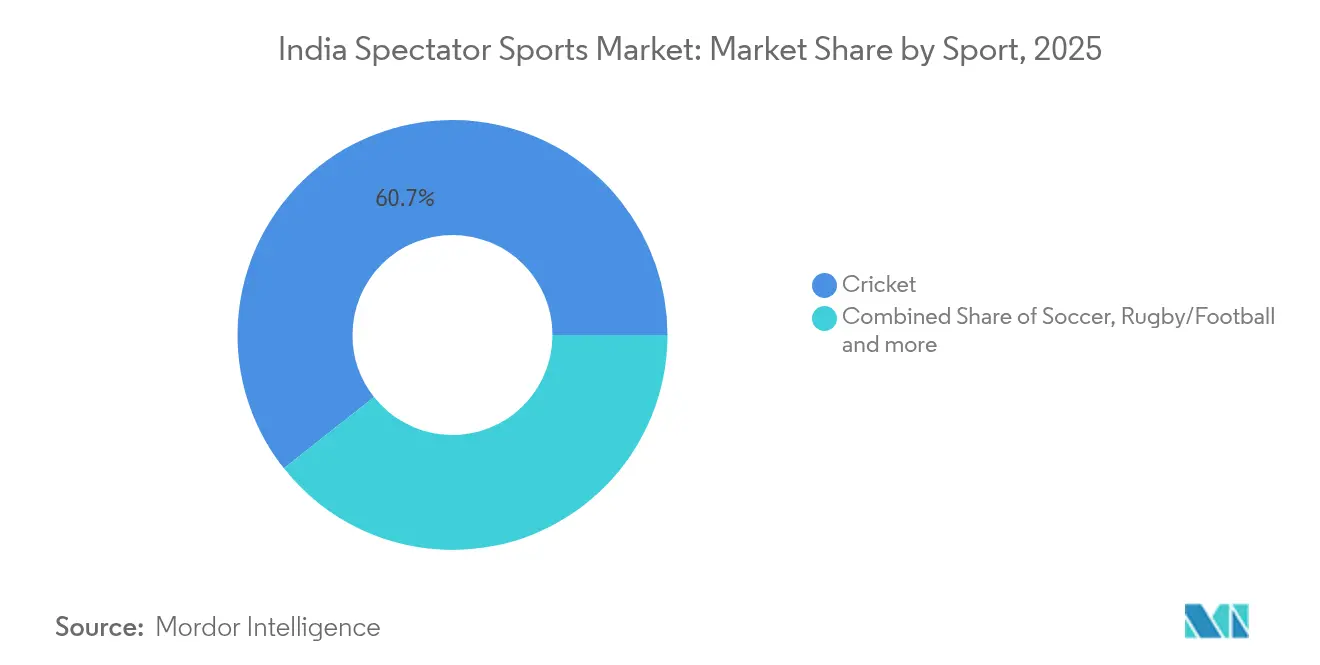
Cricket preserved a 60.65% share in 2025, yet its dominance no longer implies exclusivity. The India spectator sports market size for women’s cricket is forecast to rise at 23.85% CAGR, reflecting progressive social attitudes and purposeful investment in female athlete pathways. Football’s youthful following expands during international tournaments, offering broadcast windows that complement the domestic cricket calendar. Kabaddi and badminton thrive on cultural familiarity and school-level participation, enabling audience acquisition at modest marketing spend.
Emergent sports leverage shorter formats and mixed-gender showcases to attract social-media-native fans who prefer bite-sized content. Simultaneously, cricket boards experiment with rule tweaks and night-match scheduling to combat format fatigue and protect viewership. From an advertiser's viewpoint, multi-sport portfolios hedge concentration risk while leveraging common fan data sets, driving incremental value across rights deals. Diversification thus signals market maturity and greater resilience to any single sport’s rating fluctuations.
Geography Analysis
West India generated 29.05% of revenue in 2025 owing to Mumbai’s financial heft, robust transport links, and deep sponsor pool. East India presents the fastest growth prospect at 14.05% CAGR, propelled by stadium upgrades in Kolkata and Bhubaneswar that unlock pent-up demand. South India’s technology-rich demographics sustain premium pricing, whereas North India’s populous states offer scale once infrastructure and marketing bridge historical under-provision. Central India shows green shoots as smart-city programmes bundle sports precincts into urban-renewal budgets.
Regional differentiation compels leagues to customize scheduling, language commentary, and school outreach. For example, Bengali commentary boosts TVR ratings in East India, while Kannada narration lifts engagement in Karnataka. The affordability of cricket tickets demonstrates significant regional variation, with prices in Ahmedabad being comparatively lower than those in Mumbai. This pricing disparity enhances accessibility for a broader audience and fosters the growth of cricket fandom in emerging markets. Such tailored micro-strategies ensure that the India spectator sports market remains inclusive while maximising local revenue capture.
The spectator sports market is analyzed by Mordor Intelligence across multiple other geographies, with in-depth regional assessments available for Asia, Europe, and North America. This is complemented by country-specific insights for United Kingdom, reflecting various localized market behavior and policy environments' coverage.
Regulatory Landscape
Sports broadcasting and monetization in India operate under a multi-agency framework led by the Ministry of Information and Broadcasting (MIB), with sector oversight from the Telecom Regulatory Authority of India (TRAI) and competition scrutiny by the Competition Commission of India (CCI) for media-rights aggregation and related conduct. A central rule shaping rights economics is the Sports Broadcasting Signals (Mandatory Sharing with Prasar Bharati) Act, 2007, which requires live signal sharing of events designated as being of national importance, with revenue sharing set at 75:25 for television (in favor of the private rights holder) and 50:50 for radio.
In 2026, the MIB updated the list of events of national importance on June 11, followed by a technical corrigendum on June 23, explicitly covering all official international cricket matches played by India’s men’s and women’s teams. This increases the compliance burden around signal sharing for cricket inventory and affects packaging decisions across linear TV and digital distribution, particularly where consolidated sports broadcasters and streaming platforms concentrate rights and advertising supply.
Value Chain Analysis
The value chain runs from rights owners and sanctioning bodies (notably the Board of Control for Cricket in India, BCCI) to league and franchise operators, then to event and broadcast production, distribution by broadcasters and OTT platforms, and monetization through advertisers, sponsors, ticketing, and merchandising. In cricket, BCCI’s e-auction model for exclusive media rights concentrates buying power among large broadcast and streaming groups, and the current competitive setup is shaped by the merged Disney Star and Viacom18 entity (JioStar), alongside other networks and platforms competing for premium inventory.
Downstream, distributors (TV networks, OTT services, telecom and device ecosystems) turn rights into reach, while brands and agencies drive demand through ad sales and sponsorship activation, increasingly supported by unified measurement and targeted digital formats. Teams and leagues then reinvest proceeds into player acquisition, marketing, and venue operations, with secondary enablers (ticketing platforms, anti-piracy and cybersecurity vendors, merchandise manufacturers, and e-commerce partners) capturing incremental value as monetization shifts from a single media-rights pool to blended streams across live attendance and digital engagement.
Competitive Landscape
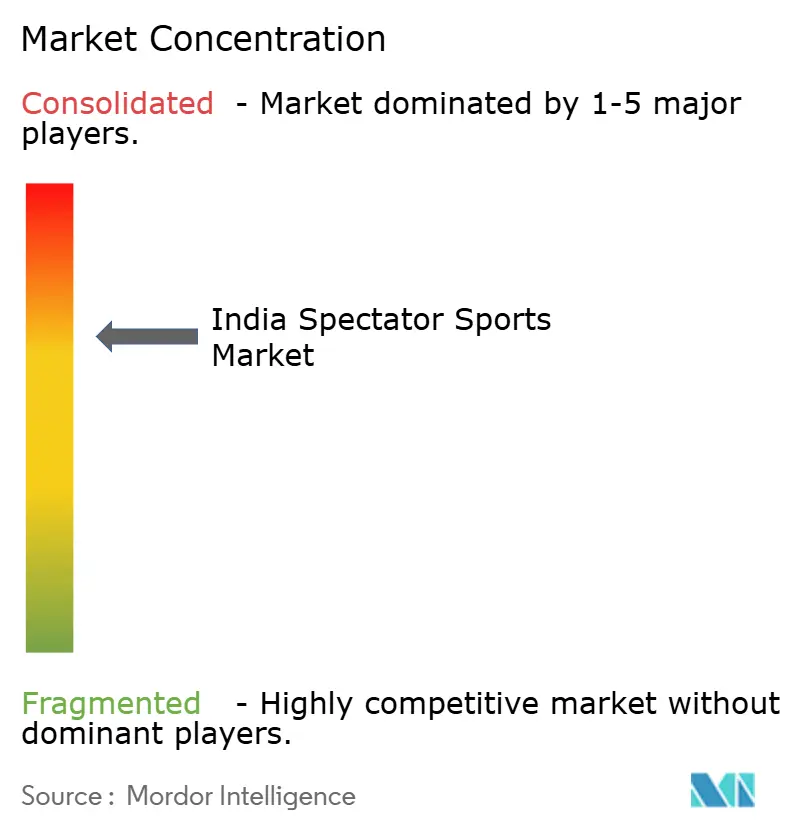
The competitive environment is oligopolistic, with the top conglomerates, Reliance-Disney, Sony-Zee, Star Sports, Dream Sports, and JSW-GMR, controlling a significant share of market revenue. Their vertical integration across content production, distribution, and technology underpins negotiating leverage with leagues and advertisers. The Disney-Reliance merger, for instance, pools linear TV and OTT assets to deliver national footprint at unrivalled scale, compressing bargaining power of smaller broadcasters.
Digital disruptors such as Dream11 reduce dependence on broadcast intermediaries by monetizing direct-to-consumer relationships. Data analytics gleaned from gameplay inform targeted merchandise drops and event cross-sell offers, creating a virtuous loop of engagement and revenue. Franchise owners diversify into overseas properties, GMR’s Hampshire County Cricket Club acquisition being a recent example, to globalize brand equity and hedge domestic volatility.
Sustainable competitive advantage increasingly hinges on technology adoption. Smart-stadium partnerships with telecom operators enable micro-betting and ultra-high-definition streaming, heightening fan immersion and sponsor visibility. Cybersecurity and regulatory compliance capabilities form additional competitive moats, deterring undercapitalized entrants. Overall, incumbents’ breadth across revenue streams buffers them against single-channel shocks, solidifying their dominance.
India Spectator Sports Industry Leaders
Disney Star (Star Sports)
Viacom18 Media
Sony Pictures Networks India
Zee Entertainment Enterprises
Board of Control for Cricket in India (BCCI)
- *Disclaimer: Major Players sorted in no particular order

Market Opportunities and Future Outlook
With media rights contributing 42.85% of India spectator sports revenues in 2025, the clearest opportunity sits in scaling non-rights monetization across geographies and languages. Consolidation across streaming and broadcast distribution (including the Disney Star and Viacom18 combination reaching roughly 750 million monthly users across their platforms in the report context) supports broader regional-language feeds, differentiated ad products, and tighter linkage from content consumption to merchandise and ticketing funnels, aligning with the report’s focus on monetizing regional-language digital content.
Women’s formats also open a second opportunity lane because leagues and sponsors can bundle inventory across men’s and women’s properties without rebuilding distribution from scratch, while still giving advertisers distinct audiences. In parallel, infrastructure-linked, multi-event utilization models improve event depth: Khelo India and state allocations that upgrade venues (for example, Odisha’s INR 1,000 crore outlay connected to the 2025 National Games in the report context) expand the addressable set of broadcast-ready and ticketable events beyond the largest metros, supporting more frequent calendars and additional sponsorship and merchandising touchpoints in Tier-2 markets.
Recent Industry Developments
- July 2026: Walt Disney / Star Group (JioStar India joint venture) infused Rs 123 crore in foreign direct investment into JioStar India into the quarter ended March. The infusion expands the broadcasting and streaming capacity for cricket properties and deepens vertical integration with Reliance for rights and distribution.
- June 2025: Board of Control for Cricket in India (BCCI) released a Request for Proposal for IPL and WPL Digital Properties. The update clarifies the digital property strategy and monetization avenues ahead of the 2025-2026 season cycles.
- November 2024: Reliance Industries Limited / The Walt Disney Company (Viacom18 assets) completed merger of Viacom18 media assets into Star India Private Limited (JioStar India JV). The consolidation creates the largest sports broadcaster platform in India with broader rights and streaming scale, alongside increased regulatory considerations.


Research Methodology Framework and Report Scope
Market Definition and Coverage
For this study, the market is defined as the money earned from watching live sports in India, across organized events and leagues. Revenues are traced to media rights, tickets, sponsorship, and related fan spending tied to the event experience.
Scope exclusions: Gambling, casual video gaming, and broad entertainment spending that is not directly linked to spectator sports revenues are excluded.
Segmentation Overview
- By Type
- Sports Team and Clubs
- Racing
- Individual Sports
- By Revenue Source
- Media Rights
- Merchandising
- Tickets
- Sponsorship
- By Type of Sport
- Soccer
- Cricket
- Rugby/Football
- Tennis
- Other Types of Sports
- By Geography
- North India
- South India
- West India
- East India
- Central India
Data Sources, Market Sizing, and Validation
Desk Research
Desk research was used to set the outer limits of the demand pool and to collect consistent time series that can be compared year to year. We relied on public sources such as Ministry of Information and Broadcasting publications, Ministry of Youth Affairs and Sports updates, Reserve Bank of India macro indicators, and consumer spending and price signals from the Ministry of Statistics and Programme Implementation.
To connect the market to real business activity, we also reviewed sources such as audited financial statements and annual reports of listed ecosystem participants, league and federation disclosures, and reputable press coverage on media rights awards and stadium attendance trends. When a public number had a missing year or an unclear split, we used paid subscriptions for company financials and intelligence, news and financials, and an import-export shipment level database for limited cross-checks on merchandise flow. These examples are indicative, and many other sources were referenced during data collection, validation, and clarification.
Primary Interviews and Surveys
Primary work focused on validating how revenues are actually booked and recognized across media rights, sponsorship, and ticketing, because desk research can miss the recognition mechanics. We spoke with rights holders, agencies, broadcasters, venue operators, and brand-side decision makers across major Indian markets, and then used follow-up checks to confirm pricing logic, sell-through, and normalization factors for one-off events.
Distribution of primary research fieldwork respondents
| Company type | Respondent position |
|---|---|
| Top tier: 36% | CXOs: 12% |
| Mid tier: 44% | Functional/Unit leaders: 42% |
| Smaller Players: 20% | Managers: 46% |
Market-Sizing & Forecasting
Sizing starts with a top-down build where the India revenue pool is reconstructed by revenue lines that are typically reported and discussed in the sector, then split across major spectator sports activities to avoid double counting. To keep totals realistic, we corroborate with selective bottom-up approximations, such as sampled media-rights values mapped to contract years, ticket revenue built from attendance ranges and average ticket prices, and sponsorship values checked through brand spend patterns.
Key inputs that shape the model include media-rights contract timing and amortization assumptions, average ticket price and stadium utilization patterns, sponsorship inventory growth (team, league, and on-ground), the share of digital viewing influencing ad yield, and the frequency of marquee events that can temporarily lift revenues. Forecasts are built using scenario analysis supported by expert views on renewal cycles, ad-rate movement, and consumer spend momentum, then adjusted for the pace at which new leagues scale into stable seasons. Where a revenue line cannot be cleanly observed for a sport, we use peer sport benchmarks and conservative penetration assumptions, and then re-check them in interviews.
Data Validation & Update Cycle
Before finalization, outputs are compared against independent signals such as publicly announced rights deals, headline sponsorship totals, and broad advertising and live-event direction, then any large variance is investigated. We run anomaly checks on year-on-year jumps, currency conversion timing, and unusual mix shifts between media, tickets, and sponsorship, and then the findings are reviewed across more than one internal pass before sign-off.
If a new rights tender, major policy change, or a material league expansion is observed, the assumptions are revisited and relevant experts are re-contacted to confirm likely impact. The report is refreshed annually, and interim updates are made when market-moving events create a clear change in the near-term outlook. Right before delivery, a final analyst pass is completed so clients receive the latest updated view.
Mordor Intelligence's India Spectator Sports Market Sizing Compared With Other Published Estimates
Published market values for spectator sports in India can differ for two main reasons: revenue grouping varies, and base years are not consistent across studies. Some estimates describe a broader sports economy figure, while others limit the scope to rights, sponsorship, and tickets tied to watching live sport.
The main gap comes from including sports advertising and endorsement spends as part of the total. Mordor Intelligence counts only spectator-sports revenues directly tied to event rights, sponsorship packages, ticketing, and related monetization, and then normalizes for contract timing so one-off deals do not overstate a single year.
Benchmark comparison
| Source | Market Size | Gaps in Research Methodology |
|---|---|---|
| Mordor Intelligence | USD 1.77 B (2025) | |
| Industry Report A | USD 2.13 B (2025) | Uses a wider sports economy lens that rolls in media advertising spends and endorsements alongside sponsorship, which inflates totals versus a spectator-revenue-only view. |
| Trade Body Brief B | USD 1.60 B (2024) | Anchors on a prior year and applies higher normalization for event-led volatility, and may exclude smaller leagues and non-cricket sports where disclosures are limited. |
The table indicates that most differences become clear once you separate spectator revenues from broader sports spending and align year and recognition logic. By keeping inputs tied to rights cycles, ticket yield, and sponsorship inventory, the final number remains traceable to steps that can be repeated and checked as new disclosures come out.


Key Questions Answered in the Report
What is the current value of the India spectator sports market?
The market is valued at USD 1.88 billion in 2026 and is projected to reach USD 2.56 billion by 2031.
Which segment generates the highest revenue?
Media rights contribute 42.85% of total revenue, making it the dominant stream.
Which sport is growing fastest in India?
Women’s cricket is forecast to expand at a 23.85% CAGR through 2031, the highest among all sports.
Which region offers the fastest growth potential?
East India is expected to post a 14.05% CAGR between 2026 and 2031 due to new infrastructure investments.
How are fantasy-sports platforms impacting live attendance?
Fantasy sports participants demonstrate higher engagement with live events, contributing to increased revenue through ticket and merchandise sales.
Page last updated on:


 Your data is secure and never sold or shared.


