
Spectator Sports Market Size and Share
Market Overview
| Study Period | 2020 - 2031 |
|---|---|
| Market Size (2026) | USD 196.8 Billion |
| Market Size (2031) | USD 272.43 Billion |
| Growth Rate (2026 - 2031) | 6.72 % |
| Fastest Growing Market | Asia Pacific |
| Largest Market | North America |
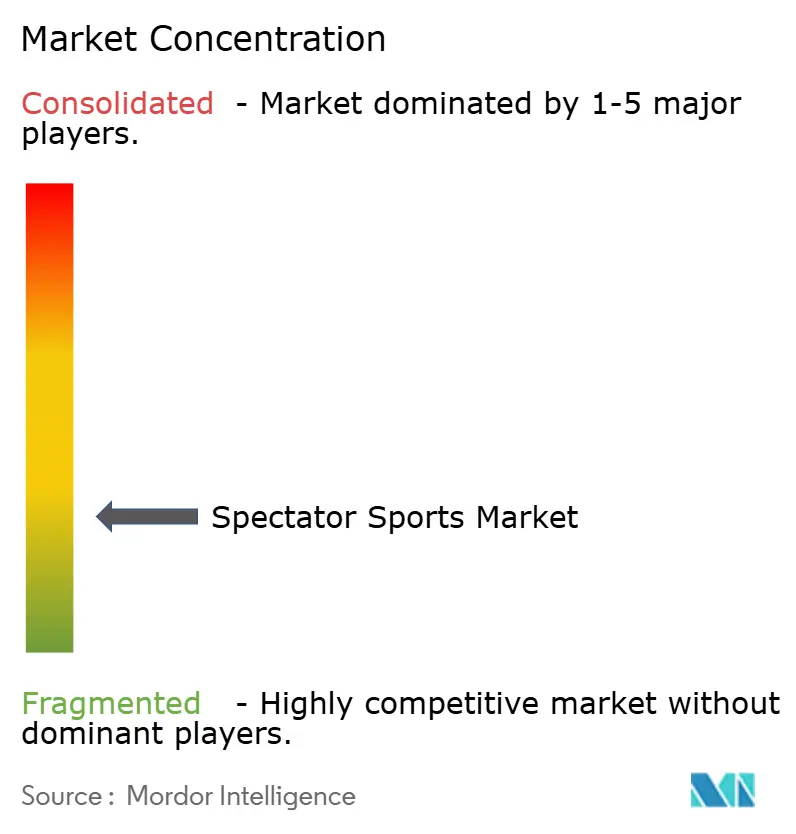
| Market Concentration | Low |
Major Players *Disclaimer: Major Players sorted in no particular order Image © Mordor Intelligence. Reuse requires attribution under CC BY 4.0. | |
Spectator Sports Market Analysis by Mordor Intelligence
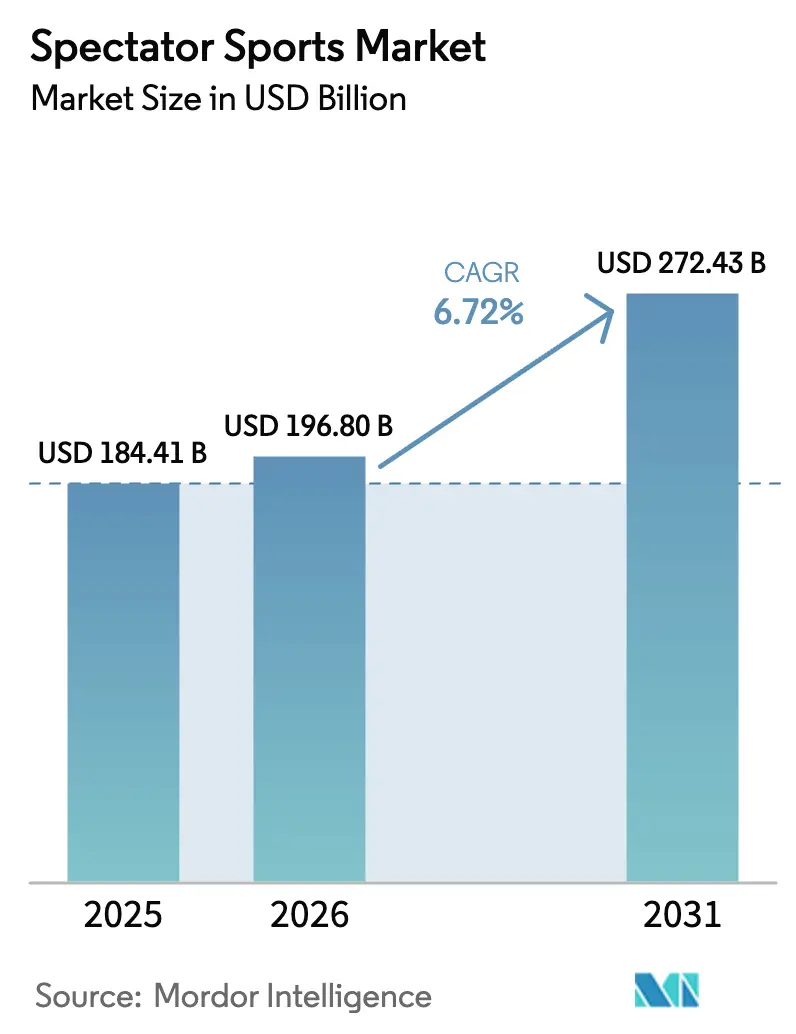
The spectator sports market size was valued at USD 184.41 billion in 2025 and estimated to grow from USD 196.8 billion in 2026 to reach USD 272.43 billion by 2031, at a CAGR of 6.72% during the forecast period (2026-2031). Expansion reflects the league-wide pivot toward direct-to-consumer streaming, the legalization of sports wagering in major economies, and the commercial rise of Asia-Pacific franchises. Live-rights bidding intensified as platforms fight subscriber churn, while legalized gambling lengthened average viewing minutes and lifted in-game advertising yields. Condensed formats such as Twenty20 cricket and indoor golf sustain younger viewers across mobile screens, and omnichannel merchandising paired with blockchain-based loyalty programs helps clubs counter rising labor costs. These cross-currents show that agility in content packaging and fan monetization keeps the spectator sports market resilient even as ticket-price inflation tests household budgets.
Key Report Takeaways
- By revenue stream, media rights captured 37.35% of the spectator sports market share in 2025, while sponsorship and advertising are projected to grow at a 6.68% CAGR through 2031.
- By sport type, football/soccer led with a 38.40% revenue share of the spectator sports market in 2025, cricket is forecast to expand at an 7.96% CAGR to 2031, driven by the Indian Premier League’s valuation surge.
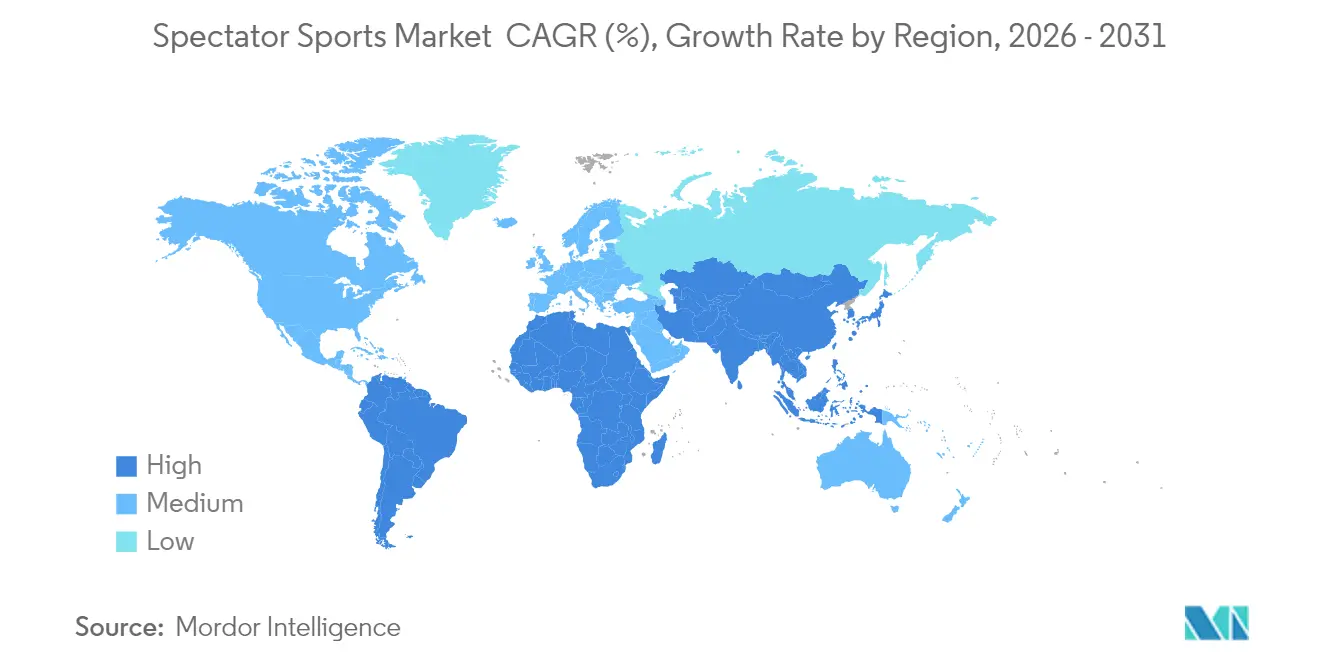
- By geography, North America held 42.55% of the spectator sports market share in 2025, whereas Asia-Pacific is set to record a 7.39% CAGR through 2031.
Note: Market size and forecast figures in this report are generated using Mordor Intelligence’s proprietary estimation framework, updated with the latest available data and insights as of 2026.
Market Trends and Insights
Drivers Impact Analysis of Spectator Sports Market *
| Driver | % Impact on CAGR Forecast | Geographic Relevance | Impact Timeline |
|---|---|---|---|
| Rising media rights valuations from streaming competition | +1.8% | Global, with concentration in North America, Europe, APAC | Medium term (2-4 years) |
| Legalization of sports betting boosting engagement | +1.2% | North America, expanding to Europe and select APAC markets | Short term (≤ 2 years) |
| Commercialization of emerging APAC leagues | +1.0% | APAC core, spill-over to MEA and Europe | Long term (≥ 4 years) |
| Blockchain-based fan tokens as revenue streams | +0.7% | Global, with early adoption in Europe and North America | Medium term (2-4 years) |
| Climate-adaptive stadium designs mitigating weather risk | +0.5% | Global, with priority in climate-vulnerable regions | Long term (≥ 4 years) |
| AI-personalized viewing experiences increasing ARPU | +0.9% | Global, led by technologically advanced markets | Medium term (2-4 years) |
| Source: Mordor Intelligence | |||
Rising media-rights valuations from streaming competition
Global sports-rights fees surpassed USD 60 billion in 2024, underscoring platforms’ willingness to pay premiums for live content that anchors subscriber retention [1]. Netflix moved into live National Football League inventory, while Amazon secured additional National Basketball Association packages, illustrating how tech giants treat sports as must-have engagement engines. YouTube TV’s NFL Sunday Ticket deal, valued at about USD 2 billion per season, signaled the end of single-platform exclusivity and raised bid floors for other marquee properties. Rights owners now stagger packages to extract multiple income streams, though viewers navigate an increasingly fragmented landscape.
Legalization of sports betting boosts engagement
The Supreme Court’s 2018 ruling accelerated wagering adoption; by early 2025, 38 U.S. states and the District of Columbia had legalized sports betting, generating handles that materially lift game-day viewership. Internal league analyses indicate that bettors exhibit higher engagement by watching games for longer durations compared to non-bettors. Additionally, gaming integrations, such as live odds tickers, are driving higher advertising premiums. The American Gaming Association estimates the NBA and MLB together could add USD 1.7 billion in annual revenue from regulated betting ecosystems [2]. Early data also reveal downside risk: losing wagers on a home team can dampen long-term engagement, prompting clubs to embed responsible-gaming prompts in apps.
Commercialization of emerging Asia-Pacific leagues
In 2024, the valuation of the Indian Premier League (IPL) recorded a 6.50% growth, reaching USD 16.4 billion (approximately Rs 1,34,858 crore). Live streams on JioCinema drew 620 million unique viewers in 2024, proving that data-affordable markets can eclipse linear-TV reach. Saudi Arabia's Vision 2030 strategy has directed significant financial resources toward domestic events, including securing long-term Formula 1 hosting rights. This highlights the strategic use of government funding to expedite the development and establishment of competitive leagues. Sponsors follow audience momentum, making Asia-Pacific the lead target for new franchise development through 2030.
Climate-adaptive stadium designs mitigating weather risk
Clubs adopt retractable roofs, water-harvesting systems, and renewable-energy microgrids to address weather volatility. Forest Green Rovers achieved net-zero operations using onsite solar arrays and closed-loop catering, cutting operating costs. Allianz Arena’s rainwater-capture program provides all of the pitch-irrigation needs, lowering utility bills and securing eco-label sponsorships. Crowd-density sensors feed real-time evacuation algorithms, improving insurer risk ratings. Digital ticketing and cash-free concessions reduce queuing times, pushing per-capita spend higher without expanding the footprint.
Restraints Impact Analysis of Spectator Sports Market *
| Restraint | % Impact on CAGR Forecast | Geographic Relevance | Impact Timeline |
|---|---|---|---|
| Escalating player salary inflation compressing margins | -1.4% | Global, most pronounced in North America and Europe | Short term (≤ 2 years) |
| Macroeconomic pressure on discretionary event spend | -0.9% | Global, with varying intensity by economic conditions | Medium term (2-4 years) |
| Cyber-security threats to live-streaming stability | -0.6% | Global, particularly affecting digital-first markets | Short term (≤ 2 years) |
| Regulatory curbs on gambling advertisements | -0.5% | Europe, Australia, expanding to other regions | Medium term (2-4 years) |
| Source: Mordor Intelligence | |||
Escalating player salary inflation is compressing margins
The National Basketball Association's salary cap for the 2024-25 season rose to USD 140.6 million, reflecting the league's sustained revenue growth and financial expansion [3]. Collective-bargaining agreements mandate that approximately 50% of basketball-related income is allocated to players, which imposes financial pressures on team ownership due to escalating fixed costs. In parallel, the Premier League experienced a 10% year-over-year increase in wage bills in 2024, driven by higher revenues from Champions League broadcasting rights. To address the challenges of shrinking operating margins, clubs are strategically channeling resources into youth academy development to cultivate homegrown talent and reduce reliance on expensive transfers. Furthermore, they are focusing on expanding premium hospitality offerings to diversify income streams and improve overall profitability.
Cybersecurity threats to live-stream stability
As over-the-top distribution replaces linear feeds, piracy and denial-of-service attacks proliferate. Major League Baseball and the Premier League collaborated with Internet-service providers to block illegal streams within 15 minutes of detection, reducing unauthorized viewership. Broadcasters now embed forensic watermarks and zero-trust edge nodes to harden streaming stacks, but smaller rights holders struggle to absorb soaring security spend. Consumer backlash after high-profile outages pushes regulators to draft minimum-uptime standards for live events.
*Our forecasts treat driver/restraint impacts as directional, not additive. The impact forecasts reflect baseline growth, mix effects, and variable interactions.
Spectator Sports Market Segment Analysis
By Revenue Stream:
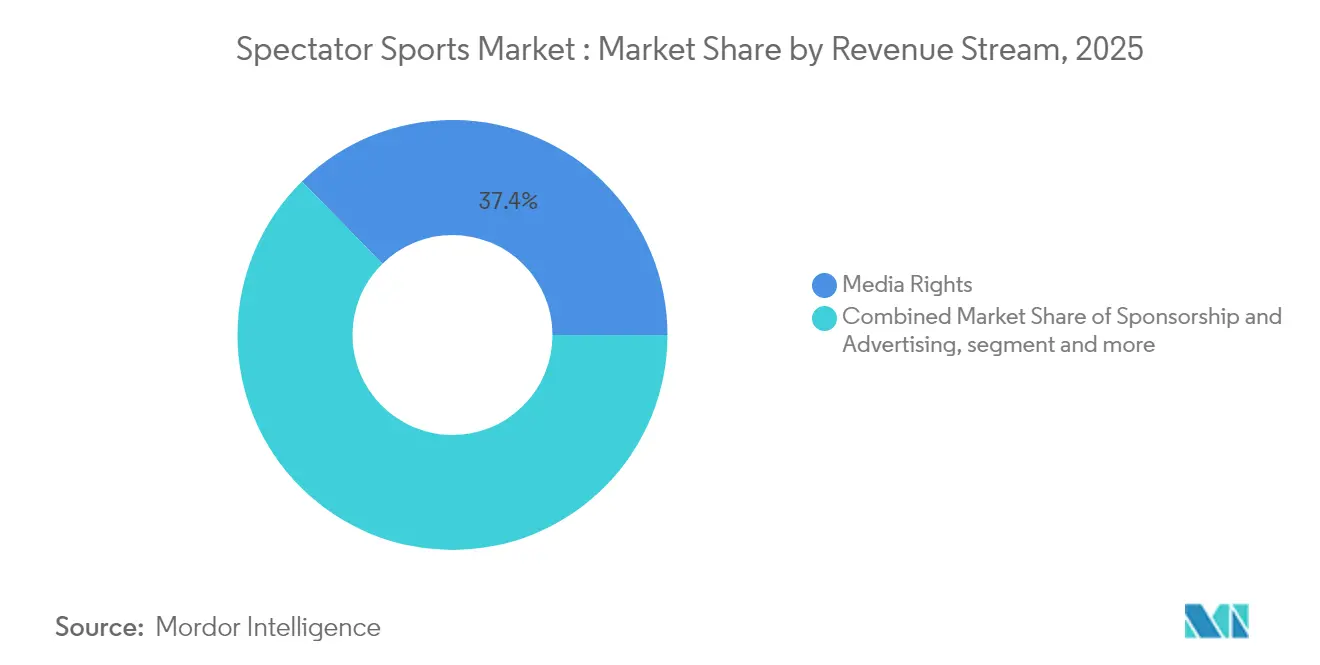
Media-rights dominance amid digital transformationIn 2025, media-rights revenues contributed 37.35% to the overall spectator sports market income, solidifying their position as a critical revenue driver. This growth is attributed to the increasing shift of cord-cutters toward platform bundles that prioritize live sports as high-value content. Sponsorship and advertising are projected to achieve a compound annual growth rate (CAGR) of 6.68% through 2031, supported by advancements in granular fan-data targeting and the integration of augmented-reality features within applications. In contrast, ticketing revenue growth is expected to lag behind inflation, as consumers increasingly favor premium, one-time experiences over frequent attendance. These trends highlight the evolving consumer preferences and the strategic focus on maximizing revenue streams within the spectator sports market.Merchandising is witnessing renewed momentum, driven by the adoption of rapid-print fulfillment centers that enable the on-demand production of customized jerseys within stadium premises.
This approach minimizes inventory risks and enhances operational efficiency by reducing stock obsolescence. Ancillary digital revenue streams, such as fan tokens and AI-powered content personalization subscriptions, are emerging as significant contributors to the market's growth. These innovations reflect the increasing monetization of data and the integration of technology to enhance fan engagement. Collectively, these developments underscore the expanding role of digital transformation in shaping the future trajectory of the spectator sports market.

By Sport Type:
Cricket’s rapid ascent reshapes hierarchiesIn 2025, football/soccer maintained its leadership position in the spectator sports market, capturing 38.40% of the market share due to its extensive global broadcast network. The sport's robust club ecosystems and deeply ingrained cultural significance further solidified its dominance. Cricket, however, is emerging as a high-growth segment, with an anticipated CAGR of 7.96%, driven by the Indian Premier League's (IPL) valuation of USD 16 billion. The expansion of the Twenty20 format, which aligns with the increasing demand for short-form, engaging content, is a key growth driver. These factors collectively position cricket as a dynamic force within the evolving spectator sports market.Baseball, facing stagnant national ratings, has implemented rule modifications such as pitch clocks to address concerns over game pacing.
These adjustments aim to enhance the viewing experience and sustain audience interest in a competitive market. Motorsports, on the other hand, are leveraging innovative strategies like city-center night races to attract younger demographics. Additionally, sponsorships from Gulf sovereign entities are enabling motorsports to expand their geographic reach and diversify their audience base. Together, these efforts are reshaping the spectator sports market by addressing shifting consumer preferences and regional growth opportunities.
Geography Analysis
North America Spectator Sports Market
North America, accounting for 42.55% spectator sports market share in 2025, benefits from entrenched franchise structures, high media-rights baselines, and mature stadium ecosystems. Streaming competition intensified when YouTube TV secured NFL Sunday Ticket, prompting incumbents to bundle multi-sport packages and parity-price mobile-only passes. Climate-neutral retrofits, including solar canopies and waste-heat recovery systems, attract municipal co-funding and ESG-minded sponsors, adding resilience to the spectator sports market.
APAC Spectator Sports Market
Asia-Pacific registers the fastest 7.39% CAGR through 2031, led by India’s target to scale its sports sector to USD 100 billion by 2027. The IPL streamed in eight languages and generated peak concurrency records on JioCinema, validating segmented-audience strategies. Japan pioneers mixed-reality signage and elder-friendly amenities, while South Korea’s esports heritage feeds cross-promotion into traditional leagues. Australia’s proposed ad ban presses broadcasters to diversify partner portfolios, but domestic women’s football successes drive grassroots participation. Southeast Asian federations leverage modular venues and public-private partnerships to host multisport events with lower capital risk, broadening spectator sports market penetration.
Europe and Africa Spectator Sports Market
Europe delivers consistent revenue through legacy football, rugby, and cycling, though regulatory shifts on gambling ads create short-term sponsorship gaps. Cross-border over-the-top subscriptions hedge domestic saturation; Bundesliga’s new match windows add Asia-Pacific prime-time slots, widening audience reach. Africa remains an expansion frontier: Nigeria’s youth population, mobile-first payments, and diaspora networks create a test bed for low-bandwidth live-stream models that bypass traditional infrastructure.
Mordor Intelligence provides coverage of the spectator sports market across other key regional markets, including Asia, Europe, and North America, each with their regulatory frameworks and demand patterns. Detailed country-level analysis extends to India and United Kingdom incorporating local coverage and market participation, as required.
Regulatory Landscape
Regulation in spectator sports is increasingly shaped by media-ownership scrutiny and broadcast licensing oversight. In the United States, Federal Communications Commission (FCC) actions affecting Disney-owned ABC stations, including an early license-renewal filing deadline of May 28, 2026 tied to an investigation into DEI-related policies, highlight how regulatory review can influence the operating environment for sports broadcasters that depend on affiliated local stations and national distribution.
Competition and governance frameworks also affect rights packaging and league economics. The U.S. Department of Justice reviewed the ESPN-NFL transaction after it was announced in August 2025, reflecting antitrust sensitivity around consolidation of premium live-sports channels and related distribution leverage. In global motorsports, Liberty Media-operated properties operate within formal governing-body structures, with the FIA setting technical and sporting regulations for Formula 1 and coordinating governance and financial arrangements under the 2026 Concorde Governance Agreement, while European and national competition laws continue to apply across multi-country rights sales and sponsorship arrangements.
Value Chain Analysis
The spectator sports value chain begins with rights creation by leagues, teams, and event owners, then moves through sanctioning bodies, production, distribution, and monetization. Rights holders package live games, highlights, and data, while governing bodies such as the FIA in Formula 1 and the FIM for MotoGP provide regulatory services that enable events to be staged and commercialized under standardized rules. Broadcasters and platforms convert these rights into subscription, advertising, and affiliate-fee revenue, and they increasingly bundle live sports with broader entertainment and connectivity offerings.
Vertical integration has intensified in distribution and commercialization. ESPN has pursued tighter control of premium football inventory through the acquisition of NFL Network and RedZone linear assets, alongside long-term NFL content licensing, while Comcast has combined broadband distribution (Xfinity) with sports programming via NBCUniversal and Sky Sports, strengthening leverage from access network to screen through its announced corporate separation. On the commercialization side, event operators and hospitality providers monetize attendance through ticketing, premium experiences, merchandising, and venue partnerships, with large rights owners and promoters using multi-event portfolios to sell cross-property sponsorships and to spread production and technology costs.
Competitive Landscape
The spectator sports market exhibits a fragmented structure, with the top five players collectively generating a substantial portion of the revenue, resulting in a significant concentration score. Traditional media conglomerates integrated vertically: TKO Group completed a USD 3.25 billion acquisition of IMG, On Location, and Professional Bull Riders, adding event operations and hospitality to its WWE and UFC content stable [4]. Technology-first entrants such as Amazon fuse streaming, e-commerce, and cloud analytics, creating moats that cross-sell Prime benefits. Clubs roll out on-demand jersey printing and predictive pricing to maximize game-day yield while dampening inventory write-offs.
Intellectual-property stewardship drives differentiation: Nike extended exclusive uniform deals with both the NBA (to 2037) and NFL (to 2038), locking in apparel visibility across physical and digital worlds. Data-rights negotiations intensify as leagues weigh selling anonymized player-tracking feeds to third-party analytics firms. Cybersecurity readiness becomes a competitive edge; operators with zero-trust streaming stacks record 35% faster post-outage recovery times, boosting fan loyalty metrics. Sovereign wealth and private-equity funds aim at youth-sports academies, health-tech tie-ins, and multi-use arenas, betting that diversified asset clusters insulate returns against single-league volatility within the spectator sports market.
Spectator Sports Industry Leaders
-
The Walt Disney Company (ESPN)
-
Comcast Corp (NBC Sports & Sky Sports)
-
Liberty Media Corp (Formula 1)
-
DAZN Group Ltd
-
Madison Square Garden Sports Corp
- *Disclaimer: Major Players sorted in no particular order
Spectator Sports Market Companies Covered in this Report
- The Walt Disney Company (ESPN)
- Comcast Corp (NBC Sports & Sky Sports)
- Liberty Media Corp (Formula 1)
- DAZN Group Ltd
- Madison Square Garden Sports Corp
- Manchester United PLC
- Real Madrid CF
- FC Barcelona
- Yankees Global Enterprises
- Dallas Cowboys Football Club Ltd
- Kroenke Sports & Entertainment
- City Football Group
- New England Patriots LP
- Tencent Holdings Ltd (Tencent Sports)
- Electronic Arts Inc (EA Sports Events)
- ESL FACEIT Group
- WWE – TKO Group
- UFC – TKO Group
- Board of Control for Cricket in India (IPL)
- Endeavor Group Holdings Inc
Market Opportunities and Future Outlook
Platform consolidation around live-sports inventory continues to create room for new bundled offerings, integrated distribution, and cross-platform ad products. A specific signal is ESPN acquiring NFL Network and RedZone assets in February 2026, in exchange for the NFL taking a 10% equity stake in ESPN. This structure blends content control with strategic alignment and supports more integrated programming, advertising, and subscription bundling across linear and direct-to-consumer surfaces.
Corporate restructuring and long-duration commercial-rights agreements are also broadening the opportunity set for specialized investors and operators across media rights, production services, and international distribution. Comcast initiated a corporate separation on June 29, 2026 to spin off NBCUniversal and Sky into an independent public company within one year, which could reshape how rights are negotiated and distributed across Peacock, Sky, and partner ecosystems. In motorsports, the 2026 Concorde Agreement (covering the 2026-2030 period) and Liberty Media’s commercial rights for Formula 1 through 2110, alongside MotoGP commercial rights granted by the FIM through December 31, 2060, reinforce franchise-style revenue models that can be scaled through global calendars, premium hospitality, and region-specific media packages.
Recent Industry Developments in Spectator Sports Market
- February 2026: Liberty Media completes MotoGP acquisition, describing 2025 as a year of strengthening Formula 1's growth trajectory. The acquisition strengthens cross-portfolio marquee-entertainment and sports assets; potential uplift in F1-related media rights and sponsorship monetization.
- November 2025: NBCUniversal signs a three-year MLB media-rights deal including Sky Sports UK/Ireland rights and Peacock integration. Deepens streaming and international distribution reach; potential to shift fan engagement and advertising yields across platforms.
- August 2025: The Walt Disney Company ESPN launches a new direct-to-consumer service and enhanced ESPN App. Strengthens ESPN’s direct monetization and subscriber retention; potential for higher in-app advertising and bundle monetization.
Spectator Sports Market Report Scope and Research Methodology
Market Definition and Coverage
This market is sized as the total revenue generated from spectator sports events and leagues, including in-venue attendance and paid viewing through broadcast and streaming, plus related commercial income that is directly tied to the events.
Scope exclusions: We exclude sporting goods manufacturing, general sports apparel retail, and non-event fitness activities that do not depend on spectatorship revenue.
Segments Covered in This Report
- By Revenue Stream
- Ticket Sales
- Media Rights
- Sponsorship & Advertising
- Merchandising & Licensing
- Other Ancillary Revenues
- By Sport Type
- Football / Soccer
- Basketball
- Baseball
- Cricket
- Motorsports
- Tennis
- Golf
- Other Sports
- By Geography (Value)
- North America
- United States
- Canada
- Mexico
- South America
- Brazil
- Peru
- Chile
- Argentina
- Rest of South America
- Europe
- United Kingdom
- Germany
- France
- Spain
- Italy
- BENELUX
- NORDICS
- Rest of Europe
- Asia-Pacific
- India
- China
- Japan
- Australia
- South Korea
- South-East Asia
- Rest of Asia-Pacific
- Middle East and Africa
- United Arab Emirates
- Saudi Arabia
- South Africa
- Nigeria
- Rest of Middle East and Africa
- North America
Data Sources, Market Sizing, and Validation
Desk Research
Desk work starts by mapping how money flows in spectator sports, so later assumptions for media rights, sponsorship, and ticketing can be checked against real-world signals. We pull foundational data from public bodies and well-known references such as the US Bureau of Economic Analysis (Arts, Entertainment, and Recreation series), US Census Business Patterns for industry structure, and International Labour Organization indicators that help explain labor and employment shifts in entertainment.
To cross-check international activity, we also review sources such as World Bank macro series (income and consumer spend proxies), OECD statistics for service sector context, and international trade and tourism dashboards where relevant for event travel demand. On top of that, we use company filings, annual reports, investor decks, league and federation websites, and reputable business press to verify deal announcements, season calendars, and pricing signals. Select paid subscriptions for company financials and news, plus patent databases for venue and broadcast-related innovation signals, are used to fill gaps where public disclosure is thin. The desk sources listed here are illustrative, since many other public documents and datasets were also consulted for collection, validation, and clarification.
Primary Interviews and Surveys
Primary work is used to pressure-test the desk assumptions around rights fees, sponsorship rate cards, average ticket yields, and the split between physical attendance and digital viewing. We spoke with a mix of rights holders, venue and event operations participants, agencies, and commercial partners across major regions so the model reflects differences in seasonality, audience monetization, and contract cycles. Input from these discussions was then used to confirm what is counted as spectator sports revenue versus adjacent entertainment income, and to align the final numbers with how stakeholders report performance.
Distribution of primary research fieldwork respondents
| Company type | Respondent position | Region |
|---|---|---|
| Top tier: 29% | CXOs: 14% | APAC: 41% |
| Mid tier: 57% | Functional/Unit leaders: 32% | EMEA: 35% |
| Smaller Players: 14% | Managers: 54% | Americas: 24% |
Market-Sizing & Forecasting
Sizing is built using a top-down model where overall spectator sports revenue is reconstructed from the main money pools that can be tracked year to year, and then allocated by geography based on reported activity and demand signals. We then corroborate totals using selective bottom-up approximations, such as sampling ticket price bands against attendance levels, checking known media-rights contract values over their term, and validating sponsorship and merchandising intensity through public disclosures.
Key inputs that shape the model include event attendance and venue utilization patterns, media-rights fee progression and renewal timing, subscription and streaming uptake for live sports, sponsorship load and ad inventory yield, and per-capita fan spending on licensed merchandise. Where gaps exist, we use proxy indicators (for example, comparable league calendars, venue capacity, and disclosed pricing changes) and then adjust after expert feedback so the estimates remain realistic.
Forecasting is done using scenario analysis supported by multivariate regression on the variables above, since rights cycles and pricing shifts can create step changes that a simple trend line would miss. Assumptions are finalized only after the model behavior matches what respondents describe for near-term renewals, demand elasticity, and the pace of digital monetization.
Data Validation & Update Cycle
Validation happens in layers, starting with internal checks that reconcile revenue splits to the total and flag unusual jumps by region or revenue stream. We compare outputs against independent signals such as disclosed contract renewals, major event schedules, venue expansion timelines, and macro demand context, and then re-check any variance that cannot be explained by a clear driver.
Before sign-off, the model is reviewed by another analyst to confirm definitions, conversions, and assumption logic are consistent across years. Reports are refreshed annually, and interim updates are triggered when material events occur, such as major rights auctions, regulatory changes tied to monetization, or a sharp demand shift. Right before delivery, a fresh pass is completed so clients receive the most current view available.
Mordor Intelligence's Spectator Sports Market Size Compared With Other Published Estimates
Published market sizes for spectator sports often vary because the boundary between core event-linked revenue and adjacent entertainment income is not drawn the same way, and because media-rights contracts can be treated differently across years. Differences also come from how firms handle currency conversion timing, which matters in a global market where rights and sponsorship deals may be priced in different currencies.
The biggest gap drivers usually show up in refresh cadence and the mechanics behind average revenue per fan and media yield. Some estimates apply a smooth price curve to tickets and sponsorship, while others allow for step-ups tied to contract renewal dates and major event years, which can move the current-year number noticeably. By re-checking currency timing at the year level and re-validating rights and sponsorship assumptions when large renewals are announced, the refresh cycle and ASP logic used by Mordor Intelligence reduces drift from real contract and attendance signals.
Benchmark comparison
| Source | Market Size | Gaps in Research Methodology |
|---|---|---|
| Mordor Intelligence | USD 184.41 B (2025) | |
| Global Consultancy A | USD 178.90 B (2025) | Uses a narrower revenue capture that appears to undercount merchandising and certain ancillary event-linked income, and applies a single conversion timing that can compress regions with weaker currencies. |
| Industry Association B | USD 205.60 B (2025) | Likely includes broader sports entertainment categories and mixed event revenues, and may apply optimistic yield per attendee and sponsorship load assumptions without reconciling to renewal calendars. |
The spread across the three numbers is mainly explained by what gets counted as event-driven revenue, and whether pricing and rights values are updated when renewal evidence emerges. When the model steps are tied to clear revenue streams and checked against contract and attendance signals, the resulting size stays easier to reproduce and simpler to defend on a client call.
Key Questions Answered in the Report
What is the current size of the spectator sports market?
The spectator sports market is valued at USD 196.8 billion in 2026 and is projected to reach USD 272.43 billion by 2031.
Which revenue stream contributes the most to industry earnings?
Media rights dominate with 37.35% of revenue in 2025, reflecting sustained demand for exclusive live content.
Why is cricket the fastest-growing sport type?
Cricket benefits from the Indian Premier League’s digital-first model, which supports an 7.96% CAGR forecast through 2031.
Which region shows the highest growth potential?
Asia Pacific is expected to grow at 7.39% CAGR to 2031, thanks to India’s rapid industry expansion and rising digital viewership.
How do blockchain fan tokens generate new revenue?
Token issuances provide upfront cash and grant fans voting rights on team matters; FC Barcelona sold USD 1.3 million worth in two hours.
What recent mergers are reshaping the landscape?
TKO Group’s USD 3.25 billion acquisition of IMG, On Location, and Professional Bull Riders broadened its live-event portfolio in 2025.