
India Solid Waste Management Market Size and Share
Market Overview
| Study Period | 2020 - 2031 |
|---|---|
| Forecast Data Period | 2026 - 2031 |
| Base Year Market Size (2025) | USD 13.58 Billion |
| Market Size (2026) | USD 14.29 Billion |
| Market Size (2031) | USD 18.94 Billion |
| Growth Rate (2026 - 2031) | 5.80 % |
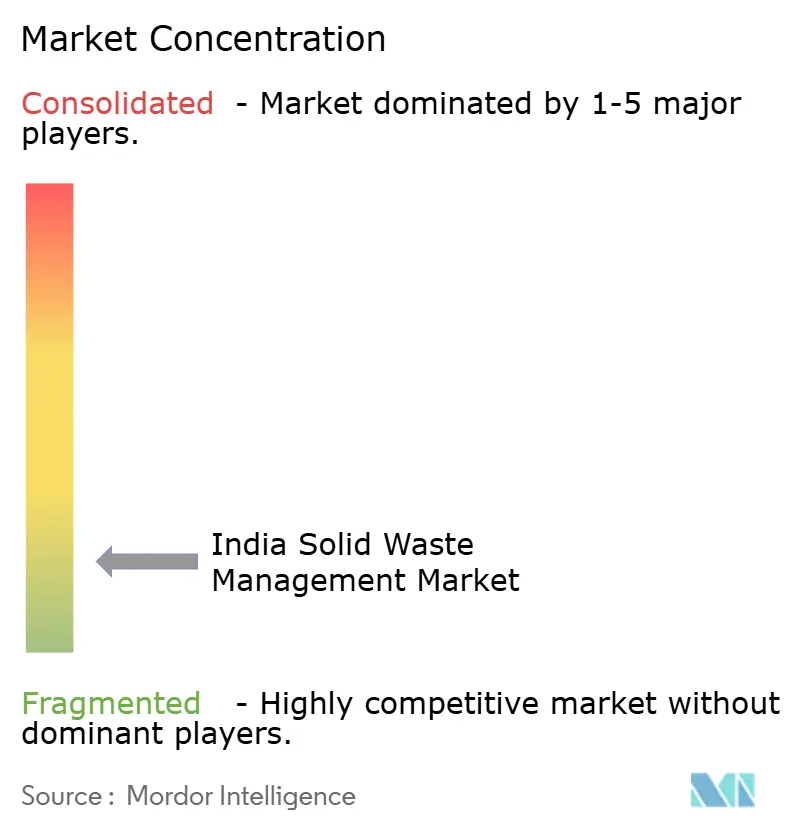
| Market Concentration | Low |
Major Players *Disclaimer: Major Players sorted in no particular order Image © Mordor Intelligence. Reuse requires attribution under CC BY 4.0. | |
India Solid Waste Management Market Analysis by Mordor Intelligence
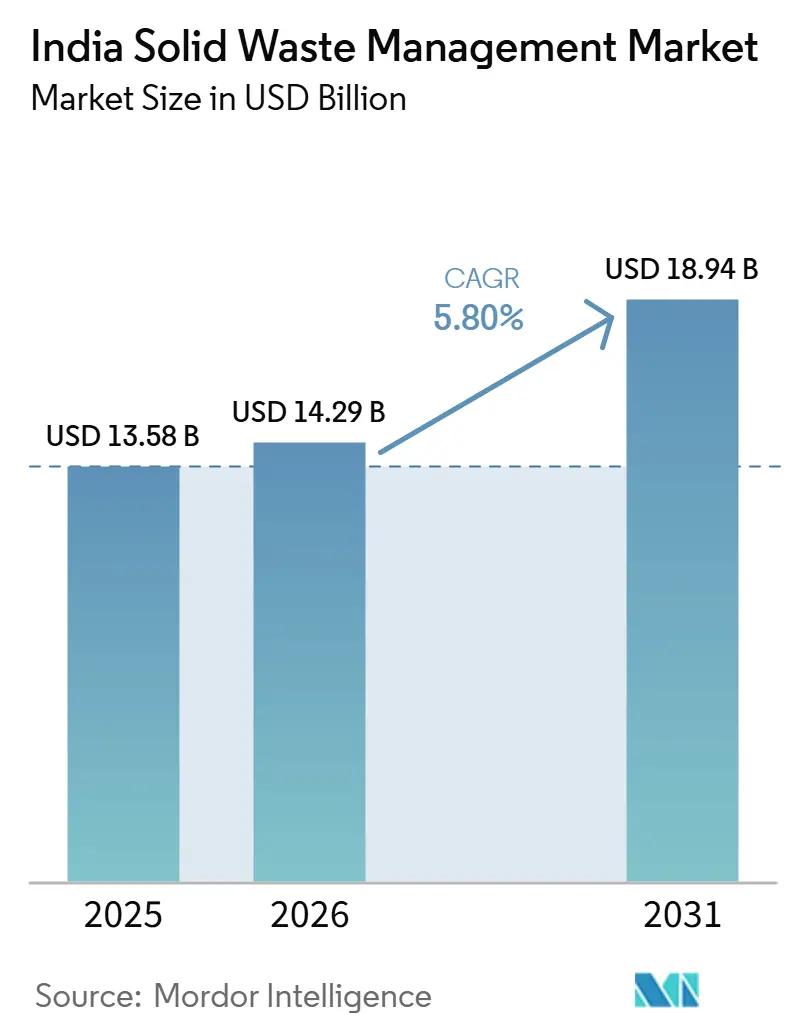
The India Solid Waste Management Market size was valued at USD 13.58 billion in 2025 and is estimated to grow from USD 14.29 billion in 2026 to reach USD 18.94 billion by 2031, at a CAGR of 5.80% during the forecast period (2026-2031).
India’s solid waste management market is evolving in response to stricter source-segregation requirements, rising urban waste volumes, and continued investment in collection and processing infrastructure. The transition toward multi-stream source segregation is increasing demand for dedicated collection systems, material recovery facilities, treatment solutions, and compliance-tracking capabilities. Rising waste generation in Tier-II and Tier-III cities is also driving the need for formal collection networks and additional processing capacity. These trends favor operators that offer integrated municipal contracts covering collection, transportation, processing, and reporting, rather than standalone waste-handling services. However, the substantial volume of legacy waste and persistent gaps in municipal cost recovery continue to constrain the pace of infrastructure development and reduce project bankability in several cities.
Key Report Takeaways
- By service type, collection services held 46% of the India solid waste management market share in 2025, while recycling and material recovery are forecast to grow at an 8.9% CAGR through 2031.
- By waste type, municipal solid waste accounted for 54% of the India solid waste management market share in 2025, while medical waste is forecast to grow at a 10.5% CAGR through 2031.
- By source, residential sources represented 57% of market share in 2025, while industrial sources are forecast to grow at a 9.4% CAGR through 2031.
Note: Market size and forecast figures in this report are generated using Mordor Intelligence’s proprietary estimation framework, updated with the latest available data and insights as of January 2026.
India Solid Waste Management Market Trends and Insights
Drivers Impact Analysis*
| Driver | (~) % Impact on CAGR Forecast | Geographic Relevance | Impact Timeline |
|---|---|---|---|
| Swachh Bharat Mission 2.0 Accelerating Scientific Municipal Waste Processing | +1.4% | National, with intensified attention to million-plus cities | Medium term (2-4 years) |
| Source Segregation and Door-to-Door Collection Expanding Organized Waste Services | +1.1% | National, strongest in Tier-I metros and compliant Tier-II cities | Short term (≤ 2 years) |
| Rapid Urbanization and Tier II & Tier III City Expansion Increasing Municipal Waste Generation | +0.9% | All regions, with the largest volume additions in North and West India | Long term (≥ 4 years) |
| Extended Producer Responsibility (EPR) Regulations Driving Plastic and Packaging Waste Collection | +0.7% | National, with activity concentrated in Maharashtra, Gujarat, Tamil Nadu, and Uttar Pradesh | Medium term (2-4 years) |
| Growing Waste-to-Energy and Bio-CNG Projects Under National Renewable Energy Initiatives | +0.5% | WtE projects in million-plus cities and Bio-CNG projects in Tier-II and rural clusters | Medium term (2-4 years) |
| Smart City Mission Fueling Adoption of Digital Waste Collection and Smart Bin Infrastructure | +0.3% | 100 designated Smart Cities, including Surat, Visakhapatnam, and Bhopal | Short term (≤ 2 years) |
| Source: Mordor Intelligence | |||
Swachh Bharat Mission 2.0 Accelerating Scientific Municipal Waste Processing
Swachh Bharat Mission Urban 2.0 has shifted municipal programs toward scientific waste processing. Urban waste processing capacity rose from 16% to 80.17% of generated municipal solid waste since the mission began. Approved projects worth INR 10,228 crore (USD 1,173.8 million) cover 2,484 urban local bodies. The program also provides INR 550 per ton (USD 6.3 per ton) of central financial assistance for bioremediation through the Dumpsite Remediation Accelerator Programme.[1]Ministry of New and Renewable Energy, “MNRE Notifies Revised Guidelines for Waste-to-Energy Projects to Enhance Performance Monitoring and Speedier CFA Disbursal,” Press Information Bureau, pib.gov.in Cities must prepare action plans that identify their capacity gaps and create a more visible pipeline of tenders. The India solid waste management market benefits when these plans move collection, treatment, and disposal projects into formal procurement. The Urban Infrastructure Development Fund provides INR 10,000 crore (USD 1,147.7 million) each year in loan-based financing for Tier-II and Tier-III cities.[2]Ministry of Housing and Urban Affairs, “Business Models and Economic Assistance for Municipal Solid Waste Projects,” SBM Urban Technical Advisory, sbmurban.org
Source Segregation and Door-to-Door Collection Expanding Organized Waste Services
Door-to-door collection reached 97% of Indian cities under Swachh Bharat Mission Urban 2.0.[3]NITI Aayog, “Scenarios Towards Viksit Bharat and Net Zero, Sectoral Insights, Waste,” NITI Aayog, niti.gov.in The Solid Waste Management Rules, 2026, require waste generators to separate wet, dry, sanitary, and special-care waste. The rules also apply the Polluter Pays principle to noncompliance. More reliable segregation can reduce contamination at material recovery facilities, composting plants, and biomethanation units. This improves the value of material delivered to processors without requiring a comparable increase in waste volume. Higher-quality segregated waste also increases recycling efficiency, improves compost quality, and enhances biogas yields, enabling operators to achieve better resource recovery and revenue generation. The stricter regulatory framework is encouraging municipalities to adopt digital waste tracking, performance-based collection contracts, and mechanized sorting infrastructure to improve compliance and operational efficiency. Growing enforcement of source segregation requirements is also creating opportunities for private waste management companies to expand collection, transportation, processing, and recycling services across urban centers.
Rapid Urbanization and Tier II & Tier III City Expansion Increasing Municipal Waste Generation
India municipal solid waste generation is projected to rise from 55 million tons annually to 165 million tons by 2030. The additional volume is increasingly associated with Tier-II and Tier-III cities. The Economic Survey 2025-26 and the Union Budget 2026-27 directed attention toward these urban centers. These cities often have fewer established treatment assets and smaller formal service networks. Their needs can support decentralized processing and new collection arrangements. Municipal authorities are therefore increasing investments in transfer stations, material recovery facilities, composting plants, and waste-to-energy infrastructure to improve collection efficiency and reduce reliance on landfills. The growing participation of private operators through public-private partnership (PPP) models is also helping bridge infrastructure gaps and expand organized waste management services in emerging urban centers. These trends are expected to strengthen long-term demand for integrated collection, transportation, processing, and resource recovery services across the India Solid Waste Management Market.
Extended Producer Responsibility Regulations Driving Plastic and Packaging Waste Collection
Extended producer responsibility is increasing the demand for registered recycling services. The Plastic Waste Management Amendment Rules, 2025, require producers, importers, and brand owners to register and report through the centralized EPR portal. The C&D Waste Management Rules, 2025, extend EPR requirements to qualifying construction projects. Developers with more than 20,000 square meters of built-up area must meet recycling targets that rise from 25% in 2025-26 to 100% by 2028-29. Traceable processing and valid certification are becoming more important for waste handlers. This favors operators that can document material flows and meet compliance requirements in the India solid waste management market.
Restraints Impact Analysis*
| Restraint | (~) % Impact on CAGR Forecast | Geographic Relevance | Impact Timeline |
|---|---|---|---|
| High Dependence on Open Dumping and Legacy Landfills Across Urban Local Bodies | -1.1% | National, with greater pressure in Tier-II and Tier-III cities | Long term (≥ 4 years) |
| Poor Source Segregation Compliance Reduces Recycling Efficiency | -0.8% | National, especially in metropolitan cities with more than 5 million residents | Medium term (2-4 years) |
| Municipal Financial Constraints Delaying Modern Infrastructure | -0.6% | National, most acute in urban local bodies with fewer than 1 million residents | Long term (≥ 4 years) |
| Informal Collection Networks Limiting Organized Sector Penetration | -0.4% | National, particularly in Delhi, Mumbai, Kolkata, and Bengaluru | Long term (≥ 4 years) |
| Source: Mordor Intelligence | |||
High Dependence on Open Dumping and Legacy Landfills Across Urban Local Bodies
Legacy waste remains a major constraint on formal waste processing. India had 2,452 active dumpsites in 2025, covering more than 17,000 acres and holding 250 million tons of untreated legacy waste. A NITI Aayog assessment states that a significant share of the country's solid waste still reaches open dumpsites due to inadequate processing infrastructure. Low-cost dumping weakens the economic case for material recovery and waste-to-energy projects. It can also limit the tipping fees available to private operators. The continued diversion of waste to unmanaged dumpsites reduces the availability of quality feedstock for recycling, composting, and biomethanation facilities, affecting plant utilization and project economics. At the same time, large-scale legacy waste remediation initiatives are creating opportunities for biomining, landfill reclamation, scientific landfill closure, and engineered waste processing technologies. The remediation program is an important response, but 44% of legacy waste remains unremediated in 2025. This condition is likely to remain relevant during the forecast period.
Poor Source Segregation Compliance Reduces Recycling Efficiency
Source segregation policy coverage has expanded faster than implementation. A 2024 Centre for Science and Environment assessment found that 59% of surveyed cities effectively enforced waste segregation and transported segregated waste for treatment. In the same assessment, citizen feedback indicated that practical implementation was in place in 32% of cities. Mixed waste reduces the quality of inputs for recycling, composting, and waste-to-energy plants. The 2026 rules introduce digital monitoring to strengthen enforcement. Yet many urban local bodies still need staff capacity and sustained local enforcement. This limits efficiency gains that would otherwise support the India solid waste management market.
*Our forecasts treat driver/restraint impacts as directional, not additive. The impact forecasts reflect baseline growth, mix effects, and variable interactions.
Segment Analysis
By Service Type: Collection Leads Revenue, and Recycling Expands Faster
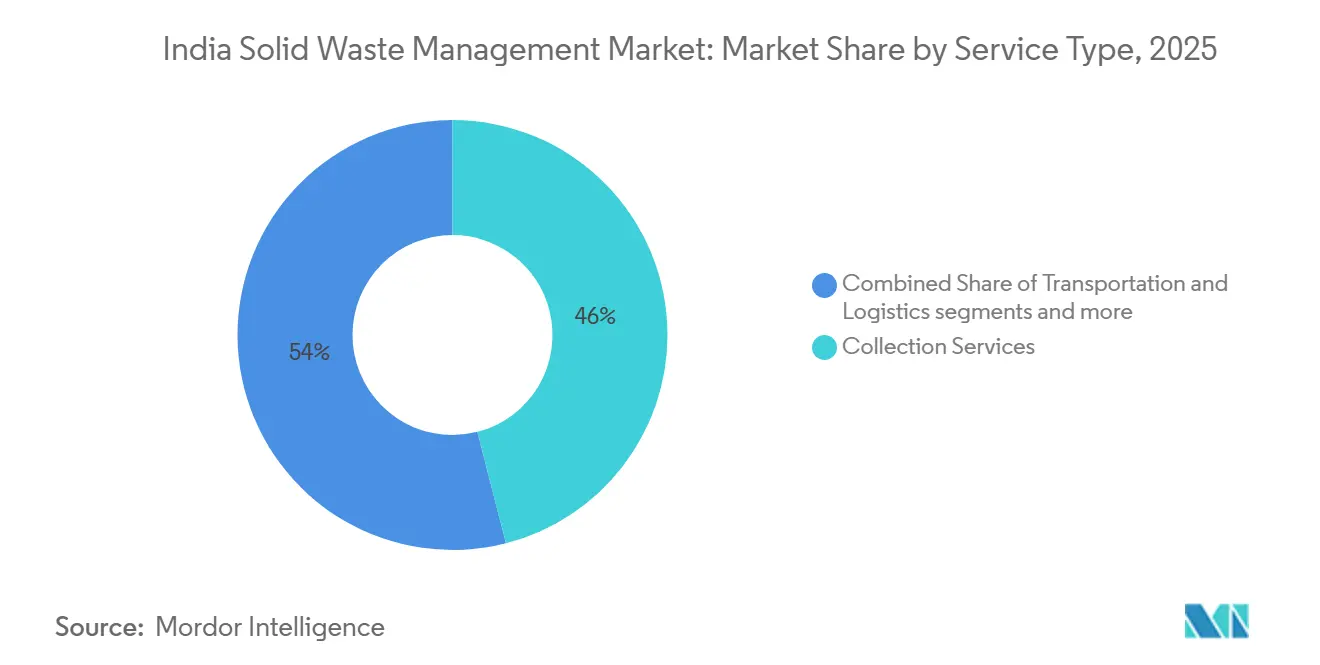
Collection Services held 46% of the India solid waste management market share in 2025. The door-to-door collection requirement under Swachh Bharat Mission Urban 2.0 supports the segment. Collection contracts also provide recurring service revenue for municipal and private operators. Transportation and logistics are developing alongside collection, as GPS monitoring, fleet management, and route planning become routine tender requirements. Treatment and disposal services are moving away from unscientific disposal sites toward engineered sanitary landfill systems. These changes support broader service integration in India's solid waste management market.
Recycling and Material Recovery is forecast to record an 8.9% CAGR from 2026 to 2031. EPR obligations and the 2026 rules support the recovery of usable materials before disposal. The segment can benefit from improved source separation, as higher-quality inputs reduce processing losses. Waste-to-energy operations provide long-duration revenue visibility through 20-year concession arrangements. India had 11 operational waste-to-energy plants in 2025, with a design capacity of 14,200 tons per day and 160 MW of generation capacity. More than 10 additional plants were under construction nationally in 2025.



By Waste Type: Municipal Solid Waste Leads and Medical Waste Grows Fastest
Municipal solid waste accounted for 54% of the India solid waste management market share in 2025. This reflects the central role of urban local bodies in collection, processing, and disposal arrangements. Packaged goods are increasing the share of nonbiodegradable materials in municipal waste in secondary cities. This change raises processing needs for systems that previously relied mainly on composting. Industrial waste is the second-largest waste category and is subject to the Extended Bulk Waste Generator Responsibility for generators producing more than 100 kilograms per day. Hazardous waste remains governed by separate pollution-control requirements and manifest tracking.
Medical waste is forecast to expand at a 10.5% CAGR from 2026 to 2031. Healthcare facilities, diagnostic laboratories, and primary health centers are increasing the need for authorized treatment capacity. Medical waste handling also requires specialized treatment and incineration infrastructure. Construction and demolition waste exceeds 100 million tons annually and is subject to new recycling requirements. Agricultural waste is receiving attention through GOBARdhan-linked Bio-CNG projects that use crop residue and cattle dung. These developments broaden the service mix of the Indian solid waste management industry.
By Source: Residential Sources Lead Revenue, While Industrial Sources Grow Faster
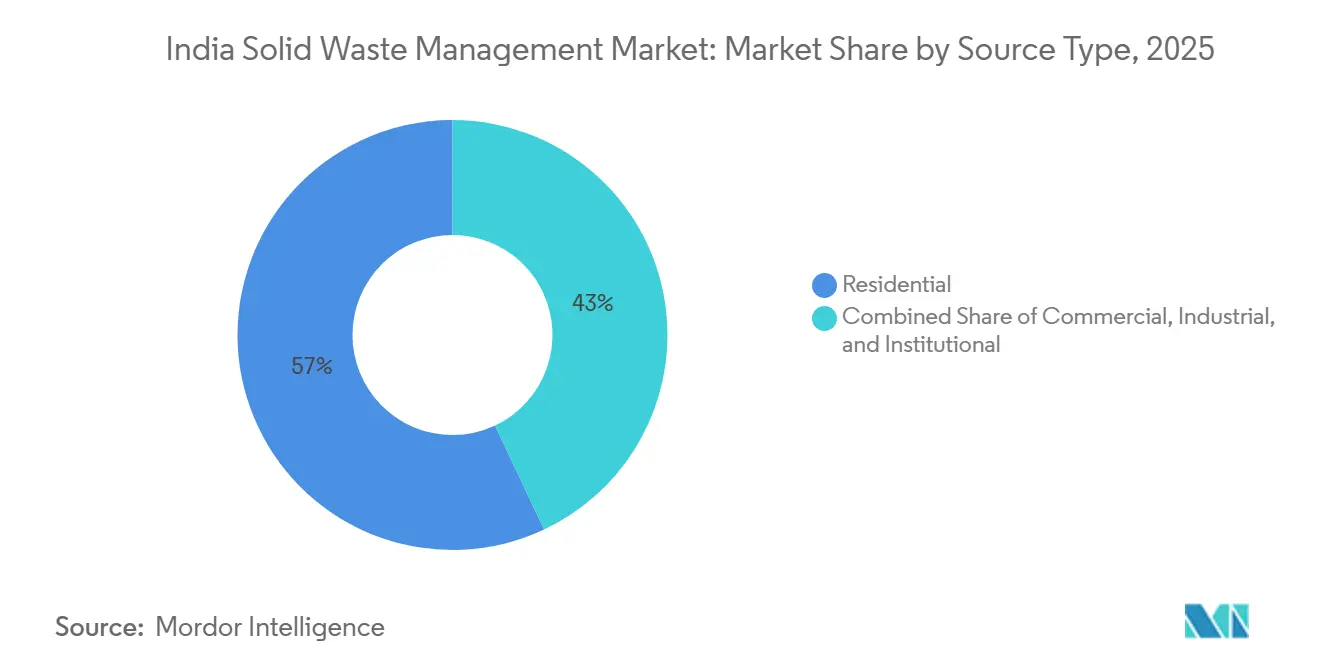
Residential sources accounted for 57% of the India solid waste management market share in 2025. Urban household waste streams form the largest stable base for municipal collection contracts. Door-to-door collection coverage of 97% of cities has brought more residential material into formal systems. Processing margins can remain narrow, but collection volumes provide consistency. Commercial sources include retail sites, hospitality properties, restaurants, and mixed-use developments. Their greater waste density can support user fees under the bulk waste generator provisions of the 2026 rules.
Industrial sources are forecast to grow at a 9.4% CAGR from 2026 to 2031. Organized manufacturing clusters are increasing industrial waste volumes in Gujarat, Maharashtra, Rajasthan, and Tamil Nadu. The new Extended Bulk Waste Generator Responsibility provisions strengthen tracking requirements for larger generators. Institutional sources include government facilities, educational institutions, airports, ports, railways, special economic zones, and public landowners. Operators that aggregate commercial, industrial, and institutional volumes can support localized pre-processing facilities. This can create an operational advantage over providers focused solely on residential collection.
Geography Analysis
Western India has a substantial share of organized waste management activity because of urban density, established public-private partnership structures, and industrial waste generation. Maharashtra, Gujarat, and Rajasthan remain important locations for large municipal and industrial contracts. The Nagpur Bhandewadi project is designed to process 1,200 metric tons of municipal solid waste each day through a public-private partnership.
Southern India has several advanced municipal waste operations. Smart Cities Mission investments have supported technology adoption in cities including Surat, Visakhapatnam, and Chennai. Chennai operated 850 electric vehicles under a long-term collection-and-transportation concession in 2025. Tamil Nadu is important for registered plastic processors and biomedical waste facilities because of its manufacturing base. Bengaluru’s 2025 retendering of integrated solid waste management indicates that established private-participation systems also require periodic infrastructure upgrades.
Northern and Eastern India have substantial unmet needs for segregation, collection fleets, and processing assets. Delhi’s municipal corporation targeted 90% source segregation by December 2028. Uttar Pradesh has several Bio-CNG projects at the commissioning stages in Prayagraj, Ghaziabad, Gorakhpur, and Lucknow. Eastern states remain at an earlier stage of formalization. Loan-based support through the Urban Infrastructure Development Fund can enable early private investment in these cities. This makes secondary cities important to the future of India's solid waste management market.
Competitive Landscape
The India solid waste management market exhibits a low level of market concentration. Integrated national operators compete with many regional providers for municipal contracts. Technology is a key area of differentiation in tenders. Operators are using GPS-monitored collection, route optimization, weighbridge data, and certified material recovery processes. These capabilities can reduce lifecycle operating costs and improve reporting quality. Electric collection vehicles are becoming more common in long-term municipal contracts.
Companies are also seeking technology partnerships for hazardous waste handling, sludge removal, and waste-to-energy engineering. Re Sustainability Limited signed a memorandum of understanding with Janyu Technologies in February 2026 to deploy remotely operated robotic systems for hazardous waste handling and sludge removal. Antony Waste Handling Cell’s subsidiary, AG Enviro Infra Projects, secured two municipal solid waste collection and transportation contracts from the Brihanmumbai Municipal Corporation in December 2025, valued at INR 1,330 crore (USD 152.64 million) over seven years. Its subsidiary, Antony Lara Enviro Solutions, also received a 10-year pre-processing contract from the Thane Municipal Corporation for INR 330 crore (USD 37.87 million). These awards show the value of proven capabilities in large municipal procurement.
EPR compliance services are another area of competition. The India solid waste management market rewards certified operators that can meet portal registration, chain-of-custody, and reporting requirements. The 2026 solid waste rules and the 2025 construction and demolition waste rules raise the importance of compliant processing facilities. Antony Waste’s subsidiary secured contracts for two 15 MW waste-to-energy plants in Andhra Pradesh in August 2025, worth INR 3,200 crore (USD 367.25 million) over 20 years. Banyan Nation secured development-finance funding for a 12,000-ton-per-year plastic recycling facility in Karnataka in 2025. The available information does not provide combined market shares for the leading companies, so a numerical concentration score cannot be supported.
India Solid Waste Management Industry Leaders
Re Sustainability Ltd.
Antony Waste Handling Cell Ltd.
BVG India Ltd.
JBM Enviro Pvt. Ltd.
Blue Planet Environmental Solutions Pvt. Ltd.
- *Disclaimer: Major Players sorted in no particular order

Recent Industry Developments
- February 2026: BPCL-Kochi Refinery commissioned a CBG plant at Brahmapuram to process 150 tons of biodegradable waste daily, generating 5.60 tons of biogas and 28 tons of solid bio-fertilizer at full capacity.
- February 2026: Re Sustainability Limited signed an MoU with Janyu Technologies to deploy remotely operated robotic systems for hazardous waste handling and sludge removal, targeting new industrial and biomedical waste contract opportunities.
- December 2025: Antony Waste Handling Cell’s subsidiary AG Enviro Infra Projects secured two MSW collection and transportation contracts from the Brihanmumbai Municipal Corporation worth INR 1,330 crore (USD 152.64 million), individually INR 684 crore (USD 78.5 million) and INR 646 crore (USD 74.14 million), over a seven-year concession.


India Solid Waste Management Market Report Scope
The India Solid Waste Management Market is Segmented by Service Type (Collection Services, Transportation & Logistics, Recycling & Material Recovery, Treatment & Disposal, and More), by Waste Type (Municipal Solid Waste, Industrial Waste, Hazardous Waste, Agricultural Waste, and More), and by Source (Residential, Commercial, Industrial, and Institutional). The Market Forecasts are Provided in Terms of Value (USD).
| Collection Services |
| Transportation & Logistics |
| Recycling & Material Recovery |
| Treatment & Disposal |
| Waste-to-Energy |
| Others |
| Municipal Solid Waste |
| Industrial Waste |
| Hazardous Waste |
| Construction & Demolition Waste |
| Agricultural Waste |
| Medical Waste |
| Others |
| Residential |
| Commercial |
| Industrial |
| Institutional |
| By Service Type | Collection Services |
| Transportation & Logistics | |
| Recycling & Material Recovery | |
| Treatment & Disposal | |
| Waste-to-Energy | |
| Others | |
| By Waste Type | Municipal Solid Waste |
| Industrial Waste | |
| Hazardous Waste | |
| Construction & Demolition Waste | |
| Agricultural Waste | |
| Medical Waste | |
| Others | |
| By Source | Residential |
| Commercial | |
| Industrial | |
| Institutional |


Key Questions Answered in the Report
What is the value of India solid waste management sector in 2026?
The India solid waste management market size is estimated at USD 14.29 billion in 2026. It is forecast to reach USD 18.94 billion by 2031 as collection, processing, and compliance requirements expand.
What is the forecast growth rate through 2031?
The India solid waste management market is forecast to grow at a 5.8% CAGR from 2026 to 2031. Urban growth, regulatory changes, and infrastructure investment support the forecast.
Which service category generated the largest revenue in 2025?
Collection Services led with 46% of revenue in 2025. Door-to-door collection coverage and municipal service contracts give this category a large recurring operating base.
Which waste type is expanding the fastest?
Medical waste is forecast to expand at a 10.5% CAGR through 2031. Rising treatment needs from healthcare facilities and diagnostic laboratories support the need for specialized, authorized treatment capacity.
Which waste source is forecast to grow the fastest?
Industrial sources are forecast to grow at a 9.4% CAGR from 2026 to 2031. Expanded tracking requirements and organized manufacturing clusters support the India solid waste management market.
Which regulations are changing waste operations in 2026?
The Solid Waste Management Rules, 2026, require four-stream segregation and strengthen compliance requirements for waste generators. The construction and demolition waste rules also increase recycling responsibilities for qualifying developers.
Page last updated on:


 Your data is secure and never sold or shared.


