Market Overview
| Study Period | 2021 - 2031 |
|---|---|
| Forecast Data Period | 2026 - 2031 |
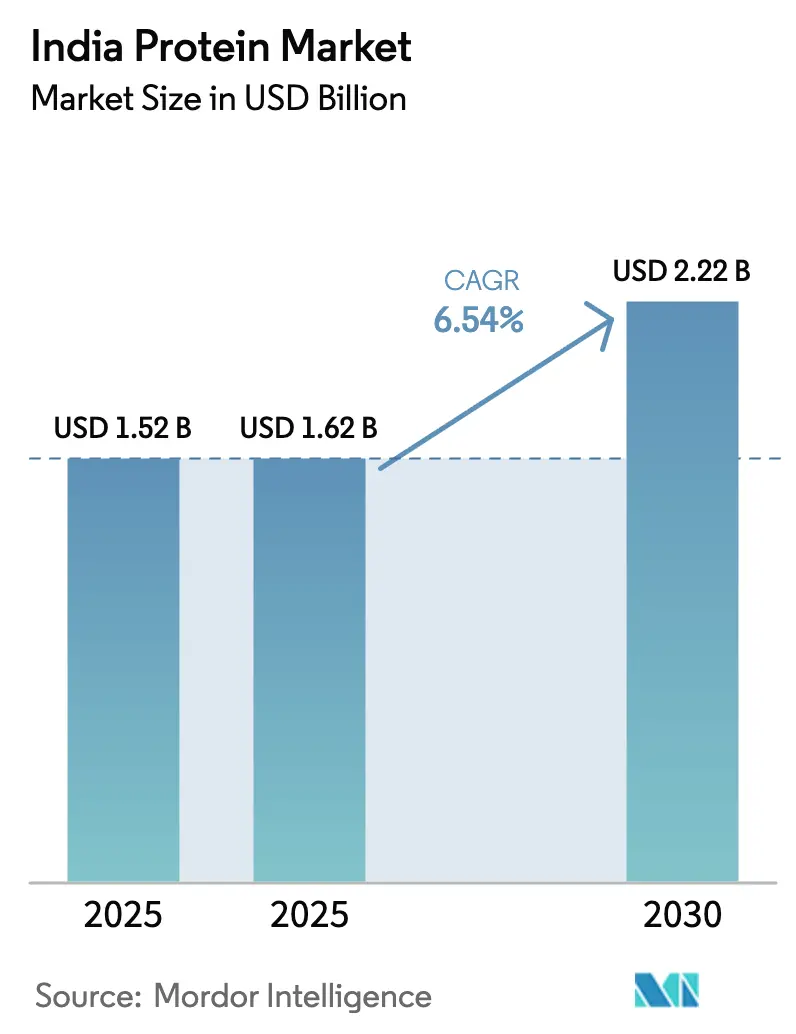
| Base Year Market Size (2025) | USD 1.52 Billion |
| Market Size (2025) | USD 1.62 Billion |
| Market Size (2030) | USD 2.22 Billion |
| Growth Rate (2026 - 2031) | 6.54% CAGR |
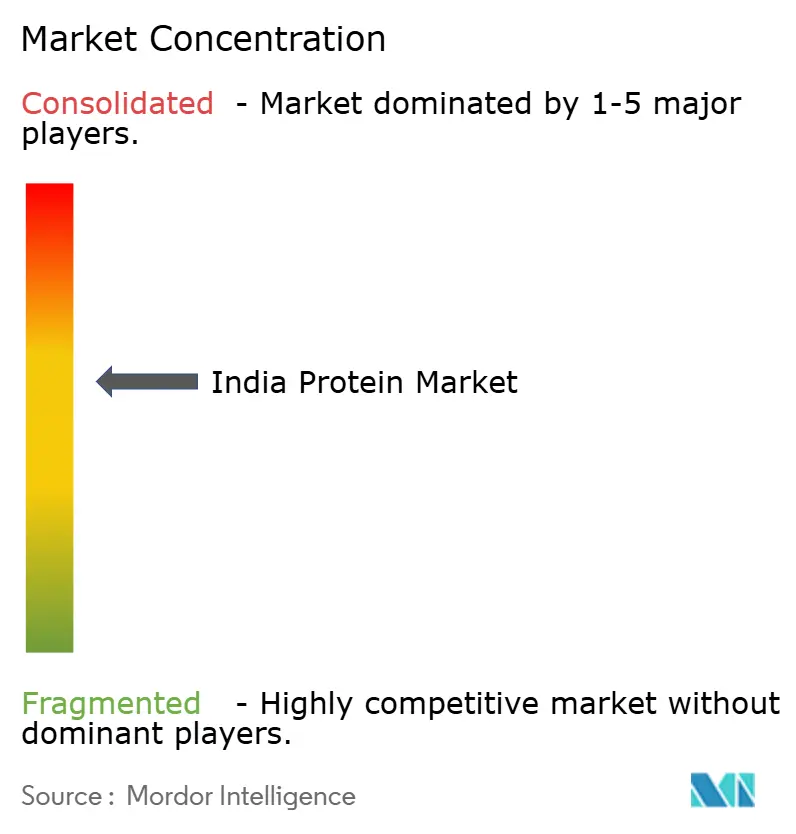
| Market Concentration | Medium |
Major Players *Disclaimer: Major Players sorted in no particular order Image © Mordor Intelligence. Reuse requires attribution under CC BY 4.0. | |
India Protein Market Analysis by Mordor Intelligence
The India protein market size is projected to expand from USD 1.52 billion in 2025 and USD 1.62 billion in 2026 to USD 2.22 billion by 2031, registering a CAGR of 6.54% between 2026 to 2031. Demand is fueled by rising disposable income, urban lifestyles, and heightened awareness that 73% of Indians consume less protein than the 60–70 grams per day guideline. Dairy leadership anchors supply because India is the world’s largest milk producer, giving processors abundant whey and casein streams. Precision fermentation pilots, government-backed fortification programs, e-commerce penetration, and influencer-led wellness narratives combine to broaden the shopper base beyond gyms into mainstream households. Meanwhile, pricing volatility for soybean and milk powder, allergen scrutiny, and slow novel-food approvals temper near-term margins and innovation speed.
Key Report Takeaways
- By source, animal protein led with 58.43% of the India protein market share in 2025, while microbial protein is forecast to grow at a 7.95% CAGR through 2031.
- By form, concentrates captured 62.57% of the India protein market in 2025; hydrolysates are advancing at a 7.24% CAGR through 2031.
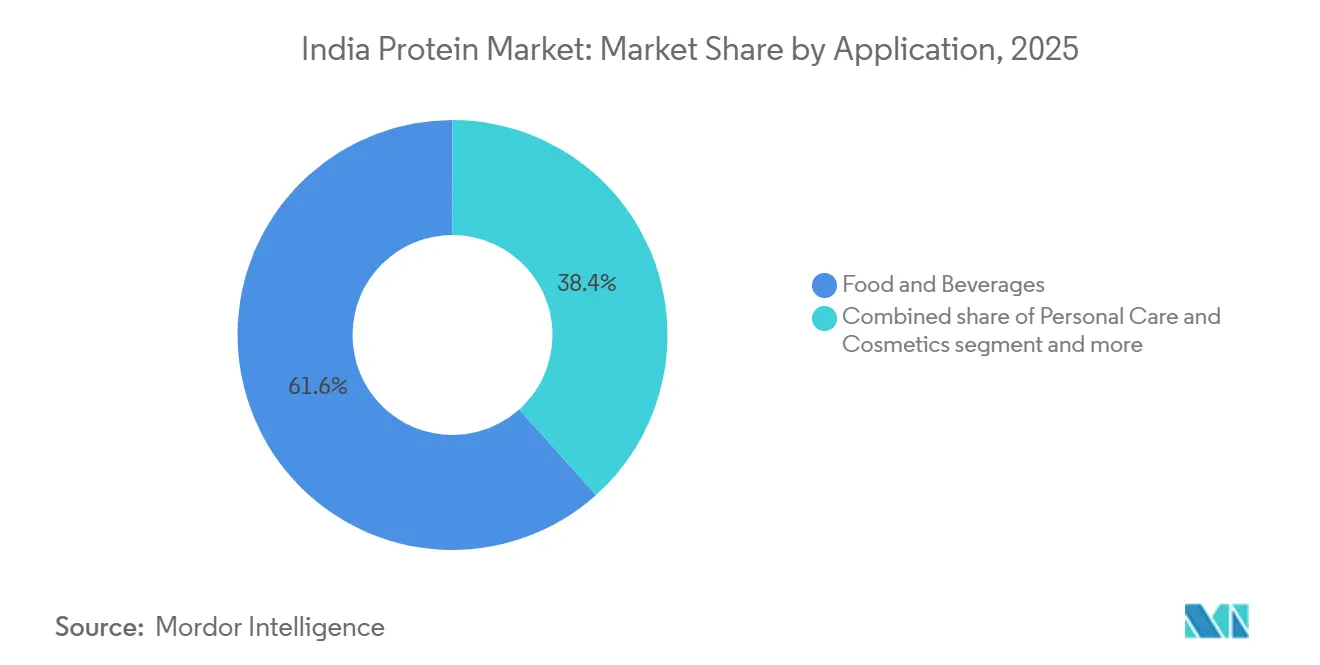
- By application, food and beverages accounted for 61.63% demand in 2025, whereas dietary supplements and sports nutrition is expanding at a 6.78% CAGR through 2031.
Note: Market size and forecast figures in this report are generated using Mordor Intelligence’s proprietary estimation framework, updated with the latest available data and insights as of January 2026.
India Protein Market Trends and Insights
Drivers Impact Analysis
| Driver | (~) % Impact on CAGR Forecast | Geographic Relevance | Impact Timeline |
|---|---|---|---|
| Growing mainstream adoption of high-protein diets and sports nutrition | +1.2% | National, with early gains in metros (Delhi, Mumbai, Bengaluru, Hyderabad) and tier-2 cities (Lucknow, Surat, Indore) | Medium term (2-4 years) |
| Protein fortification of everyday staples | +0.9% | National, rural and semi-urban focus via public distribution system and mid-day meal programs | Long term (≥ 4 years) |
| Expansion of ready-to-drink protein shakes, bars, and sachet-based formats | +0.8% | Urban and peri-urban, driven by modern retail and quick-commerce | Short term (≤ 2 years) |
| Emerging use of precision fermentation to produce animal-free dairy proteins | +0.6% | Gujarat, Maharashtra (manufacturing hubs); national distribution via FMCG channels | Medium term (2-4 years) |
| Rising demand for premium pet food and aquafeed | +0.5% | Urban centers (pet food); coastal states Tamil Nadu, Andhra Pradesh, West Bengal (aquafeed) | Medium term (2-4 years) |
| Strong digital-led marketing and influencer-driven health-and-wellness narratives | +0.7% | National, concentrated in metros and tier-1 cities with high social media penetration | Short term (≤ 2 years) |
| Source: Mordor Intelligence | |||
Understand The Key Trends Shaping This Market
Download Sample Report
Growing mainstream adoption of high-protein diets and sports nutrition
Protein consumption is transitioning from a gym-centric niche to a mainstream dietary priority, catalyzed by the COVID-19 pandemic's emphasis on immunity and long-term health resilience. The sports nutrition and dietary supplements segment is forecast to grow at a 6.6% CAGR, according to the India Brand Equity Foundation[1]Source: India Brand Equity Foundation, “Fuelling Fitness: The Rapid Growth of India’s Protein Market,” ibef.org. This expansion is underpinned by rising gym memberships, fitness app adoption, and the normalization of protein supplementation among non-athletes, including working professionals, parents, and seniors seeking muscle maintenance and metabolic health. E-commerce and direct-to-consumer channels have democratized access, with quick-commerce platforms enabling impulse purchases of protein powders and ready-to-drink shakes in tier-2 and tier-3 cities where modern retail penetration remains limited. MuscleBlaze and Optimum Nutrition jointly command approximately 20% of the protein powder market, while plant-based challengers such as Oziva and TrueBasics, whose Clean Whey launch in June 2025 emphasized transparency and purity, are capturing younger, health-conscious consumers. The shift is further amplified by influencer-driven narratives on social media, which frame protein intake as a marker of wellness and social currency, thereby extending adoption beyond traditional fitness enthusiasts.
Protein Fortification of Everyday Staples
Government-led fortification programs are embedding protein into the national food supply, targeting vulnerable populations with inadequate dietary diversity. The Union Cabinet allocated INR 170,820 million (USD 2.04 billion) in 2024 to continue free distribution of fortified rice through the Public Distribution System, Integrated Child Development Services, and mid-day meal schemes, reaching hundreds of millions of beneficiaries. While the primary focus is micronutrient fortification (iron, folic acid, and vitamin B12), the infrastructure and policy momentum create pathways for protein enrichment of staples such as wheat flour, edible oils, and dairy blends. FSSAI's Food Fortification Regulations specify permissible fortificants, labeling requirements, and compositional standards, providing a regulatory framework for manufacturers to introduce protein-fortified atta, biscuits, and ready-to-cook mixes. The World Bank's support for transforming India's Poshan Abhiyaan nutrition program emphasizes scaling evidence-based interventions, including supplementary foods with adequate protein content for pregnant women, lactating mothers, and children under five[2]Source: World Bank, “Transforming India’s Nationwide Nutrition Program: Poshan Abhiyaan,” worldbank.org . This policy-driven demand creates predictable procurement volumes for protein ingredient suppliers and incentivizes innovation in affordable, culturally acceptable formulations that blend plant and animal proteins.
Expansion of Ready-to-Drink Protein Shakes, Bars, and Sachet-Based Formats
Convenience-driven formats are reshaping the protein market, addressing time-constrained urban consumers who prioritize on-the-go nutrition. Single-serve sachets and travel packs, exemplified by Pentasure's 3-sachet travel packs priced at INR 311-693 (USD 3.70-8.30), lower the entry barrier for trial and enable penetration into smaller towns where bulk tubs are cost-prohibitive, according to Pentasure Nutrition. Quick-service restaurants and modern trade chains are incorporating high-protein options into their menus, such as McDonald's Multi-Millet Bun and Protein PLUS slice, which normalize protein-enriched foods as everyday choices rather than specialty supplements. The shift toward snackable formats also addresses taste and texture challenges. Protein chips made from chickpea, soy, and lentil offer familiar flavors and crunch, reducing the sensory barrier that has historically limited the adoption of protein powders. FMCG incumbents, including Nestlé, Amul, ITC, and Britannia, are launching high-protein variants of existing product lines, leveraging distribution reach and brand trust to accelerate category mainstreaming.
Emerging Use of Precision Fermentation to Produce Animal-Free Dairy Proteins
Precision fermentation is transitioning from pilot to commercial scale in India, offering a pathway to produce dairy-identical proteins without animal agriculture. Perfect Day's Gujarat facility, scheduled to start operations in 2026 with full ramp-up through 2027, will manufacture recombinant whey protein using microbial fermentation, positioning India as a manufacturing hub for animal-free dairy ingredients. This development is supported by the Department of Biotechnology's BioE3 implementation plan, approved in January 2025, which allocates blended funding, shared infrastructure (bioreactors, downstream processing), and regulatory facilitation to accelerate the commercialization of biotech-derived food ingredients. Precision fermentation addresses supply-side constraints by decoupling protein production from seasonal milk availability and land/water limitations, while delivering consistent quality and compositional control. The technology also enables production of novel proteins and functional ingredients, such as lactoferrin, casein micelles, and specific whey fractions, that command premium pricing in infant formula, clinical nutrition, and sports supplements. However, consumer acceptance hinges on transparent labeling, regulatory clarity from FSSAI on novel food approvals, and cost parity with conventional dairy proteins, which currently benefit from established supply chains and cooperative infrastructure.
Restraints Impact Analysis
| Restraint | (~) % Impact on CAGR Forecast | Geographic Relevance | Impact Timeline |
|---|---|---|---|
| Volatility in prices and supply of key inputs | -0.8% | National, with acute impact in soy-dependent regions (Gujarat, Madhya Pradesh) and dairy clusters (Maharashtra, Punjab) | Short term (≤ 2 years) |
| Allergenicity concerns and consumer skepticism | -0.5% | Urban centers with higher label literacy; national as awareness spreads | Medium term (2-4 years) |
| Regulatory approvals slowing insect/microbial protein adoption | -0.4% | National, affecting novel protein startups and alternative protein manufacturers | Long term (≥ 4 years) |
| Flavor off-notes/processing challenges driving higher costs | -0.6% | National, particularly affecting plant-based and hydrolyzed protein segments | Medium term (2-4 years) |
| Source: Mordor Intelligence | |||
Volatility in Prices and Supply of Key Inputs
Input cost fluctuations for soybean, milk powder, and feed grains create margin pressure and supply uncertainty across the protein value chain. India's soybean production and crushing capacity are concentrated in Gujarat and Madhya Pradesh, where monsoon variability and global commodity price swings drive year-on-year volatility in soymeal availability and pricing. Milk production exhibits seasonal peaks and troughs, with flush periods during winter and lean months in summer, affecting whey and casein by-product volumes and necessitating imports of high-purity isolates for premium applications. Feed grain prices, critical to the poultry, aquaculture, and dairy sectors, are influenced by domestic procurement policies, buffer stock management, and international trade in maize and soybean meal, with any tightening of supply raising livestock production costs and compressing protein output. Processors mitigate risk through forward contracts, vertical integration, and diversification of protein sources, yet smaller players lack hedging capacity and face working capital constraints during price spikes. Exchange rate movements further complicate import-dependent segments, as rupee depreciation raises landed costs for whey protein isolates, specialty plant proteins, and fermentation media components.
Allergenicity Concerns and Consumer Skepticism
Protein products face scrutiny over allergen labeling, quality claims, and compositional accuracy, eroding consumer trust and limiting trial among cautious buyers. Milk, soy, egg, and nut proteins are common allergens that require explicit declaration under FSSAI packaging and labeling regulations, yet enforcement gaps and cross-contamination risks persist in facilities that process multiple protein sources. Media reports of adulteration, spiking with cheaper amino acids, and misleading "high protein" claims have heightened skepticism, prompting FSSAI to tighten substantiation requirements and mandate third-party testing for nutrient content claims. Plant-based proteins, while appealing to lactose-intolerant and vegan consumers, often deliver incomplete amino acid profiles unless carefully blended, and manufacturers must educate buyers on protein quality metrics such as PDCAAS and DIAAS to justify premium pricing. Mycoprotein and novel fermentation-derived proteins face additional hurdles, including allergenicity testing, mycotoxin risk assessments, and consumer unfamiliarity with microbial sources, necessitating transparent communication and regulatory dossiers to secure FSSAI novel food approvals. Brands investing in clean-label formulations, third-party certifications (ISO, HACCP), and traceability systems can differentiate on trust, yet these measures increase compliance costs and time-to-market.
Segment Analysis
By Source: Dairy Dominance Anchors Animal Proteins, Microbial Fermentation Gains Traction
Animal Protein held a 58.43% market share in 2025, underpinned by India's status as the world's largest milk producer, with annual output supporting robust whey, casein, and milk protein concentrate supply. Whey Protein, the largest animal-derived segment, benefits from vertical integration by dairy processors such as Parag Milk Foods, which invested INR 30,000 million (USD 360 million) to expand production. Egg Protein and Collagen serve niche applications in bakery, confectionery, and clinical nutrition, while Gelatin finds use in pharmaceuticals and functional foods. Insect Protein remains in pilot stages, awaiting FSSAI human consumption approvals despite potential for aquafeed and pet food applications. Microbial Protein is the fastest-growing source, with a 7.95% CAGR through 2031, driven by the commercialization of Algae Protein and Mycoprotein. Perfect Day's Gujarat facility, set to start operations in 2026, will produce recombinant whey via precision fermentation, offering dairy-identical proteins without animal agriculture. Mycoprotein production leverages submerged fermentation of filamentous fungi, delivering high-quality protein with complete amino acid profiles and low saturated fat, suitable for meat analogues and ready-to-eat meals. The Department of Biotechnology's BioE3 plan, approved in January 2025, provides funding, pilot infrastructure, and regulatory facilitation to accelerate microbial protein scale-up.
Plant Protein sources, Soy, Pea, Rice, Wheat, Potato, Hemp, and others, are expanding rapidly, targeting vegetarian consumers, lactose-intolerant individuals, and sustainability-conscious buyers. Soy Protein remains the workhorse of plant-based formulations, with Gujarat and Madhya Pradesh hosting major crushing and processing clusters, yet faces allergenicity concerns and GMO-related consumer hesitancy. Pea Protein is gaining traction in meat analogues, dairy alternatives, and sports nutrition, valued for its neutral flavor profile and non-allergenic status, though earthy off-notes require masking. Rice and Wheat Proteins serve bakery and snack applications, while Potato and Hemp Proteins target premium, clean-label segments. FSSAI's Food Fortification Regulations enable protein enrichment of staples, creating demand for cost-effective plant protein concentrates in atta, biscuits, and ready-to-cook mixes[3]Source: Food Safety and Standards Authority of India, “Compendium: Food Fortification Regulations,” fssai.gov.in. Cargill's expanded partnership with ENOUGH to scale mycoprotein and biomass fermentation signals multinational commitment to alternative protein platforms adaptable to Indian feedstocks.

Note: Segment shares of all individual segments available upon report purchase
Get Detailed Market Forecasts at the Most Granular Levels
Download Sample Report
By Form: Concentrates Lead on Cost, Hydrolysates Capture Clinical Niches
Concentrates commanded 62.57% market share in 2025, reflecting their cost-competitive positioning for food manufacturers requiring functional protein without isolate-level purity. Whey protein concentrates (WPC) with 35-80% protein content dominate sports nutrition and bakery applications, while soy protein concentrates serve meat analogues and extruded snacks. Domestic production of concentrates benefits from established dairy cooperatives and soy processing infrastructure, reducing import dependency and enabling price points accessible to mass-market consumers. Isolates, delivering 90%+ protein content with minimal lactose, fat, and carbohydrates, command premium pricing in clinical nutrition, infant formula, and high-performance sports supplements. India imports high-purity whey protein isolates due to limited domestic fractionation capacity, with imports sourced from the EU, New Zealand, and the United States. Hydrolysates, forecast to grow at a 7.24% CAGR through 2031, target clinical nutrition, infant formula, and geriatric applications requiring rapid digestion and reduced allergenicity. Enzymatic hydrolysis breaks proteins into peptides and amino acids, improving bioavailability but generating bitter off-notes that necessitate flavor masking and the addition of sweeteners, thereby raising formulation costs.
Other Forms, including protein blends, microparticulated proteins, and textured proteins, address specific functional needs. Textured vegetable proteins (TVP) produced via extrusion serve meat analogue applications, offering fibrous structures that mimic chicken, mutton, and seafood. FSSAI's Compendium of Food Additives Regulations governs permissible emulsifiers, stabilizers, and enzymes used in protein processing, directly influencing formulation choices and shelf-life extension strategies. Manufacturers investing in membrane filtration, ion exchange, and spray drying technologies can upgrade domestic whey and plant proteins to isolate-grade purity, capturing higher margins and reducing import reliance. Godrej Agrovet's INR 15,000 million (USD 180 million) dairy processing facility in Telangana, announced in December 2025, signals private-sector commitment to expanding fractionation and value-addition capacity.
By Application: Food & Beverages Anchor Demand, Supplements Accelerate via E-Commerce
Food and Beverages accounted for 61.63% of application demand in 2025, spanning Bakery, Beverages, Breakfast Cereals, Condiments/Sauces, Confectionery, Dairy and Dairy Alternatives, Meat/Poultry/Seafood and Meat Alternatives, RTE/RTC Foods, Snacks, and Infant Nutrition. Dairy and Dairy Alternative Products represent the largest sub-segment, driven by high-protein milk, flavored yogurt drinks, and paneer-based ready-to-eat meals. Amul, Mother Dairy, and Parag Milk Foods are launching protein-fortified variants to capture wellness-driven demand. Meat/Poultry/Seafood and Meat Alternative Products are expanding as plant-based meat analogues gain traction in urban centers, with startups and FMCG players introducing soy- and pea-protein-based kebabs, nuggets, and burger patties adapted to Indian spice profiles. Bakery applications leverage whey and egg proteins for texture, shelf-life extension, and nutritional enhancement, while Snacks, including protein chips, bars, and biscuits, are mainstreaming protein beyond supplements. Infant Nutrition remains a high-value segment, with strict compositional standards and FSSAI approval requirements for protein sources, hydrolysates, and fortificants.
Dietary Supplements and Sports Nutrition is the fastest-growing application at 6.78% CAGR through 2031, propelled by e-commerce penetration, influencer marketing, and the normalization of protein supplementation among non-athletes. Whey protein powders dominate, with MuscleBlaze and Optimum Nutrition, while plant-based challengers such as Oziva and TrueBasics target vegan and lactose-intolerant consumers. Product innovation includes flavored variants, digestive enzyme additions (bromelain, papain), and blends tailored for women, seniors, and diabetics, expanding use cases beyond muscle building to include weight management, immunity, and metabolic health. Personal Care and Cosmetics utilize protein hydrolysates and keratin for hair and skin formulations, while Animal Feed, spanning aquafeed, poultry, and pet food, demands high-protein meals and concentrates to support growth rates and feed conversion efficiency. Aquafeed expansion in coastal states, supported by the Department of Fisheries' Pradhan Mantri Matsya Sampada Yojana, increases demand for fishmeal and soy-based protein ingredients according to Department of Fisheries.
Note: Segment shares of all individual segments available upon report purchase
Get Detailed Market Forecasts at the Most Granular Levels
Download Sample Report
Geography Analysis
India's protein market exhibits pronounced regional heterogeneity, shaped by production clusters, dietary patterns, and infrastructure availability. Northern India accounted for approximately 35% of sports nutrition and protein supplement sales in 2023, anchored by metros such as Delhi and Chandigarh, as well as emerging tier-2 cities, including Lucknow, where e-commerce and modern retail penetration drive adoption, according to the India Brand Equity Foundation. Western India, representing approximately 28% of the market, benefits from Gujarat's soy-processing clusters and Maharashtra's dairy cooperatives, which supply whey, casein, and soy protein concentrates to national and export markets, according to the United States Department of Agriculture, Foreign Agricultural Service[4]Source: United States Department of Agriculture, “Oilseeds and Products Update,” usda.gov. Mumbai, Surat, and Jaipur serve as distribution hubs for FMCG and supplement brands, while Gujarat's emerging role as a precision fermentation hub, exemplified by Perfect Day's facility, positions the state as a manufacturing center for animal-free dairy proteins.
Southern India, which accounts for approximately 22% of the market value, shows a strong preference for flavored, ready-to-drink, and bar formats, with Bengaluru, Chennai, and Hyderabad leading in health-conscious consumer segments, according to the India Brand Equity Foundation. Tamil Nadu's aquaculture sector drives aquafeed protein demand, while Karnataka and Telangana host dairy processing investments such as Godrej Agrovet's INR 15,000 million (USD 180 million) facility. Eastern India, representing approximately 15% of the market, is improving availability via e-commerce and regional suppliers, with Bhubaneswar and Patna emerging as growth pockets. West Bengal's aquaculture and fisheries sector, supported by the Department of Fisheries' infrastructure investments, increases demand for high-protein fishmeal and soy-based feed.
Rural and semi-urban areas across all regions remain underserved by premium protein products, yet government fortification programs, such as the INR 170,820 million (USD 2.04 billion) fortified rice initiative, embed protein into public distribution channels, addressing nutritional gaps and creating predictable demand for protein-fortified staples. Cold-chain infrastructure remains a constraint in tier-3 cities and rural areas, limiting distribution of perishable dairy proteins and ready-to-drink formats, though quick-commerce expansion and last-mile logistics improvements are gradually closing the gap. Regional dietary preferences influence product formulation, North and West favor dairy-based proteins, South shows higher acceptance of plant-based and fermented proteins, and East exhibits growing interest in fish-derived proteins and aquaculture by-products. FSSAI's labeling and packaging regulations apply uniformly across regions, yet enforcement capacity varies, with metros exhibiting higher compliance and rural areas facing gaps in testing and inspection.
Competitive Landscape
The India Protein Market exhibits moderate concentration, with the top five players, Archer Daniels Midland, Cargill, Glanbia, Hexagon Nutrition, and Gujarat Ambuja Exports, holding approximately the majority share. This structure creates space for regional specialists, direct-to-consumer challengers, and niche innovators to capture underserved segments such as plant-based meat analogues, precision-fermented proteins, and premium pet nutrition. Incumbents leverage vertical integration and scale economies. Parag Milk Foods' INR 30,000 million (USD 360 million) investment to produce whey in-house exemplifies the strategy of capturing margin at the ingredient level and reducing import dependency.
Multinational ingredient suppliers are localizing production through partnerships. Cargill's expanded collaboration with ENOUGH to scale mycoprotein and biomass fermentation signals a shift toward feedstock-flexible, sustainable protein platforms adaptable to Indian agricultural residues. Precision fermentation entrants such as Perfect Day are establishing manufacturing beachheads in Gujarat, targeting ingredient-first commercialization to supply dairy-identical proteins to food manufacturers and bypass consumer acceptance hurdles associated with novel foods. White-space opportunities center on affordable, culturally adapted formats, protein-fortified lassi, atta, and single-serve sachets, that address the 73% of Indians consuming less than recommended protein levels as per the India Brand Equity Foundation.
Direct-to-consumer brands such as Oziva, TrueBasics, and The Whole Truth are leveraging e-commerce and quick-commerce to bypass traditional retail, deploying influencer marketing and subscription models to build brand loyalty among younger, health-conscious consumers. FMCG incumbents including Nestlé, Amul, ITC, and Britannia are entering with high-protein variants of existing product lines, normalizing protein-enriched foods and extending distribution into tier-2 and tier-3 cities where modern retail penetration remains limited. Technology adoption is accelerating, with automation, digital monitoring, and data analytics optimizing yield, reducing waste, and maintaining food-safety standards in Cargill's "Factory of the Future" protein processing facilities. Regulatory compliance remains a competitive differentiator, brands investing in third-party certifications (ISO, HACCP), traceability systems, and transparent labeling can command premium pricing and build consumer trust, yet these measures increase compliance costs and time-to-market.
India Protein Industry Leaders
Archer Daniels Midland Company (ADM)
Cargill Incorporated
Glanbia plc
Hexagon Nutrition Ltd
Gujarat Ambuja Exports Ltd / Shree Panchvati Soy Industries
- *Disclaimer: Major Players sorted in no particular order
Need More Details on Market Players and Competitors?
Download Sample Report
Recent Industry Developments
- December 2025: Godrej Agrovet announced plans to establish an INR 15,000 million (USD 180 million) dairy processing facility in Telangana, expanding regional capacity for milk protein products and signaling the private sector's commitment to value-addition and formalization in India's dairy protein segment.
- June 2025: TrueBasics, a Hexagon Nutrition brand, launched Clean Whey protein powder, emphasizing transparency and purity, targeting urban, health-conscious consumers seeking clean-label formulations and addressing rising skepticism around protein quality and additive use in the Indian market.
- May 2025: Heritage Foods announced its entry into the protein market, leveraging its dairy infrastructure and distribution network to capture demand for protein-fortified dairy products and supplements, intensifying competition among regional dairy processors.
- January 2025: Cargill expanded its partnership with ENOUGH to scale mycoprotein and biomass fermentation, aiming to provide consumers with innovative, sustainable protein options and leveraging Cargill's global supply chain and manufacturing capabilities to localize alternative protein production in key markets, including India.
India Protein Market Report Scope
Proteins are large, complex molecules that play many critical roles in the body. They work in cells and are required for the structure, function, and regulation of the body's tissues and organs. The scope of this report encompasses a comprehensive analysis of the India protein market, segmented by source, form, and application. By source, the market is categorized into animal, microbial, and plant proteins. The animal protein segment includes casein and caseinates, collagen, egg protein, gelatin, insect protein, milk protein, whey protein, and other animal proteins. The microbial protein segment covers algae protein and mycoprotein, while the plant protein segment includes hemp protein, pea protein, potato protein, rice protein, soy protein, wheat protein, and other plant proteins. Based on form, the India protein market is segmented into concentrates, isolates, hydrolysates, and other forms. This segmentation analyzes the demand patterns, functional properties, and usage trends of different protein forms across end-use industries. By application, the market is classified into food and beverages, personal care and cosmetics, animal feed, dietary supplements, and sports nutrition. The food and beverages segment is further sub-segmented into bakery, beverages, breakfast cereals, condiments and sauces, confectionery, dairy and dairy alternative products, meat, poultry, seafood and meat alternative products, ready-to-eat and ready-to-cook food products, snacks, infant nutrition, and other food and beverage applications. The report provides market size estimations and forecasts for all segments in both value (USD) and volume (tons) terms, along with an analysis of key trends, growth drivers, challenges, and competitive developments influencing the India protein market.
By Source
| Animal | Casein and Caseinates |
| Collagen | |
| Egg Protein | |
| Gelatin | |
| Insect Protein | |
| Milk Protein | |
| Whey Protein | |
| Other Animal Proteins | |
| Microbial | Algae Protein |
| Mycoprotein | |
| Plant | Hemp Protein |
| Pea Protein | |
| Potato Protein | |
| Rice Protein | |
| Soy Protein | |
| Wheat Protein | |
| Other Plant Proteins |
By Form
| Concentrates |
| Isolates |
| Hydrolysates |
| Other Forms |
By Application
| Food and Beverages | Bakery |
| Beverages | |
| Breakfast Cereals | |
| Condiments/Sauces | |
| Confectionery | |
| Dairy and Dairy Alternative Products | |
| Meat/Poultry/Seafood and Meat Alternative Products | |
| RTE/RTC Food Products | |
| Snacks | |
| Infant Nutrition | |
| Other Food and Beverage Applications | |
| Personal Care and Cosmetics | |
| Animal Feed | |
| Dietary Supplements and Sports Nutrition |
| By Source | Animal | Casein and Caseinates |
| Collagen | ||
| Egg Protein | ||
| Gelatin | ||
| Insect Protein | ||
| Milk Protein | ||
| Whey Protein | ||
| Other Animal Proteins | ||
| Microbial | Algae Protein | |
| Mycoprotein | ||
| Plant | Hemp Protein | |
| Pea Protein | ||
| Potato Protein | ||
| Rice Protein | ||
| Soy Protein | ||
| Wheat Protein | ||
| Other Plant Proteins | ||
| By Form | Concentrates | |
| Isolates | ||
| Hydrolysates | ||
| Other Forms | ||
| By Application | Food and Beverages | Bakery |
| Beverages | ||
| Breakfast Cereals | ||
| Condiments/Sauces | ||
| Confectionery | ||
| Dairy and Dairy Alternative Products | ||
| Meat/Poultry/Seafood and Meat Alternative Products | ||
| RTE/RTC Food Products | ||
| Snacks | ||
| Infant Nutrition | ||
| Other Food and Beverage Applications | ||
| Personal Care and Cosmetics | ||
| Animal Feed | ||
| Dietary Supplements and Sports Nutrition | ||
Need A Different Region or Segment?
Customize Now
Market Definition
- End User - The Protein Ingredients Market operates on a B2B basis. Food, Beverages, Supplements, Animal Feed, and Personal Care & Cosmetic manufacturers are considered to be end-consumers in the market studied. The scope excludes manufacturers buying liquid/dry whey to be used for application as a binding agent or thickener or other non-protein applications.
- Penetration Rate - Penetration Rate is defined as the percentage of Protein-Fortified End User Market Volume in the Overall End User Market Volume.
- Average Protein Content - Average protein content is the average protein content present per 100 g of product manufactured by all end-user companies considered under the scope of this report.
- End User Market Volume - End-user market volume is the consolidated volume of all types and forms of end-user products in the country or region.
| Keyword | Definition |
|---|---|
| Alpha-lactalbumin (α-Lactalbumin) | It is a protein that regulates the production of lactose in the milk of almost all mammalian species. |
| Amino acid | It is an organic compound that contains both amino and carboxylic acid functional groups, which are required for the synthesis of body protein and other important nitrogen-containing compounds, such as creatine, peptide hormones, and some neurotransmitters. |
| Blanching | It is the process of briefly heating vegetables with steam or boiling water. |
| BRC | British Retail Consortium |
| Bread improver | It is a flour-based blend of several components with specific functional properties designed to modify dough characteristics and give quality attributes to bread. |
| BSF | Black Soldier Fly |
| Caseinate | It is a substance produced by adding an alkali to acid casein, a derivative of casein. |
| Celiac disease | Celiac disease is an immune reaction to eating gluten, a protein found in wheat, barley, and rye. |
| Colostrum | It is a milky fluid that’s released by mammals that have recently given birth before breast milk production begins. |
| Concentrate | It is the least processed form of protein and has a protein content ranging from 40-90% by weight. |
| Dry protein basis | It refers to the percentage of "pure protein" present in a supplement after the water in it is completely removed through heat. |
| Dry whey | It is the product resulting from drying fresh whey which has been pasteurized and to which nothing has been added as a preservative. |
| Egg protein | It is a mixture of individual proteins, including ovalbumin, ovomucoid, ovoglobulin, conalbumin, vitellin, and vitellenin. |
| Emulsifier | It is a food additive that facilitates the blending of foods that are immiscible with one another, such as oil and water. |
| Enrichment | It is the process of addition of micronutrients that are lost during the processing of the product. |
| ERS | Economic Research Service of the USDA |
| Extrusion | It is the process of forcing soft mixed ingredients through an opening in a perforated plate or die designed to produce the required shape. The extruded food is then cut to a specific size by blades. |
| Fava | Also known as Faba, it is another word for yellow split beans. |
| FDA | Food and Drug Administration |
| Flaking | It is a process in which typically a cereal grain (like corn, wheat, or rice) is broken down into grits, cooked with flavors and syrups, and then pressed into flakes between cooled rollers. |
| Foaming agent | It is a food ingredient that makes it possible to form or maintain a uniform dispersion of a gaseous phase in a liquid or solid food. |
| Foodservice | It refers to the part of the food industry which includes businesses, institutions, and companies which prepare meals outside the home. It includes restaurants, school and hospital cafeterias, catering operations, and many other formats. |
| Fortification | It is the deliberate addition of micronutrients that are not found in them naturally or which are lost during processing, to improve a food product's nutritional value. |
| FSANZ | Food Standards Australia New Zealand |
| FSIS | Food Safety and Inspection Service |
| FSSAI | Food Safety and Standards Authority of India |
| Gelling agent | It is an ingredient that functions as a stabilizer and thickener to provide thickening without stiffness through the formation of gel. |
| GHG | Greenhouse Gas |
| Gluten | It is a family of proteins found in grains, including wheat, rye, spelt, and barley. |
| Hemp | It is a botanical class of Cannabis sativa cultivars grown specifically for industrial or medicinal use. |
| Hydrolysate | It is a form of protein manufactured by exposing the protein to enzymes that can partially break the bonds between the protein's amino acids and break down large, complicated proteins into smaller pieces. Its processing makes it easier and quicker to digest. |
| Hypoallergenic | It refers to a substance that causes fewer allergic reactions. |
| Isolate | It is the purest and most processed form of protein which has undergone separation to obtain a pure protein fraction. It typically contains ≥ 90% of protein by weight. |
| Keratin | It is a protein that helps form hair, nails, and the outer layer of skin. |
| Lactalbumin | It is the albumin contained in milk and obtained from whey. |
| Lactoferrin | It is an iron‑binding glycoprotein that is present in the milk of most mammals. |
| Lupin | It is the yellow legume seeds of the genus Lupinus. |
| Millenial | Also known as Generation Y or Gen Y, it refers to the people born from 1981 to 1996. |
| Monogastric | It refers to an animal with a single-compartmented stomach. Examples of monogastric include humans, poultry, pigs, horses, rabbits, dogs, and cats. Most monogastric are generally unable to digest much cellulose food materials such as grasses. |
| MPC | Milk protein concentrate |
| MPI | Milk protein isolate |
| MSPI | Methylated soy protein isolate |
| Mycoprotein | Mycoprotein is a form of single-cell protein, also known as fungal protein, derived from fungi for human consumption. |
| Nutricosmetics | It is a category of products and ingredients that act as nutritional supplements to care for skin, nails, and hair natural beauty. |
| Osteoporosis | It is a medical condition in which the bones become brittle and fragile from loss of tissue, typically as a result of hormonal changes, or deficiency of calcium or vitamin D. |
| PDCAAS | Protein digestibility-corrected amino acid score (PDCAAS) is a method of evaluating the quality of a protein based on both the amino acid requirements of humans and their ability to digest it. |
| Per-capita consumption of animal protein | It is the average amount of animal protein (such as milk, whey, gelatin, collagen, and egg proteins) that is readily available for consumption by each person in an actual population. |
| Per-capita consumption of plant protein | It is the average amount of plant protein (such as soy, wheat, pea, oat, and hemp proteins) that is readily available for consumption by each person in an actual population. |
| Quorn | It is a microbial protein manufactured using mycoprotein as an ingredient, in which the fungus culture is dried and mixed with egg albumen or potato protein, which acts as a binder, and then is adjusted in texture and pressed into various forms. |
| Ready-to-Cook (RTC) | It refers to food products that include all of the ingredients, where some preparation or cooking is required through a process that is given on the package. |
| Ready-to-Eat (RTE) | It refers to a food product prepared or cooked in advance, with no further cooking or preparation required before being eaten. |
| RTD | Ready-to-Drink |
| RTS | Ready-to-Serve |
| Saturated fat | It is a type of fat in which the fatty acid chains have all single bonds. It is generally considered unhealthy. |
| Sausage | It is a meat product made of finely chopped and seasoned meat, which may be fresh, smoked, or pickled and which is then usually stuffed into a casing. |
| Seitan | It is a plant-based meat substitute made out of wheat gluten. |
| Softgel | It is a gelatin-based capsule with a liquid fill. |
| SPC | Soy protein concentrate |
| SPI | Soy protein isolate |
| Spirulina | It is a biomass of cyanobacteria that can be consumed by humans and animals. |
| Stabilizer | It is an ingredient added to food products to help maintain or enhance their original texture, and physical and chemical characteristics. |
| Supplementation | It is the consumption or provision of concentrated sources of nutrients or other substances that are intended to supplement nutrients in the diet and is intended to correct nutritional deficiencies. |
| Texturant | It is a specific type of food ingredient that is used to control and alter the mouthfeel and texture of food and beverage products. |
| Thickener | It is an ingredient that is used to increase the viscosity of a liquid or dough and make it thicker, without substantially changing its other properties. |
| Trans fat | Also called trans-unsaturated fatty acids or trans fatty acids, it is a type of unsaturated fat that naturally occurs in small amounts in meat. |
| TSP | Textured soy protein |
| TVP | Textured vegetable protein |
| WPC | Whey protein concentrate |
| WPI | Whey protein isolate |
Need More Details on Market Definition?
Ask a Question
Research Methodology
Mordor Intelligence follows a four-step methodology in all our reports.
- Step-1: Identify Key Variables: The quantifiable key variables (industry and extraneous) pertaining to the specific product segment and country are selected from a group of relevant variables & factors based on desk research & literature review; along with primary expert inputs. These variables are further confirmed through regression modeling (wherever required).
- Step-2: Build a Market Model: In order to build a robust forecasting methodology, the variables and factors identified in Step-1 are tested against available historical market numbers. Through an iterative process, the variables required for market forecast are set and the model is built on the basis of these variables.
- Step-3: Validate and Finalize: In this important step, all market numbers, variables and analyst calls are validated through an extensive network of primary research experts from the market studied. The respondents are selected across levels and functions to generate a holistic picture of the market studied.
- Step-4: Research Outputs: Syndicated Reports, Custom Consulting Assignments, Databases & Subscription Platforms

Get More Details On Research Methodology
Download Sample Report


