
Market Overview
| Study Period | 2020 - 2031 |
|---|---|
| Forecast Data Period | 2026 - 2031 |
| Base Year Market Size (2025) | 5.60 Billion liters |
| Market Volume (2026) | 5.77 Billion liters |
| Market Volume (2031) | 6.73 Billion liters |
| Growth Rate (2026 - 2031) | 3.12 % |
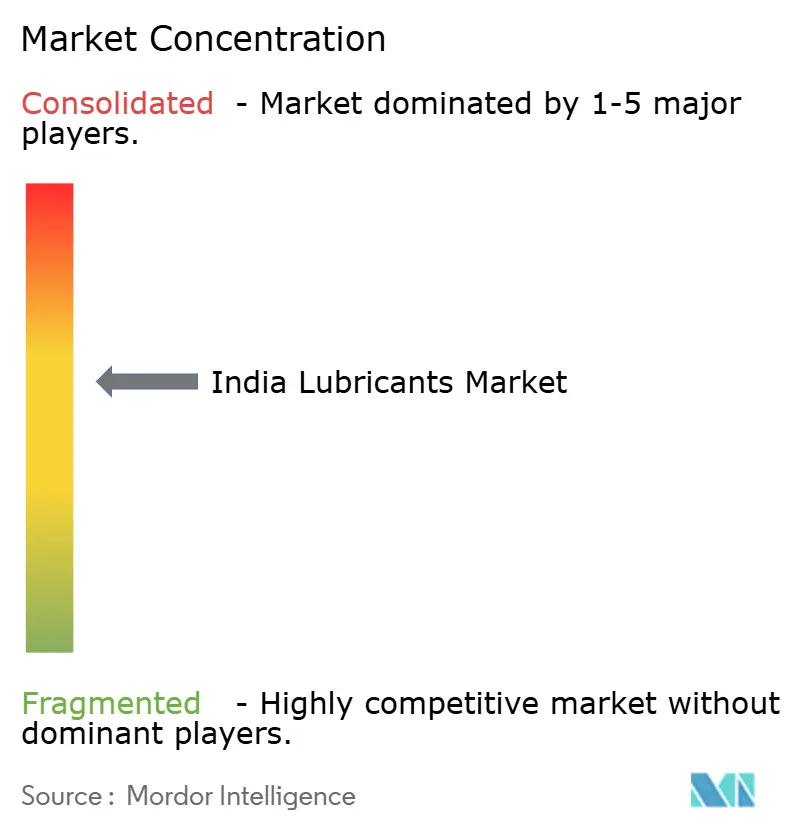
| Market Concentration | Medium |
Major Players *Disclaimer: Major Players sorted in no particular order Image © Mordor Intelligence. Reuse requires attribution under CC BY 4.0. | |
India Lubricants Market Analysis by Mordor Intelligence
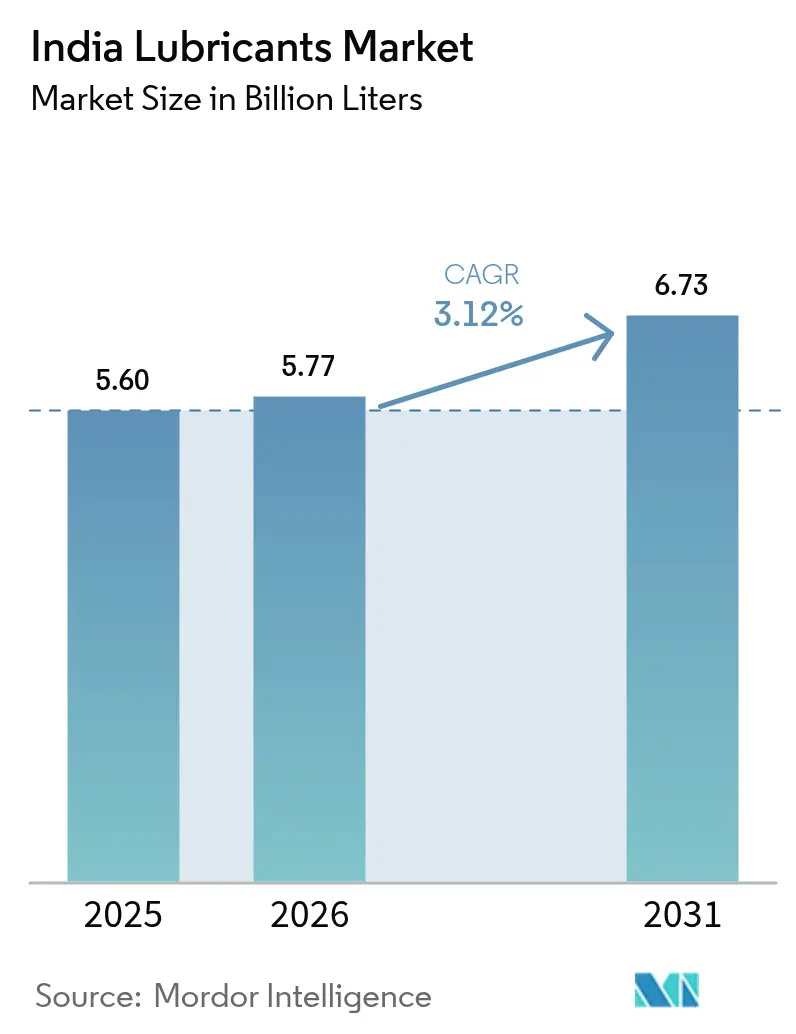
The India Lubricants Market size is expected to grow from 5.60 billion liters in 2025 to 5.77 billion liters in 2026 and is forecast to reach 6.73 billion liters by 2031 at 3.12% CAGR over 2026-2031. A robust vehicle parc, expanding industrial output, and a decisive shift toward premium‐grade formulations underpin this growth. Synthetic product innovation, stricter BS-VI and CAFE regulations, and the roll-out of digital condition monitoring solutions encourage higher-value sales even as electric mobility gathers pace. Industrial automation is widening demand for precision fluids in machining, hydraulics, and gearboxes, while organized fleet operators adopt predictive maintenance, sustaining volumes despite longer drain intervals. Competitive intensity continues to rise as domestic refiners leverage retail reach and multinational brands position premium portfolios to capture the evolving end-user mix.
Key Report Takeaways
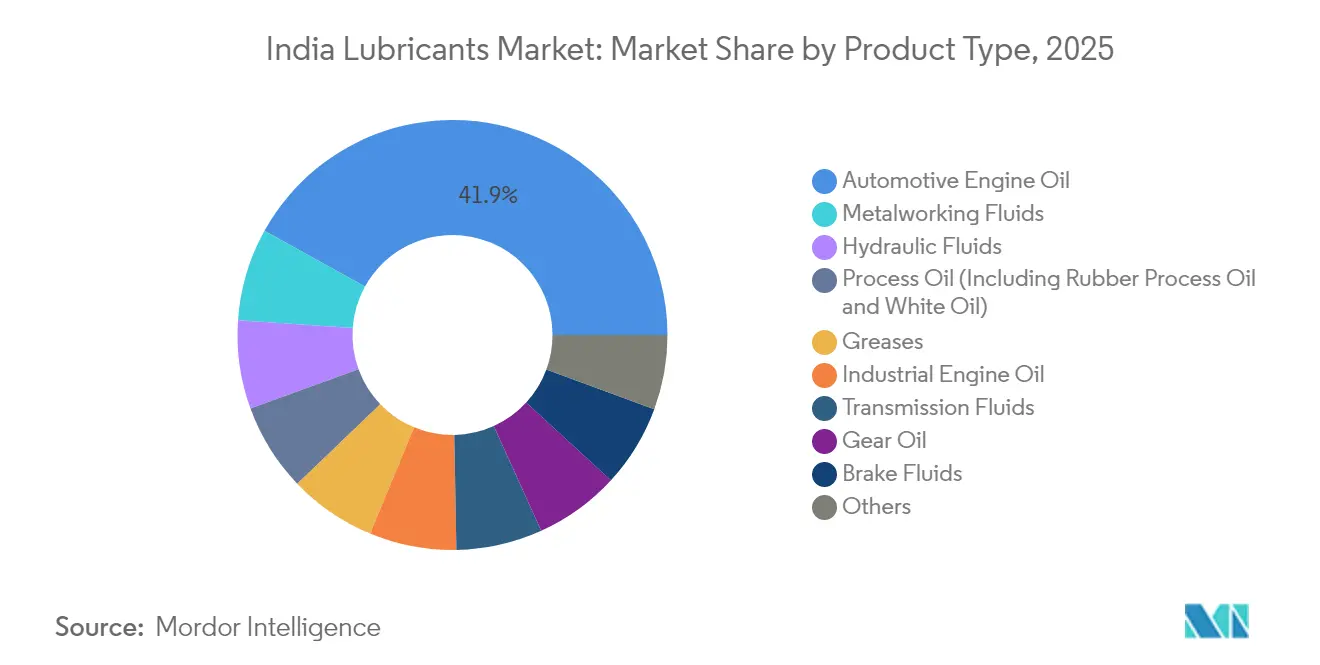
- By product type, automotive engine oil commanded 41.95% of the India lubricants market share in 2025, whereas metalworking fluids are projected to expand at a 5.29% CAGR through 2031.
- By end-user industry, automotive led with 54.15% revenue share in 2025 and is projected to post the fastest CAGR at 5.16% through 2031.
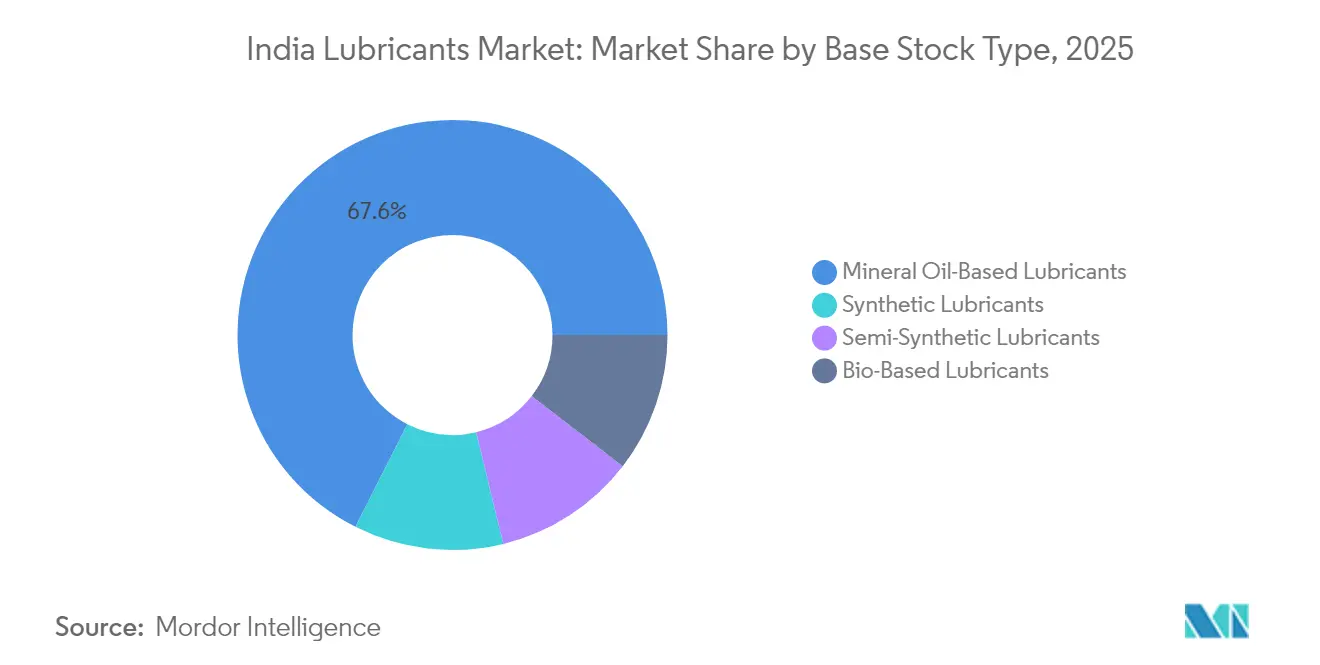
- By base stock type, mineral oil-based grades accounted for 67.55% share of the India lubricants market size in 2025, and synthetic alternatives are advancing at a 4.41% CAGR through 2031.
Note: Market size and forecast figures in this report are generated using Mordor Intelligence’s proprietary estimation framework, updated with the latest available data and insights as of 2026.
Market Trends and Insights
Drivers Impact Analysis of India Lubricants Market*
| Drivers | (~) % Impact on CAGR Forecast | Geographic Relevance | Impact Timeline |
|---|---|---|---|
| Rising Vehicle Parc and Miles-driven | +0.8% | National, concentrated in Maharashtra, Gujarat, Tamil Nadu | Medium term (2-4 years) |
| Industrial Output Growth Under "Make in India" | +0.6% | National, with manufacturing hubs in western and southern states | Long term (≥ 4 years) |
| BS-VI and CAFE Norms Pushing Premium Lubricants | +0.4% | National implementation, urban markets leading adoption | Short term (≤ 2 years) |
| Rapid CNG Fleet Expansion Needs Dedicated Engine Oils | +0.3% | Urban centers, commercial transport corridors | Medium term (2-4 years) |
| Digital Condition-monitoring Enabling Predictive Lube Changes | +0.2% | Industrial clusters, organized fleet operators | Long term (≥ 4 years) |
| Source: Mordor Intelligence | |||
Rising Vehicle Parc and Miles-driven
Passenger vehicle capacity additions in the western states are driving sustained demand for lubricants, even as electrification accelerates. Commercial fleets clock higher annual mileage due to e-commerce logistics and highway upgrades, which increases the frequency of lubricant replacement. Organized fleet operators rely on telematics to schedule oil changes that protect engines while minimizing downtime, reinforcing preference for premium synthetics. The automotive segment’s 54.72% share in 2024 illustrates this core demand anchor. Ageing two-wheeler and light-commercial fleets also bolster mineral oil volumes and maintain a broad customer base across rural markets.
Industrial Output Growth Under “Make in India”
Government manufacturing incentives continue to channel capital toward hubs for chemicals, metals, and heavy machinery in Gujarat, Maharashtra, and Tamil Nadu. Rising capacity utilization increases consumption of hydraulic fluids, gear oils, and compressor lubricants. The growth in precision machining at automotive and aerospace plants fuels a 5.51% CAGR in metalworking fluids, particularly neat cutting oils designed for broaching and carbide grinding. Investment in petrochemical complexes expands demand for turbine and compressor oils that operate under high temperatures. The preference for application-specific formulations supports the migration from commodity grades to performance-oriented synthetics, which extend drain intervals and limit unplanned shutdowns.
BS-VI and CAFE Norms Pushing Premium Lubricants
Nationwide enforcement of BS-VI tail-pipe standards and tighter fuel-efficiency targets require low-viscosity 0W-20 and 5W-30 oils with advanced additive packs. These regulations explain the 4.48% CAGR posted by synthetic lubricants despite the 68.12% dominance of mineral grades. Original equipment manufacturers recommend extended-drain synthetics to preserve catalytic converters and particulate filters, stimulating higher unit realizations for lubricant blenders. Formulators incorporate friction modifiers and anti-wear chemistry that maintain oil film stability at elevated engine temperatures common to Indian driving cycles. As compliant products command price premiums, suppliers with research and testing capability gain a competitive edge.
Rapid CNG Fleet Expansion Needs Dedicated Engine Oils
City bus fleets and intra-city delivery vehicles are switching to compressed natural gas, which burns hotter than gasoline and places greater stress on valves and piston rings. Bharat Petroleum’s MAK CNG Plus and other dedicated formulations offer enhanced thermal stability and oxidation resistance, which are essential for these engines[1]. Fleet managers accept higher product prices because total operating cost declines when engines run cleaner and oil change intervals lengthen. This specialty demand diversifies revenue and partially cushions any future slide in traditional diesel volumes. Premiumization also fosters brand loyalty among fleet operators who value technical support and seamless performance guarantees.
Restraints Impact Analysis of India Lubricants Market*
| Restraints | (~) % Impact on CAGR Forecast | Geographic Relevance | Impact Timeline |
|---|---|---|---|
| Volatility in Base-oil and Additive Prices | -0.5% | National, affecting all market segments | Short term (≤ 2 years) |
| Accelerating EV Adoption Curbing ICE Lubricant Demand | -0.4% | Urban centers, expanding to tier-2 cities | Medium term (2-4 years) |
| Import Dependency on Group III/IV Base Oils | -0.3% | National, particularly affecting premium segments | Long term (≥ 4 years) |
| Source: Mordor Intelligence | |||
Volatility in Base oil and Additive Prices
Group I base oils constitute a major portion of many finished blends, so crude price swings quickly erode blender margins. India is ramping up its domestic base-oil capacity, yet premium Group III and IV stocks must still be imported, leaving formulators exposed to currency fluctuations and freight spikes[2]. Additive packages, particularly dispersants and friction modifiers used in BS-VI compliant synthetics, also face supply chain disruptions during global events. Smaller regional blenders struggle to maintain inventory buffers and may cede market share to integrated refiners that manage feedstock volatility more effectively. Frequent price adjustments can nudge cost-sensitive users toward lower-grade products or extend drain intervals, shaving near-term volume growth for the India lubricants market.
Accelerating EV Adoption Curbing ICE Lubricant Demand
Government targets aim for 30% electric penetration in passenger cars by 2030, which could trim automotive engine oil volume. EV powertrains eliminate crankcase lubrication and often use sealed transmissions with reduced fluid demand. However, electric platforms introduce fresh needs for thermal-management fluids and specialty greases for motor bearings and battery packs. Lubricant suppliers are reallocating research budgets to these segments while expanding their industrial portfolios to balance the likely long-term decline in demand for internal combustion engine oils. During the transition, parallel growth in hybrid vehicles and a sizeable legacy fleet should keep the India lubricants market expanding, though at a moderated pace.
*Our forecasts treat driver/restraint impacts as directional, not additive. The impact forecasts reflect baseline growth, mix effects, and variable interactions.
India Lubricants Market Segment Analysis
By Product Type – Engine Oils Anchor Volumes While Metalworking Fluids Outpace
Automotive engine oil held 41.95% of the India lubricants market share in 2025, reflecting the country’s large on-road fleet and dusty operating environment that accelerates oil degradation. Heavy traffic and high ambient temperatures shorten drain intervals, locking in repeat purchases for passenger cars, commercial trucks, and two-wheelers. Industrial engine oils support diesel generator sets, earth-moving equipment, and marine engines that power port operations, providing a stable base for high volumes. Transmission and gear oils accompany the rise in vehicle production, while greases secure bearings in heavy machinery, maintaining a balanced product mix.
Metalworking fluids are projected to grow at a 5.29% CAGR, the fastest among all categories, driven by an increase in precision machining for automotive and aerospace components. Neat cutting oils provide superior lubrication and heat dissipation in gear hobbing and broaching, while soluble oils protect tools during high-speed aluminium milling. Rubber and white process oils serve tire and food applications, with regulatory purity norms enabling premium pricing. Brake fluid requirements remain steady because even regenerative braking systems retain hydraulic circuits for emergency and parking functions. Collectively, these trends elevate specialty fluids as a strategic growth lever within the broader India lubricants market.

By End-user Industry – Automotive Dominates Though Industrial Diversification Accelerates
The automotive sector contributed 54.15% to the India lubricants market size in 2025, and it is also forecast to expand the fastest at a 5.16% CAGR through 2031. Passenger vehicle ownership is climbing in urban centers, prompting a move toward mid-tier synthetics that offer longer service life. Commercial fleets, particularly in logistics, require diesel engine oils and driveline fluids that can withstand intense duty cycles. The two-wheeler parc remains the world’s largest, where budget mineral oils still prevail, but a gradual shift toward higher specifications is visible in organized service channels.
Heavy equipment in construction, mining, and agriculture is another pivotal user, consuming hydraulic fluids that resist water contamination and extreme loads. Public infrastructure programs spur demand for excavator and crane lubricants, sustaining baseline volumes. Marine lubricants cater to India’s extensive coastline, with formulations that meet IMO mandates for low-sulfur fuel compliance. Aerospace, though a niche market, requires ultra-clean greases and turbine oils certified by the Defence Research and Development Organisation, marking an avenue for technology-led differentiation.
By Base Stock Type – Mineral Oils Retain Scale, Synthetics Capture Value
Mineral base oils still command a 67.55% share of the India lubricants market size in 2025, due to their cost advantages and wide refinery integration. Group I materials work well in legacy diesel engines and agricultural pumps, where affordability often takes precedence over performance. Semi-synthetic blends offer modest upgrades with limited polyalphaolefin content, gaining acceptance in mid-range passenger cars and taxis that seek a balance between price and protection.
Synthetics record the highest 4.41% CAGR, propelled by BS-VI emission norms and OEM factory-fill mandates. Group III and Group IV formulations provide stable viscosity across a broad temperature range, enhancing fuel economy and prolonging engine life. Bio-based stocks are embryonic but benefit from the Bureau of Indian Standards Ecomark Rule 2024, which rewards biodegradability credentials in environmentally sensitive uses. As end-users weigh total cost against uptime, synthetics are poised to expand their share of the India lubricants market.
Geography Analysis
Western India, led by Maharashtra and Gujarat, hosts clustered automotive assembly plants from Tata Motors, Maruti Suzuki, and Hyundai, making the region the single largest consumption center for engine and process oils. Port infrastructure, steel mills, and petrochemical complexes add further pull for turbine and compressor lubricants, cementing supplier focus on this corridor. Service stations here stock higher-spec 0W-20 and 5W-30 grades, mandated by factory warranties, which accelerates premium product penetration.
Tamil Nadu is emerging as a southern stronghold with integrated supply chains spanning component forging, vehicle assembly, and shipbuilding. Demand rises across engine oils, hydraulic fluids, and metalworking coolants as plants ramp up exports. Organized channel reach supports product mix diversification, including synthetics for passenger cars and factory fill for new energy vehicles.
Northern states, such as Haryana and Uttar Pradesh, contribute sizable volumes through agricultural equipment and an expanding light commercial vehicle fleet. Although brand visibility remains fragmented outside large cities, rural initiatives like BPCL’s taluka-level dealerships are widening access to genuine products. Eastern and northeastern states currently lag in consumption; however, infrastructure expansion under the Petroleum, Chemicals, and Petrochemicals Investment Regions policy is expected to boost lubricant uptake in the long term.
Regulatory Landscape
India's lubricants sector operates under the Petroleum and Natural Gas Regulatory Board (PNGRB) Act, 2006, alongside product processing and distribution controls under the Lubricating Oils and Greases (Processing, Supply and Distribution Regulation) Order, 1987. The Lubricating Oil and Greases (Processing, Supply and Distribution Regulation) Amendment Order, 2024 (notified May 3, 2024) reinforces compliance expectations across processing and supply chains, while PNGRB Technical Standards and Specifications (T4S) apply to retail outlets and associated storage and handling practices.
Technical conformity is shaped by Bureau of Indian Standards (BIS) specifications for key lubricant categories, including IS 13656:2019 for automotive crankcase oils and other active lubricant standards referenced by formulators and OEM-aligned suppliers. The Petroleum and Natural Gas Rules, 2025 (notified December 9, 2025) further tighten operational and data requirements for mineral oil operations, raising the documentation and compliance burden for participants handling base oils and finished lubricants.
Value Chain Analysis
The value chain covers base oil supply (domestic refiners plus imports), additive procurement, blending and packaging, storage at depots and distribution centers, and multi-channel distribution through oil marketing company (OMC) networks, distributors, workshops, and industrial direct sales to OEMs and plants. Public sector OMCs (IndianOil, BPCL, HPCL) anchor upstream integration and nationwide go-to-market reach via fuel retail networks, while private and multinational brands compete through premium formulations, workshop programs, and OEM partnerships.
Two structural pressure points shape operations: import reliance for higher-grade base oils and the rising compliance burden around used oil management. From April 1, 2024, Extended Producer Responsibility (EPR) obligations under the Hazardous and Other Wastes (Management and Transboundary Movement) Second Amendment Rules, 2023 require producers and importers to participate in collection and recycling ecosystems, shifting value toward players with scalable collection, traceability, and compliant recycling tie-ups. This pushes consolidation in the unorganized segment and increases the strategic importance of re-refining and certified recovery channels alongside conventional blending and distribution.
Competitive Landscape
State-owned refiners utilize their extensive fuel retail networks to distribute branded lubricants at over 70,000 filling stations nationwide. Downstream integration shields them from base-oil price volatility and supports aggressive pricing in mineral grades. Multinationals counter with premium synthetics, global OEM alliances, and digital service platforms that promise fleet uptime and reduced total cost of ownership. Regulation also reshapes competition. The 2024 Ecomark environmental label raises formulation barriers, favoring incumbents with research and development assets that can certify low toxicity and high biodegradability. Smaller blenders without additive science or rigorous quality labs may retreat to unorganized markets or consolidate. Overall, rivalry is set to intensify as firms jostle for share within the growing but evolving India lubricants market.
India Lubricants Industry Leaders
-
Indian Oil Corporation Limited
-
BP p.l.c.
-
Bharat Petroleum Corporation Limited
-
Hindustan Petroleum Corporation Limited
-
Shell plc
- *Disclaimer: Major Players sorted in no particular order
India Lubricants Market Companies Covered in this Report
- Bharat Petroleum Corporation Limited
- BP p.l.c.
- Chevron Corporation
- Exxon Mobil Corporation
- FUCHS
- Gulf Oil International Ltd
- Hindustan Petroleum Corporation Limited
- Indian Oil Corporation Limited
- MOTUL
- PETRONAS Lubricants International
- Shell plc
- TotalEnergies
- VALVOLINE INC.
- Veedol Corporation Limited
Market Opportunities and Future Outlook
Import dependence for Group II/III base stocks and premium synthetics creates whitespace for domestic base oil projects and backward integration that can stabilize feedstock availability for higher-spec formulations. A concrete example is Chennai Petroleum Corporation Limited (CPCL) beginning work in May 2026 on a Lube Oil Base Stock (LOBS) unit at Manali Refinery (investment of INR 1,600 crore) to produce about 242,000 tonnes per annum of Group II and Group III base stocks. This supports the shift toward BS-VI and OEM-recommended low-viscosity lubricants and reduces exposure to external supply disruptions.
Circularity and compliance-led collection networks also present an opportunity as EPR requirements start phasing up from FY 2024-25, favoring suppliers that can build used-oil take-back, traceability, and re-refining linkages while maintaining brand assurance in the aftermarket. Government actions that temporarily reduced cost pressures on critical petrochemical inputs through a full customs duty exemption effective until June 30, 2026 highlight active policy levers shaping downstream input economics. On the demand side, premiumization continues in automotive and industrial applications where condition monitoring and OEM-aligned service-fill programs support higher-value sales, while EV transition dynamics create adjacent needs for specialty greases and thermal-management fluids as suppliers broaden portfolios beyond conventional engine oils.
Recent Industry Developments in India Lubricants Market
- July 2026: BPCL and IFP Petro Products Pvt. Ltd signed an MoU to build a nationwide used lubricating oil (ULO) collection, traceability, and re-refining ecosystem. The collaboration aligns with tightening EPR obligations and strengthens the circular supply chain needed to improve feedstock recovery and compliance readiness for lubricant producers and importers.
- May 2026: Hindustan Petroleum Corporation Limited (HPCL) entered an agreement with LANXESS to market LANXESS-branded aviation and industrial lubricants across India and the SAARC region. The tie-up expands HPCL's addressable premium industrial portfolio and adds branded specialization in segments where certification and performance assurance influence procurement.
- August 2024: Indian Oil Corporation Limited (IndianOil) and Rashtriya Ispat Nigam Limited (RINL) signed a five-year arrangement for the supply of hydraulic and lubricating oils and greases for 2024-2029. The agreement supports longer-tenure industrial offtake and reinforces IndianOil's position in large industrial accounts where reliability and technical service drive repeat volumes.
India Lubricants Market Report Scope and Research Methodology
Market Definition and Coverage
For this study, the market covers finished lubricants consumed in India across automotive and industrial use, measured primarily in volume (liters) and then interpreted through product mix and use intensity across major end users.
Scope exclusions: We exclude greases and adjacent fluids that are sold as coolants or other automotive chemicals when they are not marketed and used as lubricants.
Segments Covered in This Report
- By Product Type
- Automotive Engine Oil
- Industrial Engine Oil
- Transmission Fluids
- Gear Oil
- Brake Fluids
- Hydraulic Fluids
- Greases
- Process Oil (Including Rubber Process Oil and White Oil)
- Metalworking Fluids
- Turbine Oil
- Transformer Oil
- Other Product Types
- By End-user Industry
- Automotive
- Passenger Vehicles
- Commercial Vehicles
- Two-Wheelers
- Marine
- Aerospace
- Heavy Equipment
- Construction
- Mining
- Agriculture
- Industrial
- Power Generation
- Metallurgy and Metalworking
- Textiles
- Oil and Gas
- Other End-Use Industries
- Automotive
- By Base Stock Type
- Mineral Oil-Based Lubricants
- Synthetic Lubricants
- Semi-Synthetic Lubricants
- Bio-Based Lubricants
Data Sources, Market Sizing, and Validation
Desk Research
Desk work sets the guardrails for demand pools and realistic growth drivers in India. We start with public datasets that explain lubricant usage, such as vehicle registrations and parc signals, refinery and base oil information, and industrial production trends.
Sources used include, for example, the Ministry of Road Transport and Highways for vehicle indicators, Petroleum Planning and Analysis Cell for petroleum and related statistics, Society of Indian Automobile Manufacturers for production and sales releases, and government trade data for import and export checks on base oils and additives. We also review BIS notifications and other public regulatory updates that influence drain intervals and product specifications, and we validate context using company filings, investor presentations, and reputed business press. For market mapping and quicker company-level sanity checks, a paid subscription covering lubricant specific information and pricing details was also used. These are illustrative sources, and many other public and paid references were used to collect data, cross check, and clarify assumptions.
Primary Interviews and Surveys
Primary conversations were used to confirm what the desk signals cannot fully show, especially for product mix, channel margins, and how quickly synthetics and semi synthetics are adopted. We spoke with stakeholders across the value chain, including blenders, base oil and additive suppliers, distributors, workshop level buyers, and industrial procurement teams, and coverage was kept balanced across key demand clusters in North, West, South, and East India.
Distribution of primary research fieldwork respondents
| Company type | Respondent position |
|---|---|
| Top tier: 31% | CXOs: 21% |
| Mid tier: 47% | Functional/Unit leaders: 19% |
| Smaller Players: 22% | Managers: 60% |
Market-Sizing & Forecasting
The core model uses a top-down build where vehicle parc signals and industrial activity indicators are translated into lubricant consumption, and then adjusted by drain interval behavior and product type split. Once the demand pool is formed, it is further filtered through product categories (such as engine oils, transmission fluids, hydraulic fluids, metalworking fluids, turbine oils, and process oils) to avoid double counting between automotive and industrial uses.
To keep totals grounded, we corroborate results with selective bottom-up approximations, including channel checks on pack sizes and turnover, and sampled volume by average selling price logic for a few high visibility categories. Inputs that matter most in India include commercial vehicle and two wheeler parc movement, freight and fleet utilization trends, BS-VI related specification shifts that change oil change frequency, industrial production momentum in sectors that are lubricant intensive, and the share shift toward synthetic and semi synthetic grades. For forecasting, scenario analysis is used with a base case guided by primary feedback on drain interval trends, premiumization pace, and industrial capex timing, and any data gaps in smaller end uses are handled through conservative intensity factors that are revisited during validation.
Data Validation & Update Cycle
Validation is done through multiple checks so the final totals do not rely on a single assumption. Model outputs are compared with independent signals like vehicle parc direction, base oil availability and trade movements, and category level consumption patterns shared by market participants, and then anomalies are investigated until the drivers are understood.
Before sign off, the work is reviewed in steps by another analyst, with variance checks at category and end use level so outliers become visible. Reports are refreshed annually, and interim updates are triggered when material events occur, such as major regulation changes, sharp base oil price moves, or demand shocks in key industries. Right before delivery, we do a final pass on recent public releases and re contact experts if a key input has shifted.
Mordor Intelligence's India Lubricants Market Estimate Compared With Other Published Estimates
Published numbers for India lubricants can look far apart because not everyone measures the same thing, and some reports mix value and volume without stating the price logic behind the conversion. Differences also come from what is counted as lubricants versus adjacent automotive chemicals, and whether the scope is finished lubricants only or includes parts of the base oil chain.
Vehicle parc direction, PPAC-linked petroleum statistics, and import and export checks are the anchors that keep Mordor Intelligence's estimate tied to finished lubricant consumption in India, which is then split by product type and refined through drain interval behavior. When other estimates are value led, the spread often comes from assumed average selling prices, the treatment of industrial lubricants versus total lubricants, and how frequently the base year is refreshed for inflation and mix shift.
Benchmark comparison
| Source | Market Size | Gaps in Research Methodology |
|---|---|---|
| Mordor Intelligence | USD 5.60 B (2025) | |
| Regional Consultancy A | USD 7.20 B (2024) | Uses a value-first view and an earlier base year, which can embed different average selling prices and premiumization assumptions, and it is not always clear how industrial lubricants and adjacent fluids are separated. |
| Trade Journal B | USD 13.05 B (2024) | Focuses on industrial lubricants only and reports in value terms, which tends to inflate totals when compared against an all-lubricants volume anchor and when the price deck and channel margins are not stated. |
The comparison shows that most gaps are explained by scope boundaries and price conversion choices, not by a single demand assumption. By keeping the demand pool traceable to parc and industrial activity signals, and then applying clear product and use rules, the final market size remains easier to reproduce and update when new public indicators come in.
Key Questions Answered in the Report
What is the size of the India lubricants market in 2026?
The market is expected to stand at 5.77 billion liters in 2026 and is projected to reach 6.73 billion liters by 2031.
Which segment holds the largest share of the India lubricants market today?
Automotive engine oil remains the leading segment, accounting for a 41.95% share in 2025.
What is the forecast CAGR for automotive lubricant demand?
Automotive applications are expected to grow at a 5.16% CAGR through 2031.
Why are synthetic lubricants gaining traction?
BS-VI and CAFE regulations, longer drain intervals, and OEM recommendations are boosting demand for synthetics, which are projected to post a 4.41% CAGR.
Which region consumes the most lubricants in India?
Western India, particularly Maharashtra and Gujarat, leads in consumption due to its dense automotive and industrial clusters.
How will electric vehicles affect lubricant demand?
EVs will cut engine oil volumes over time, yet they create new needs for thermal management fluids and specialty greases that offset part of the decline.