
In-Vivo Imaging Market Size and Share
Market Overview
| Study Period | 2020 - 2031 |
|---|---|
| Market Size (2026) | USD 1.34 Billion |
| Market Size (2031) | USD 2.19 Billion |
| Growth Rate (2026 - 2031) | 10.36% CAGR |
| Fastest Growing Market | Asia-Pacific |
| Largest Market | North America |
| Market Concentration | Medium |
Major Players *Disclaimer: Major Players sorted in no particular order Image © Mordor Intelligence. Reuse requires attribution under CC BY 4.0. | |
In-Vivo Imaging Market Analysis by Mordor Intelligence
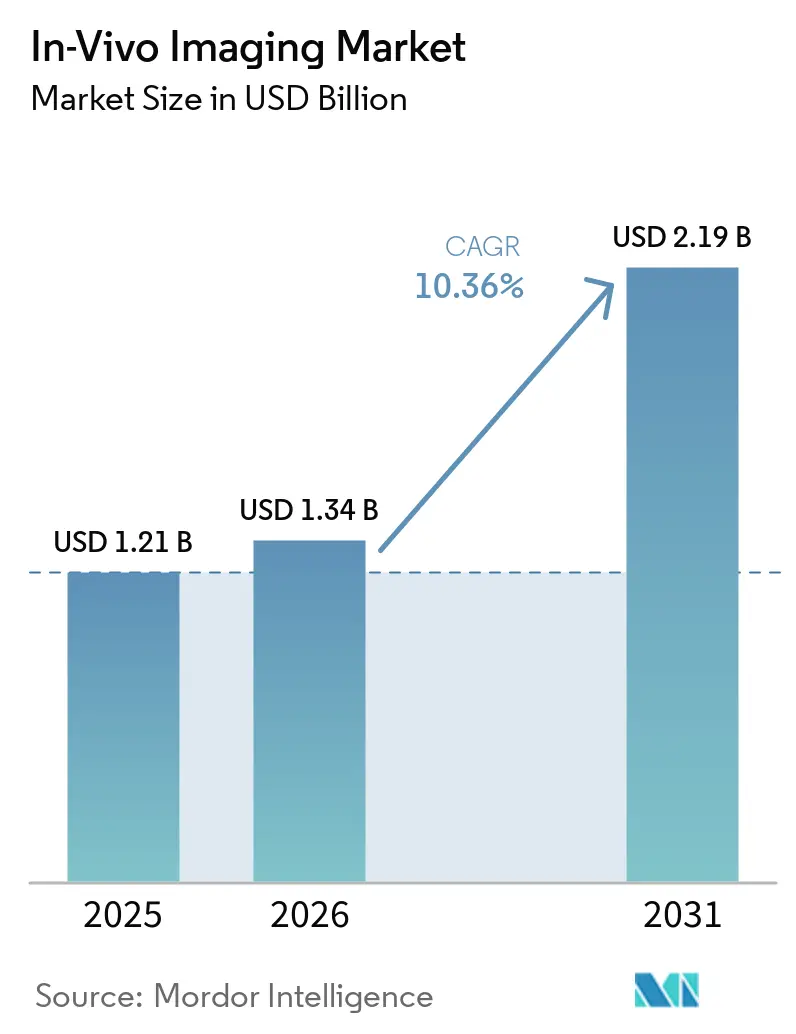
The In-Vivo Imaging Market size was valued at USD 1.21 billion in 2025 and is estimated to grow from USD 1.34 billion in 2026 to reach USD 2.19 billion by 2031, at a CAGR of 10.36% during the forecast period (2026-2031).
The in-vivo imaging market is benefiting from broader and more complex drug-development programs, especially in oncology, neurodegeneration, cell therapy, and gene therapy. Sponsors increasingly use imaging to assess pharmacokinetics, biodistribution, and disease progression before first-in-human studies. This use makes imaging a practical decision tool rather than a supporting observation method. Platform suppliers are expanding hardware portfolios with software, probes, and service models to capture recurring revenue. The in-vivo imaging market also has opportunities in quantitative biomarkers and multimodal workflows that produce anatomical, functional, and molecular evidence in one study.
Key Report Takeaways
- By modality, optical imaging systems held 32.47% of modality revenue in 2025, while photoacoustic imaging systems are forecast to grow at a 10.89% CAGR through 2031 in the in-vivo imaging market.
- By reagents, nuclear imaging reagents held 33.58% of reagent revenue in 2025, while optical imaging reagents are forecast to grow at an 11.23% CAGR through 2031.
- By techniques, radioisotopes-based techniques held 42.79% of the in-vivo imaging market size in 2025, while biomarkers-based techniques are forecast to grow at an 11.94% CAGR through 2031.
- By end user, hospitals and clinics held 42.16% of the in-vivo imaging market share in 2025, while research organizations are forecast to grow at a 12.63% CAGR through 2031.
- By geography, North America commanded 36.16% of the in-vivo imaging market in 2025; Asia-Pacific is forecast to register a 13.51% CAGR through 2031.
Note: Market size and forecast figures in this report are generated using Mordor Intelligence’s proprietary estimation framework, updated with the latest available data and insights as of January 2026.
Global In-Vivo Imaging Market Trends and Insights
Drivers Impact Analysis*
| Driver | (~) % Impact on CAGR Forecast | Geographic Relevance | Impact Timeline |
|---|---|---|---|
| Expansion of Biopharma R&D Pipelines and Preclinical Study Complexity | +2.5% | Global, with concentrated gains in North America and China | Medium term (2-4 years) |
| Shift Toward Non-Invasive Longitudinal Imaging | +1.5% | North America and Europe, with spillover to Asia-Pacific | Medium term (2-4 years) |
| Adoption of Multimodal Hybrid Imaging | +1.8% | Global, with early gains in Germany, the United States, and Japan | Long term (≥ 4 years) |
| Rising Demand for Quantitative Translational Biomarkers | +1.1% | North America and the European Union | Long term (≥ 4 years) |
| AI-Enabled Image Segmentation and Analysis | +1.3% | Global | Short term (≤ 2 years) |
| Recurring Revenue From Probes, Software, and Imaging Services | +0.9% | Global, with early adoption in North America and Europe | Short term (≤ 2 years) |
| Source: Mordor Intelligence | |||
Expansion of Biopharma R&D Pipelines and Preclinical Study Complexity
Biopharma research activity remained resilient through 2025, and global clinical and preclinical pipeline volumes grew at high-single-digit annual rates from 2020. The in-vivo imaging market gains from this activity because oncology, gene therapy, and cell therapy programs need several preclinical endpoints. Imaging supports pharmacokinetics, biodistribution, and repeated disease monitoring within the same animal cohort. IQVIA reported 79 novel active substances launched globally in 2025 and expects an annual average of 70-80 through 2030. China’s larger pipeline contribution is also increasing demand for preclinical imaging capacity in Asian contract research organizations. More complex programs can require more imaging sessions per candidate, which supports demand even when pipeline volumes vary.
Shift Toward Non-Invasive Longitudinal Imaging
Non-invasive longitudinal imaging aligns with the 3Rs principles reflected in European animal-research rules and the U.S. Animal Welfare Act. The in-vivo imaging market, therefore, benefits from methods that allow repeated, minimally stressful imaging in the same animal. Optical bioluminescence, micro-MRI, and photoacoustic systems can support these repeated assessments. A 2025 peer-reviewed review identified fluorescence and bioluminescence as widely used longitudinal tools because of their ease of use, accessible instrumentation, and range of applications.[1]“Validation of an Automated AI-Based Micro-CT Organ Segmentation Workflow Against Expert Annotations and Its Impact on Fluorescence Quantification,” Longitudinal designs can reduce animal numbers per study while increasing the number of sessions for each surviving animal. This pattern can protect probe and consumable demand even as study cohorts become smaller.
Adoption of Multimodal Hybrid Imaging
Hybrid systems such as PET/SPECT-CT, PET/MRI, and optical-ultrasound combinations are moving into broader use at contract research facilities. A 2025 multi-site study showed that a multimodal cradle inlay could co-register BLI, PET, micro-CT, and MRI in a metastatic colorectal cancer mouse model. The workflow brought tumor distribution, metabolic activity, inflammation, and margin assessment into one study design. Such datasets can give sponsors anatomical, functional, and molecular evidence at the same time. Bruker commissioned a BioSpec 18 Tesla preclinical MRI at the Champalimaud Foundation in May 2026, which the company described as the highest-field horizontal-bore preclinical MRI. Higher system performance and AI-supported analysis may reduce the operational barrier that previously limited multimodal imaging to specialized sites.
Rising Demand for Quantitative Translational Biomarkers
Drug sponsors need measurable evidence that can connect preclinical findings with clinical development decisions. The in-vivo imaging market supports this need through imaging biomarkers that track biological activity over time. Quantitative biomarkers can provide pharmacodynamic endpoints for studies that need more than structural images. The FDA and European Medicines Agency's interest in qualified imaging biomarkers gives these methods a stronger development role. Biomarker-led imaging can also help sponsors compare candidate therapies using repeatable measures. This demand favors platforms that combine validated acquisition methods with consistent quantitative analysis.
Restraints Impact Analysis*
| Restraint | (~) % Impact on CAGR Forecast | Geographic Relevance | Impact Timeline |
|---|---|---|---|
| High Capital, Maintenance, and Qualification Costs | -1.3% | Global, most acute in the Middle East, Africa, and South America | Long term (≥ 4 years) |
| Stringent Preclinical and Animal-Research Regulations | -0.8% | European Union and North America | Medium term (2-4 years) |
| Proprietary Isotope, Probe, and Detector Supply Dependencies | -0.6% | Global, concentrated among nuclear-modality buyers | Medium term (2-4 years) |
| Reproducibility, Protocol Standardization, and Skilled-Operator Gaps | -0.5% | Global, most severe in lower-resource research settings | Short term (≤ 2 years) |
| Source: Mordor Intelligence | |||
High Capital, Maintenance, and Qualification Costs
Capital cost remains a major barrier to adoption outside North America and Europe. A multimodal suite that combines PET/SPECT, micro-MRI, and optical imaging can require multi-million-dollar investment before qualification activities. Installation, operational, and performance qualification add to the system cost. Contract research organizations also need documentation that meets sponsor-specific good laboratory practice requirements. These needs create costs that equipment prices alone do not show. Subscription and per-scan models respond to the constraint, although use remains concentrated among larger organizations that can manage these contracts.
Stringent Preclinical and Animal-Research Regulations
Compliance with EU Directive 2010/63/EU and U.S. animal-research oversight can increase procedural costs and extend study timelines. Smaller organizations can face greater difficulty because they may lack dedicated regulatory support. Repeated anesthesia in longitudinal studies may require additional ethical approval documentation. This requirement can slow the use of designs that otherwise align with the 3Rs principles. International guidance for preclinical radiopharmaceutical studies also identifies inconsistent dosing, acquisition, and analysis protocols as barriers to pooling data across institutions.[2]International Atomic Energy Agency, “Guidance for Preclinical Studies With Radiopharmaceuticals,” International Atomic Energy Agency, iaea.org These gaps can weaken the translational evidence used in biomarker qualification.
*Our forecasts treat driver/restraint impacts as directional, not additive. The impact forecasts reflect baseline growth, mix effects, and variable interactions.
Segment Analysis
By Modality: Optical Imaging Leads While Photoacoustic Systems Grow Fastest
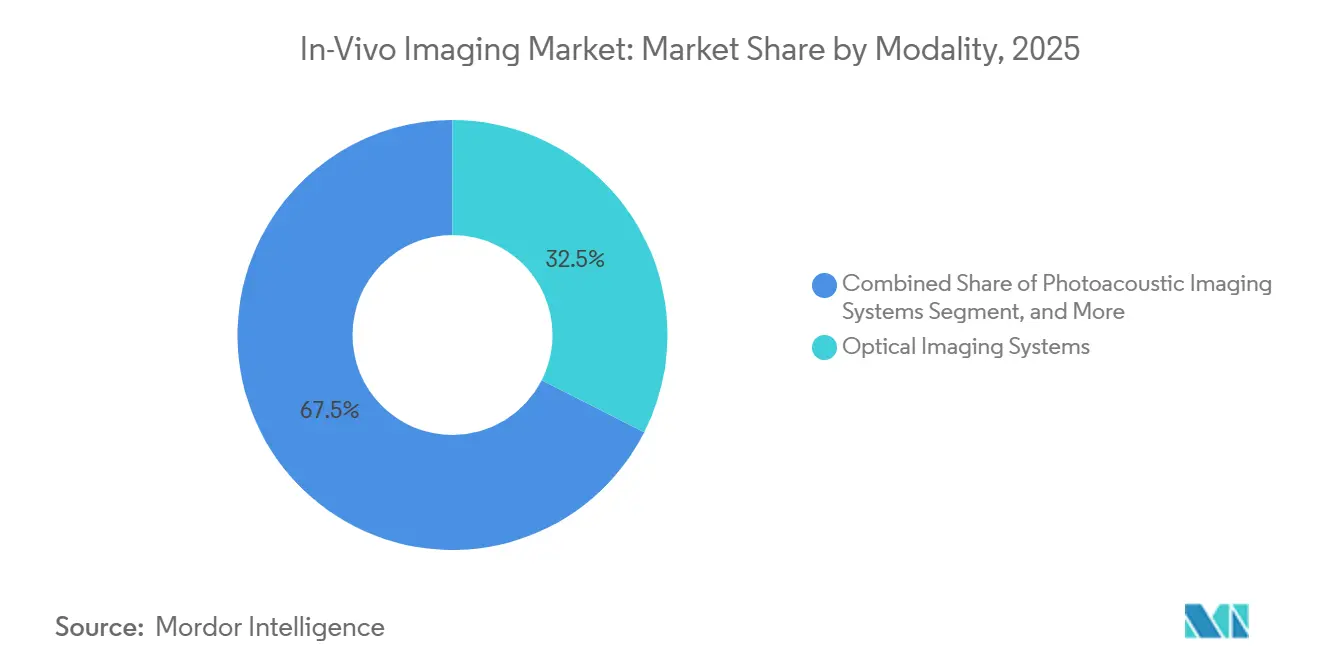
Optical imaging systems held 32.47% of modality revenue in 2025, placing them ahead of other modalities in the in-vivo imaging market. Bioluminescence and fluorescence workflows have been deployed widely for many years. Their position rests on lower per-session consumable costs and compatibility with available reporter constructs. They also have simpler operating requirements than nuclear imaging or MRI systems. Nuclear imaging held the second-largest position because PET and SPECT provide quantitative readouts for radiopharmaceutical biodistribution studies. Micro-MRI and micro-ultrasound address more focused needs for soft-tissue contrast and real-time cardiovascular phenotyping.
Photoacoustic imaging systems are forecast to expand at a 10.89% CAGR through 2031, the fastest rate among modality segments. Their capability to provide real-time, non-ionizing, high-resolution vascular and oxygenation information distinguishes them from conventional optical imaging. A 2025 review found that dual photoacoustic and ultrasound systems can provide B-mode, color Doppler, and elastography views for tissue assessment.[3] Benoît Arnal et al., “Dual Photoacoustic/Ultrasound Technologies for Preclinical Research: Current Status and Future Trends,” FUJIFILM VisualSonics launched the Vevo F2 LAZR-X20 platform in June 2025 with a 660-1,320 nm wavelength range for detecting tissue chromophores, including lipids and collagen. Magnetic particle imaging and multimodal cradle-based co-registration systems remain early-stage alternatives. Radioactive tracer workflows can also require radiopharmacy infrastructure, which affects modality selection.



By Reagents: Nuclear Reagents Retain Scale While Optical Probes Expand
Nuclear imaging reagents held 33.58% of reagent revenue in 2025, reflecting the established use of PET and SPECT tracers. The group includes 18F-FDG, 68Ga-labeled peptides, and 99mTc-based compounds used in pharmacokinetic and target-engagement studies. The in-vivo imaging market size for this segment reflects the long-standing role of nuclear methods in quantitative research. MRI, ultrasound, and CT contrast agents support distinct protocols. MRI contrast development is moving toward nanoparticle-based targeted agents that can improve tissue specificity beyond conventional gadolinium formulations. The range of reagent types allows facilities to match agents with modality and biological target.
Optical imaging reagents are forecast to grow at an 11.23% CAGR through 2031. Near-infrared fluorophores, activatable probes, and self-illuminating luciferase systems support greater depth and lower autofluorescence background. These reagents can also enable multiplexed molecular readouts in one imaging session. A 2025 review noted that NIH S10 grants and comparable European mechanisms supported shared optical imaging core facilities at academic medical centers. Multi-spectral unmixing algorithms can separate overlapping fluorescent signals across 4 or more channels. FDA attention to fluorescence-based probes for pharmacodynamic endpoint validation adds a regulatory reason for their use.
By Techniques: Radioisotope Methods Lead While Biomarker-Based Methods Advance
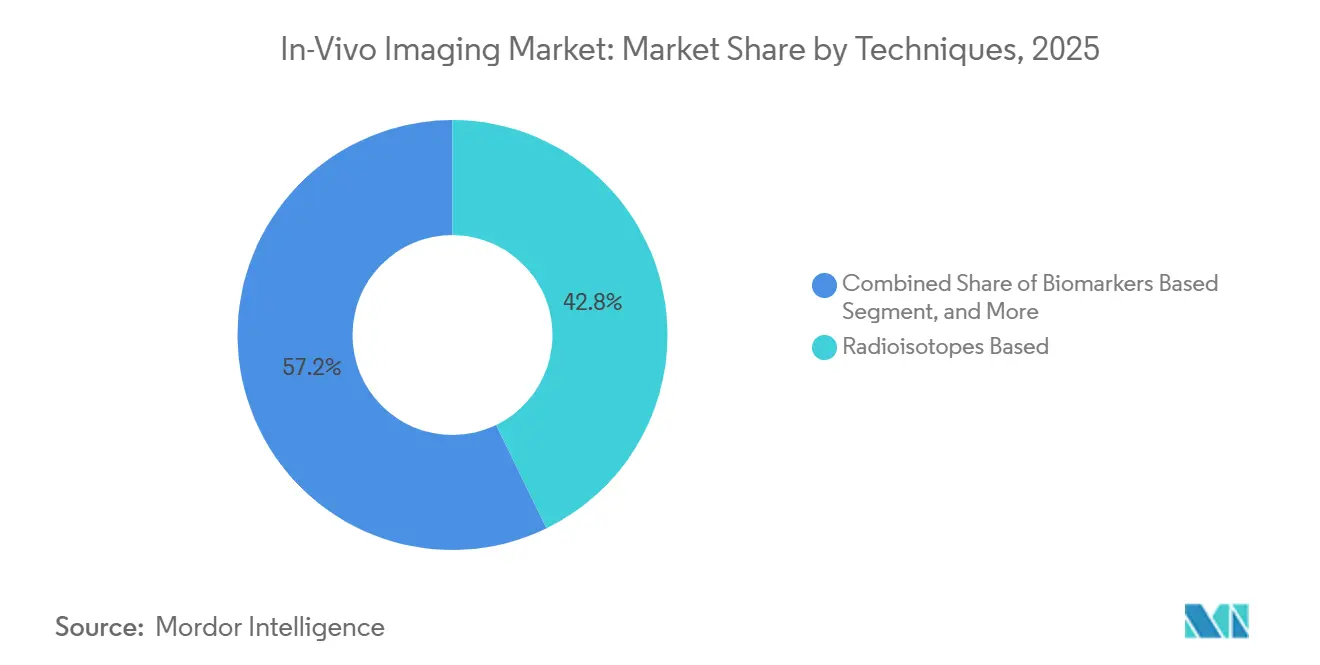
Radioisotopes-based techniques held 42.79% of technique revenue in 2025, the largest share across this segmentation. The in-vivo imaging market continues to rely on established PET and SPECT pharmacokinetic methods. Their position is supported by isotope production and distribution networks in North America and Europe. They also have deep precedent in investigational new drug and new drug application programs. Luminescent protein-based techniques provide a complementary method for tracking cell viability and gene expression over time. These techniques support immuno-oncology and viral-vector biodistribution studies with low background signal.
Biomarker-based techniques are forecast to grow at an 11.94% CAGR through 2031. The FDA and European Medicines Agency's interest in imaging biomarkers supports their use as pharmacodynamic endpoints in investigational new drug submissions. A 2026 study demonstrated integrin αvβ6-targeted PET imaging for mapping epithelial remodeling in preclinical MASH models, with ex vivo human liver biopsy analysis supporting translational relevance. Thermo Fisher Scientific announced a January 2026 collaboration with NVIDIA to advance AI-driven scientific instrumentation. This effort addresses the computational workload in biomarker image analysis. Photoacoustic molecular imaging and Raman-based in-vivo probes remain smaller technique areas with growing academic research interest.
By End User: Hospitals and Clinics Lead While Research Organizations Grow Faster
Hospitals and clinics contributed 42.16% of end-user revenue in 2025, giving them the leading share of the in-vivo imaging market size. Their role combines translational research capacity with clinical-grade diagnostic infrastructure. Imaging centers occupy a middle position, especially in nuclear imaging, where centralized radiopharmacy logistics can support a hub-and-spoke model. The other category includes veterinary research institutions and government defense-related biomedical programs. These users provide steady, though undisclosed, activity. Hospital and clinic demand remains tied to the availability of advanced facilities and trained personnel.
Research organizations are forecast to grow at a 12.63% CAGR through 2031, the fastest rate among end users. This group includes academic medical centers, specialist contract research organizations, and nonprofit research institutes. Pharmaceutical sponsors are outsourcing more early-discovery and investigational new drug-enabling work, encouraging contract research organizations to invest in multimodality suites. Shared imaging core facilities supported by NIH S10 grants and comparable European programs also broaden access to advanced platforms. Research organizations generate many of the imaging biomarker datasets that regulators are beginning to use in qualification frameworks. This position makes them a key source of demand for next-generation reagents and AI analysis tools in the in-vivo imaging industry.
Geography Analysis
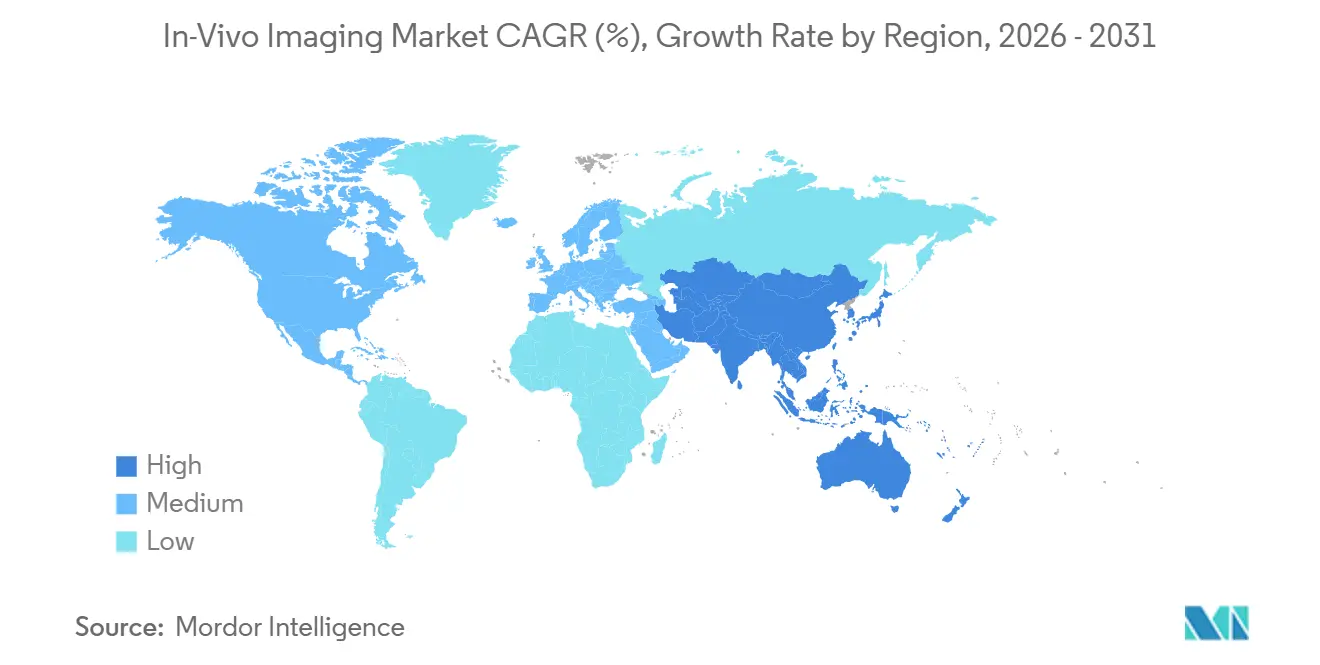
North America held 36.16% of the 2026 in-vivo imaging market revenue, supported by the United States’ concentration of publicly funded research centers, pharmaceutical and biotechnology research campuses, and contract research organizations. Canada contributes a growing base in oncology and neuroscience research. Mexico remains an earlier-stage national market. Revenue generation in the region is shifting toward imaging-as-a-service and per-scan models. This shift moves more revenue from equipment sales toward integrated service providers. The FDA Biomarker Qualification Program supports demand for platforms that can produce quantitative data suitable for submissions.
Asia-Pacific is forecast to grow at a 13.51% CAGR from 2026 to 2031, nearly 3 percentage points above the global rate. China is adding preclinical research capacity and is a central demand center in the region. The Chinese government announced funding for 5 new high-resolution micro-CT scanner development programs in 2025, supporting domestic manufacturing capability. Japan’s AMED allocated JPY 8.4 billion, equivalent to USD 56 million, for regenerative medicine imaging programs in 2025. India, South Korea, and Australia also add research infrastructure and academic-industry collaborations. This broad base makes the region’s in-vivo imaging market opportunity wider than China alone.
Europe holds the second position in the in-vivo imaging market, with Germany, the United Kingdom, and France supporting multi-institutional imaging networks. Germany’s Helmholtz Association and United Kingdom Medical Research Council-funded networks help stabilize public-sector procurement. EU Directive 2010/63/EU encourages longitudinal study design while increasing compliance requirements for operators. The Middle East, Africa, and South America remain at earlier stages of adoption. GCC sovereign health investment funds are beginning to support biomedical research infrastructure. Brazil’s regulatory alignment with FDA standards could support São Paulo research clusters as Latin American hubs for imaging-intensive preclinical work. The in-vivo imaging market could benefit if these clusters gain wider access to qualified equipment, radiopharmacy support, and specialized operators.

Competitive Landscape
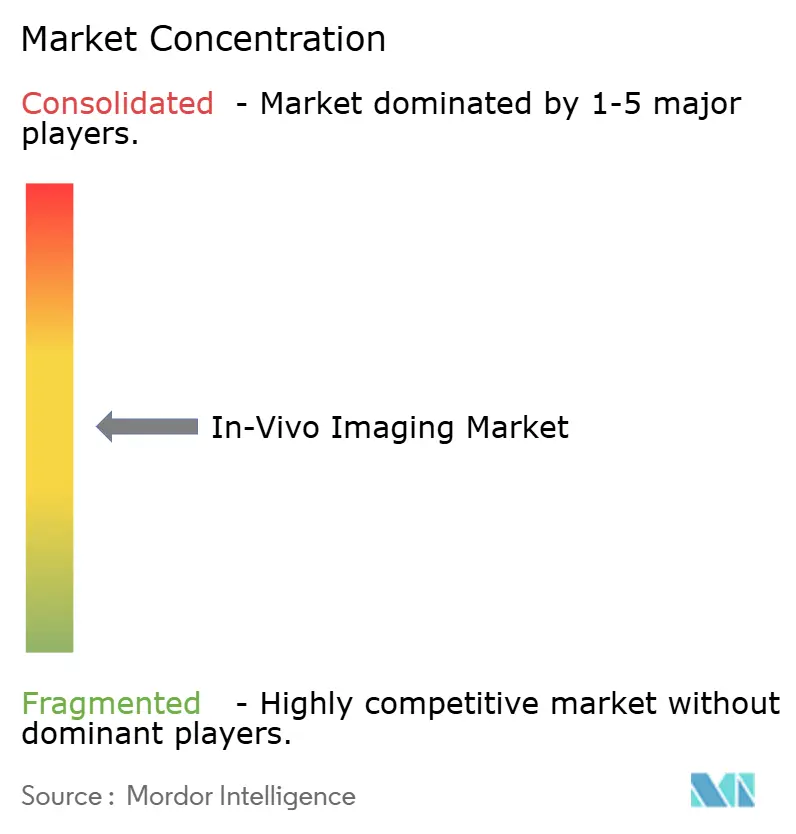
The in-vivo imaging market has moderate concentration in premium systems and more fragmented competition in reagents and software. Bruker, Revvity, FUJIFILM VisualSonics, Siemens, and Philips compete at the integrated-platform level. These companies seek to add consumables and software revenue to hardware sales. Bruker acquired Spectral Instruments Imaging in February 2024 to add bioluminescence and fluorescence imaging to its preclinical portfolio. Bruker also commissioned the BioSpec 18 Tesla preclinical MRI at the Champalimaud Foundation in May 2026. These actions combine portfolio expansion with high-performance hardware positioning.
Mediso, MILabs, MR Solutions, Aspect Imaging, and Trifoil Imaging compete in the nuclear and MRI niches within the in-vivo imaging market. Their modular configurations and lower total-cost-of-ownership propositions can appeal to capital-constrained research institutions. AI-powered quantitative analysis, targeted molecular probes, and imaging-as-a-service models remain important opportunity areas. Revvity launched Living Image Synergy AI in September 2025 for multimodal analysis across optical, micro-CT, ultrasound, and other modalities. Independent software suppliers and AI startups remain alternatives for organizations that need platform-neutral tools. These firms compete where data analysis has historically required specialized informatics capacity.
Thermo Fisher Scientific and Miltenyi Biotec compete in reagents and consumables through broad distribution networks and catalog depth. Hardware-focused suppliers may find these areas difficult to match without additional channel investment. LI-COR, CMR Naviscan, and SCANCO Medical retain specific positions in near-infrared fluorescence, specialty optical scanning, and dental-bone imaging. Targeted radiotracer chemistry is also an active area of competition. New 68Ga and 18F prosthetic groups for PET imaging show the importance of chemistry alongside equipment integration. The in-vivo imaging industry therefore includes both large platform suppliers and specialized companies that compete through modality, application, or reagent expertise. The in-vivo imaging market remains open to focused competitors that solve workflow problems within a defined research application.
In-Vivo Imaging Industry Leaders
FUJIFILM Holdings America Corporation
Hitachi, Ltd.
Koninklijke Philips N.V
PerkinElmer Inc.
Thermo Fisher Scientific Inc.
- *Disclaimer: Major Players sorted in no particular order

Recent Industry Developments
- May 2026: Bruker commissioned the BioSpec 18 Tesla preclinical MRI at the Champalimaud Foundation in Lisbon, Portugal, the world's highest-field horizontal-bore MRI system. The 18T system enables ultra-high-resolution magnetic resonance spectroscopic imaging of tissue microstructure and localized metabolism, supporting cancer metastasis and brain plasticity research in preclinical models and positioning Bruker as the field-strength leader in academic high-performance preclinical MRI.
- March 2026: Thermo Fisher Scientific completed the acquisition of Clario Holdings, Inc., adding clinical trial technology and eClinical solutions to its life science platform. While primarily a clinical data-management asset, the deal strengthens Thermo Fisher's ability to bridge preclinical imaging data with clinical endpoint management, a capability gap that has historically slowed biomarker translation workflows.
- January 2026: Thermo Fisher Scientific announced a strategic collaboration with NVIDIA to advance AI-driven scientific instrumentation and accelerate laboratory performance. The partnership is directly relevant to preclinical imaging data analysis pipelines, where computational bottlenecks, particularly in high-resolution micro-CT and PET reconstruction, represent a leading throughput constraint.


Global In-Vivo Imaging Market Report Scope
As per the scope of the report, in‑vivo imaging refers to non‑invasive techniques that allow visualization of biological processes inside a living organism in real time. It enables researchers and clinicians to monitor anatomy, cellular activity, disease progression, and therapeutic responses without disrupting the natural biological environment.
The in‑vivo imaging market is segmented by modality, reagents, techniques, end user, and geography. By modality, the market is segmented into optical imaging systems, nuclear Imaging Systems, micro-MRI, micro-ultrasound, and photoacoustic imaging systems, and others. By reagents, the market is segmented into optical imaging reagents, nuclear imaging reagents, MRI contrast agents, ultrasound contrast agents, CT contrast agents, and others. By techniques, the market is segmented into radioisotopes, biomarkers, luminescent proteins, and others. By end user, the market is segmented into hospitals and clinics, imaging centers, research organizations, and others. The geography segment is further divided into North America, Europe, Asia-Pacific, the Middle East and Africa, and South America. The report also covers the estimated market sizes and trends for 17 countries across major regions globally. The report offers the market size and forecasts in value (USD) for the above segments.
| Optical Imaging Systems |
| Nuclear Imaging Systems |
| Micro-MRI |
| Micro-Ultrasound |
| Photoacoustic Imaging Systems |
| Others |
| Optical Imaging Reagents |
| Nuclear Imaging Reagents |
| MRI Contrast Agents |
| Ultrasound Contrast Agents |
| CT Contrast Agents |
| Others |
| Radioisotopes |
| Biomarkers |
| Luminescent Proteins |
| Others |
| Hospitals and Clinics |
| Imaging Centers |
| Research Organizations |
| Others |
| North America | United States |
| Canada | |
| Mexico | |
| Europe | Germany |
| United Kingdom | |
| France | |
| Italy | |
| Spain | |
| Rest of Europe | |
| Asia-Pacific | China |
| India | |
| Japan | |
| Australia | |
| South Korea | |
| Rest of Asia-Pacific | |
| Middle East and Africa | GCC |
| South Africa | |
| Rest of Middle East and Africa | |
| South America | Brazil |
| Argentina | |
| Rest of South America |
| By Modality | Optical Imaging Systems | |
| Nuclear Imaging Systems | ||
| Micro-MRI | ||
| Micro-Ultrasound | ||
| Photoacoustic Imaging Systems | ||
| Others | ||
| By Reagents | Optical Imaging Reagents | |
| Nuclear Imaging Reagents | ||
| MRI Contrast Agents | ||
| Ultrasound Contrast Agents | ||
| CT Contrast Agents | ||
| Others | ||
| By Techniques | Radioisotopes | |
| Biomarkers | ||
| Luminescent Proteins | ||
| Others | ||
| By End User | Hospitals and Clinics | |
| Imaging Centers | ||
| Research Organizations | ||
| Others | ||
| By Geography | North America | United States |
| Canada | ||
| Mexico | ||
| Europe | Germany | |
| United Kingdom | ||
| France | ||
| Italy | ||
| Spain | ||
| Rest of Europe | ||
| Asia-Pacific | China | |
| India | ||
| Japan | ||
| Australia | ||
| South Korea | ||
| Rest of Asia-Pacific | ||
| Middle East and Africa | GCC | |
| South Africa | ||
| Rest of Middle East and Africa | ||
| South America | Brazil | |
| Argentina | ||
| Rest of South America | ||


Key Questions Answered in the Report
What is the projected value of the in-vivo imaging market by 2031?
The in-vivo imaging market is forecast to reach USD 2.19 billion by 2031, from USD 1.34 billion in 2026, at a 10.36% CAGR. Growth is tied to more complex preclinical work in oncology, neurodegeneration, cell therapy, and gene therapy.
Which in-vivo imaging modality is growing the fastest?
Photoacoustic imaging systems are forecast to grow at a 10.89% CAGR through 2031, the fastest rate among modalities. They provide real-time vascular and oxygenation data without ionizing radiation.
Which reagent type is expected to grow fastest through 2031?
Optical imaging reagents are projected to grow at an 11.23% CAGR through 2031, supported by near-infrared fluorophores and multiplexed readouts. These reagents can improve imaging depth and reduce autofluorescence background.
Why are research organizations becoming important buyers of preclinical imaging systems?
Research organizations are forecast to grow at a 12.63% CAGR because sponsors are outsourcing early-stage studies and shared imaging facilities expand access. They also generate imaging biomarker datasets used in emerging qualification frameworks.
Which region presents the strongest growth opportunity through 2031?
Asia-Pacific is forecast to grow at a 13.51% CAGR, supported by expanding research infrastructure in China, Japan, India, South Korea, and Australia.
How does AI affect preclinical imaging workflows?
AI can reduce segmentation time, support consistency across modalities, and lower dependence on manual image annotation. A cited study completed whole-body mouse micro-CT segmentation in 4 minutes, compared with 28-32 minutes for manual annotation.
Page last updated on:






