Hydroquinone Market Size and Share
Market Overview
| Study Period | 2021 - 2031 |
|---|---|
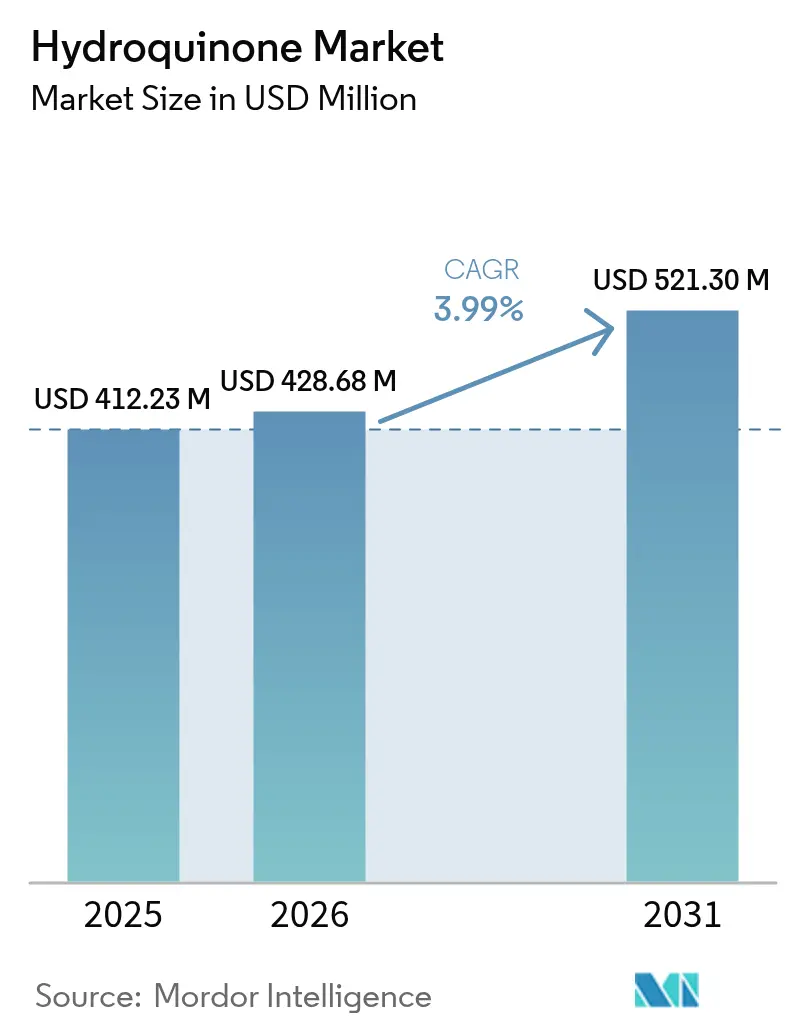
| Market Size (2026) | USD 428.68 Million |
| Market Size (2031) | USD 521.30 Million |
| Growth Rate (2026 - 2031) | 3.99% CAGR |
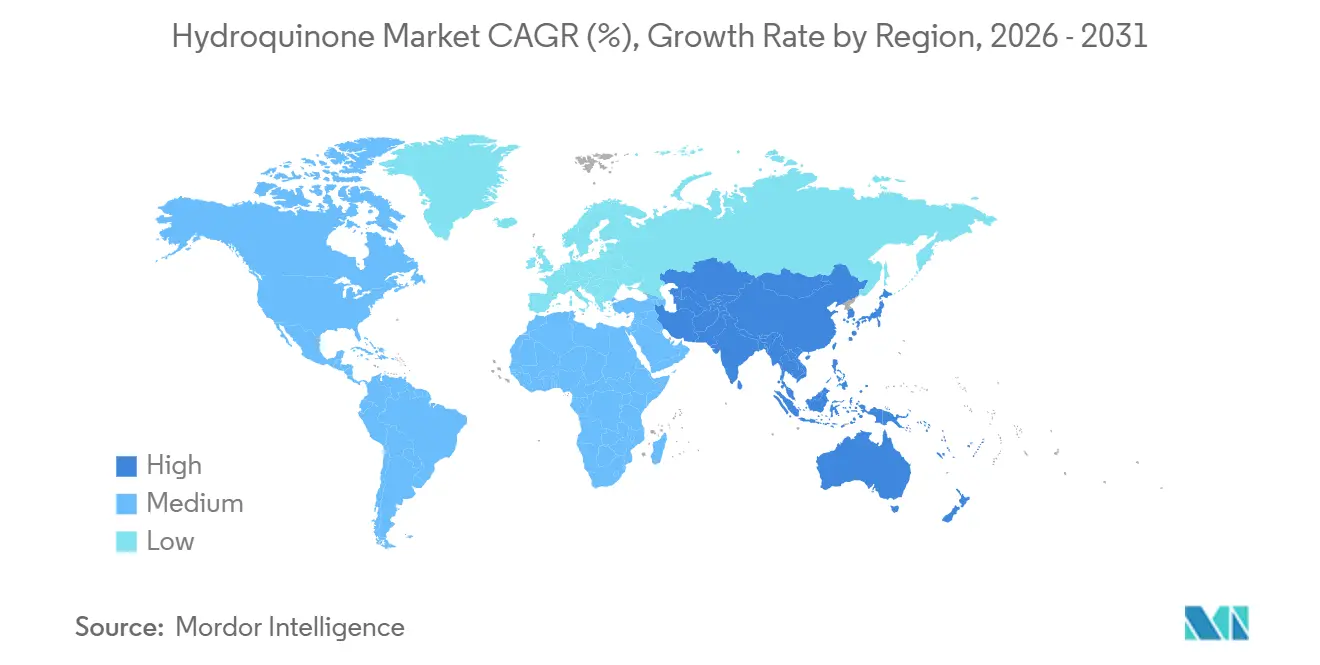
| Fastest Growing Market | Asia-Pacific |
| Largest Market | Asia-Pacific |
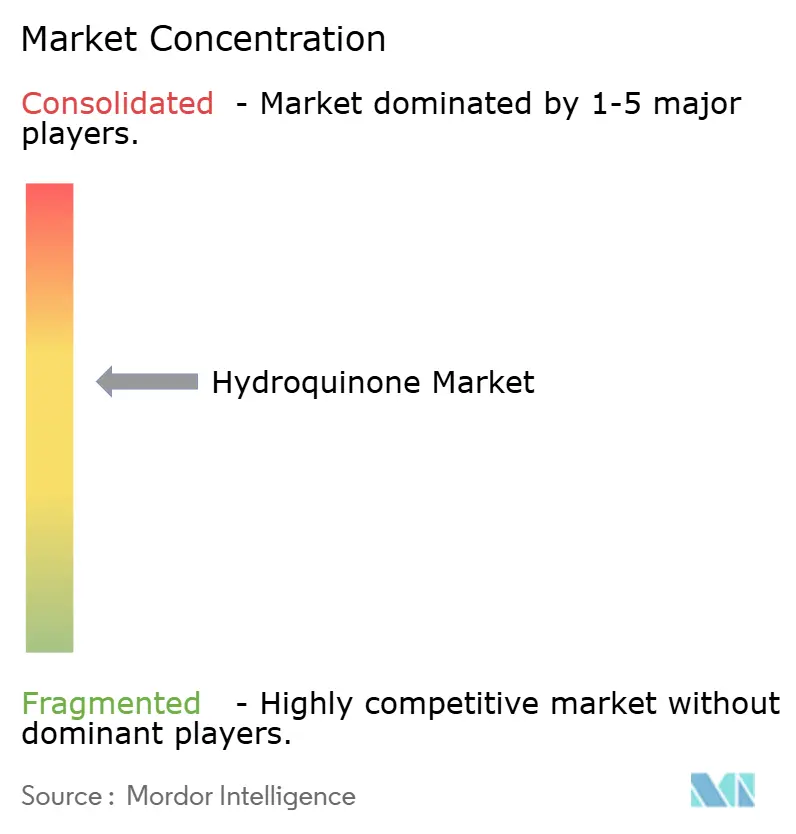
| Market Concentration | Medium |
Major Players *Disclaimer: Major Players sorted in no particular order Image © Mordor Intelligence. Reuse requires attribution under CC BY 4.0. | |
Hydroquinone Market Analysis by Mordor Intelligence
The Hydroquinone Market size is expected to increase from USD 412.23 million in 2025 to USD 428.68 million in 2026 and reach USD 521.30 million by 2031, growing at a CAGR of 3.99% over 2026-2031. Demand is shifting away from photographic chemicals toward higher-margin uses such as polymerization inhibitors and food-grade antioxidants, while producers accelerate the transition from the legacy cumene hydroperoxide route to greener H₂O₂ hydroxylation processes. Cumene still supplies more than half of global output, yet newer routes cut capital outlays by up to 40% and comply more easily with tightening waste-emissions rules in Europe. Rising acrylic-monomer capacity across Asia, coupled with stricter food-safety regulations that favor thermally stable antioxidants, underpins near-term growth. At the same time, biocatalytic up-cycling of lignin and the commercialization of hydroquinone-dipalmitate are opening specialty niches that can absorb regulatory pressure on traditional cosmetics.
Key Report Takeaways
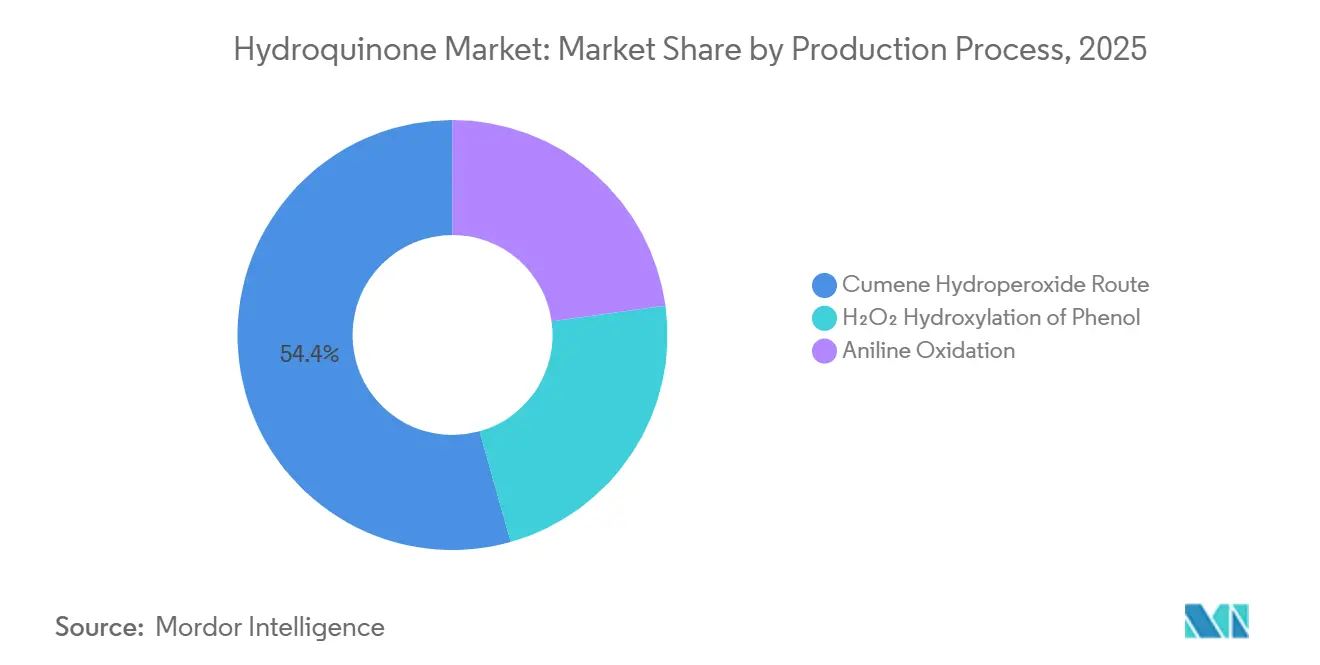
- By production process, the cumene hydroperoxide route led with 54.36% of the hydroquinone market share in 2025, but H₂O₂ hydroxylation of phenol is the fastest-growing route at a 4.52% CAGR through 2031.
- By application, polymerization inhibitors accounted for 66.61% of the hydroquinone market size in 2025 and are projected to advance at a 4.31% CAGR to 2031.
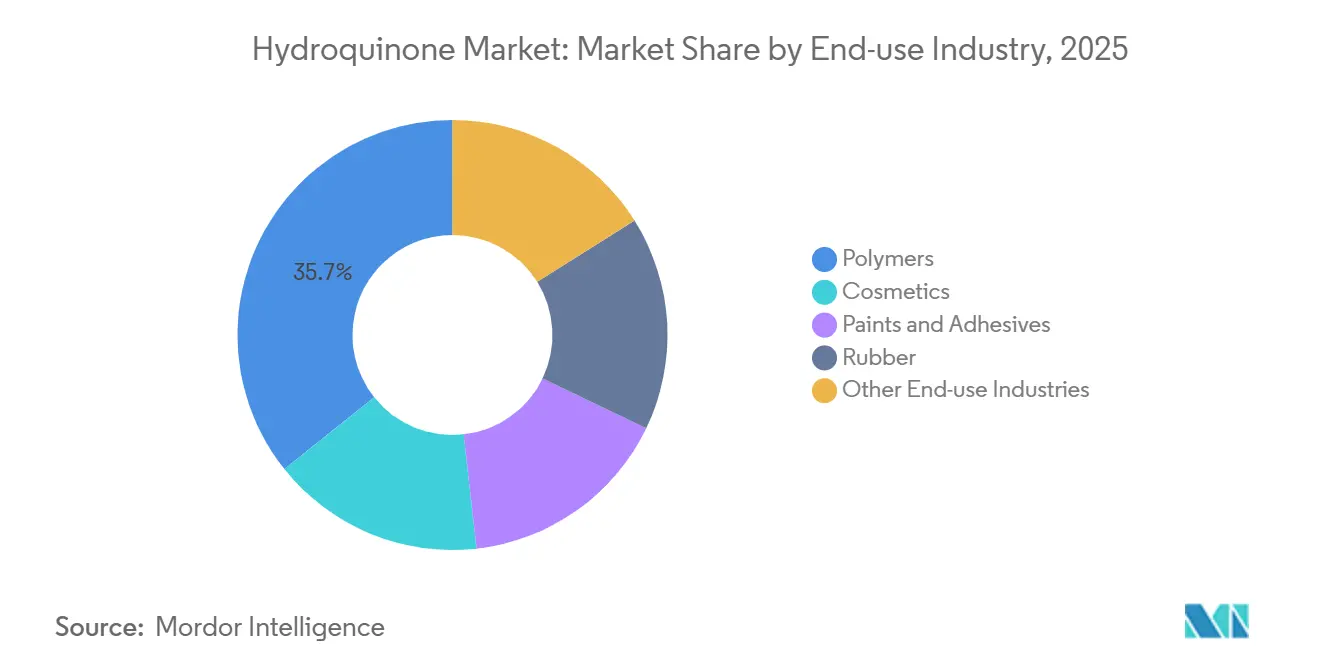
- By end-use industry, polymers represented 35.71% of demand in 2025 and are forecast to grow at a 4.77% CAGR through 2031.
- By geography, Asia-Pacific captured 47.92% revenue in 2025 and is expanding at a 4.33% CAGR through 2031.
Note: Market size and forecast figures in this report are generated using Mordor Intelligence’s proprietary estimation framework, updated with the latest available data and insights as of 2026.
Global Hydroquinone Market Trends and Insights
Drivers Impact Analysis*
| Driver | (~) % Impact on CAGR Forecast | Geographic Relevance | Impact Timeline |
|---|---|---|---|
| Rising demand for non-phenolic antioxidants in food packaging | +0.8% | Global, with strongest uptake in North America and Europe | Medium term (2-4 years) |
| Capacity additions in Asia for polymerization inhibitors | +1.2% | Asia-Pacific core (China, India, Japan), spill-over to Southeast Asia | Short term (≤ 2 years) |
| Growing preference for green H₂O₂ hydroxylation routes | +0.6% | Europe and North America leading adoption; Asia following | Long term (≥ 4 years) |
| Upcycling of lignin to HQ via biocatalysis unlocking supply flexibility | +0.4% | North America and Europe (pilot/early commercial); limited Asia uptake | Long term (≥ 4 years) |
| Emergence of HQ-dipalmitate as safer derivative broadens demand | +0.5% | Global, particularly regions with stringent cosmetic regulations (EU, North America) | Medium term (2-4 years) |
| Source: Mordor Intelligence | |||
Rising Demand for Non-Phenolic Antioxidants in Food Packaging
Food processors now embed tert-butylhydroquinone (TBHQ) in about 40% of packaged foods because it remains effective at fry-oil temperatures and cuts oxygen uptake one-hundredfold compared with older phenolics. Global TBHQ sales reached USD 8.216 billion in 2025 and are set to top USD 10.958 billion by 2032 at a 4.2% CAGR, comfortably ahead of the broader hydroquinone market trajectory. WHO and FDA intake limits of 0.2 mg/kg body weight have standardized formulation practices, linking demand directly to snack and ready-meal volumes[1]World Health Organization, “Food Additive Specifications for TBHQ,” who.int . Manufacturers with integrated TBHQ capacity—such as Camlin Fine Sciences—can hedge regulatory swings in cosmetics by locking in long-term supply deals with food-packaging converters. Certification under ISO 22000 and FSSC 22000 is emerging as a purchasing prerequisite, rewarding suppliers that invest in traceable, GMP-compliant production lines.
Capacity Additions in Asia for Polymerization Inhibitors
India’s Dahej hub ramped hydroquinone nameplate capacity from 10,000 MTPA in 2020 to 15,000 MTPA by 2022, offering a cost base lower than energy-intensive European plants. Methyl ethyl hydroquinone (MEHQ), dosed at 10-300 ppm, stabilizes acrylic acid in transit, and modern spectroscopic analyzers now maintain ± 0.22 ppm accuracy in real time. Tropical conditions shorten inhibitor hold-time from 50 hours at 80 °C to 12 hours at 90 °C, prompting continuous-dosing systems across Southeast Asian monomer units. Chinese exporters have amplified supply, keeping regional prices subdued and pressuring European producers to trim output, yet Asian demand from new MMA and acrylic acid lines is expected to absorb the glut by 2027. Integrated facilities that bundle MEHQ with acrylic monomer offtake agreements enjoy volume security and better working-capital cycles.
Growing Preference for Green H₂O₂ Hydroxylation Routes
The Enichem TS-1 titanium-silicate catalyst delivers 90% selectivity to hydroquinone without generating acetone, lowering purification costs and decoupling producers from propylene swings. A 2025 Journal of the Japan Petroleum Institute study lifted hydroquinone yield in slug-flow reactors to 8.62%, a 5.7-fold gain over batch operation. EU operators face EUR 50-80 per-tonne compliance surcharges under tightened wastewater rules, accelerating H₂O₂ adoption. Mid-sized Southeast Asian entrants find the route attractive because capital intensity runs 60-70% of a cumene unit while meeting growing local demand. The challenge is securing consistent hydrogen peroxide supply, since anthraquinone-based peroxide plants rely on internal hydroquinone loops that can become bottlenecks in refinery turnarounds.
Up-Cycling of Lignin to HQ via Biocatalysis Unlocking Supply Flexibility
Fungal manganese peroxidase and bacterial dye-decolorizing peroxidases cleave aryl-Cα bonds, funneling Kraft lignin fragments into hydroquinone-type intermediates. Pilot runs report yields below 10%, hindered by repolymerization and feedstock heterogeneity, yet economic breakeven requires at least 15% yield and cost under USD 2,500 per tonne. Research shows that lignin-derived phenoxazines outperform MEHQ as radical-trapping agents in acrylic acid, hinting at long-term displacement potential. North American biorefineries are testing continuous extraction to improve stability, and policy incentives for renewable chemicals could narrow the cost gap. Commercial upside hinges on scaling enzyme titers and extending catalyst life against oxidative deactivation.
Restraints Impact Analysis*
| Restraint | (~) % Impact on CAGR Forecast | Geographic Relevance | Impact Timeline |
|---|---|---|---|
| ECHA REACH restrictions on leave-on cosmetics | -0.9% | Europe primary; spill-over regulatory alignment in Asia-Pacific and Latin America | Short term (≤ 2 years) |
| Price volatility of cumene feedstock | -0.7% | Global, with acute impact in Asia-Pacific and North America | Short term (≤ 2 years) |
| ESG-driven investor pull-out from phenolic value chains | -0.5% | Europe and North America; limited Asia impact | Medium term (2-4 years) |
| Source: Mordor Intelligence | |||
ECHA REACH Restrictions on Leave-On Cosmetics
Hydroquinone lists under Annex II entry 1339 as prohibited in cosmetics, with only a 0.02% allowance for artificial nail systems under Annex III entry 14. The 2024 tightening eliminated indirect delivery routes through arbutin derivatives, sparking widespread product recalls that removed a steady 10-15% demand slice almost overnight. The compound also holds Carc. 2 and Muta. 2 classifications, dissuading formulators from seeking niche exemptions. U.S. EPA’s provisional oral reference dose of 0.04 mg/kg/day raises liability risks for dermal exposure[2]U.S. Environmental Protection Agency, “Provisional Peer-Reviewed Toxicity Values for Hydroquinone,” epa.gov . Producers without downstream TBHQ or MEHQ diversification face pronounced revenue cliffs.
Price Volatility of Cumene Feedstock
Phenol pricing, tied to benzene and propylene markets, surged in mid-2025 when refinery maintenance coincided with shipping bottlenecks, spiking hydroquinone spot quotations by more than 40%. Subsequent demand erosion in cosmetics triggered an equally sharp correction, exposing inventories valued at peak feedstock inputs to markdowns. Integrated chains that co-produce acetone can partially cushion the blow, yet smaller standalone plants endure margin whiplash. Price hedging through H₂O₂ routes or forward phenol contracts is gaining favor among financial controllers.
*Our forecasts treat driver/restraint impacts as directional, not additive. The impact forecasts reflect baseline growth, mix effects, and variable interactions.
Segment Analysis
By Production Process: Green Routes Gain Despite Cumene Dominance
The cumene hydroperoxide route provided 54.36% of hydroquinone market share in 2025, owing to its favorable co-product acetone economics. However, the H₂O₂ hydroxylation of phenol is expanding at a 4.52% CAGR as operators in Europe and North America seek lower waste-treatment costs and lighter capital investment. Continuous-flow reactors using Cu(II)-bipyridine catalysts have lifted phenol conversion efficiency, signaling a step change toward modular plants that switch feedstocks in response to price swings.
Lower purification loads, absence of acetone, and faster commissioning make H₂O₂ systems attractive to Southeast Asian entrants that supply nearby acrylic acid complexes. Direct benzene oxidation and aniline-based routes remain niche but offer strategic hedges where nitrobenzene or benzene overhangs exist. Integrated companies such as Eastman maintain dual-route assets, enabling agile raw-material arbitrage whenever propylene or hydrogen-peroxide spreads widen.


By Application: Polymerization Inhibitors Anchor Growth
Polymerization inhibitors held 66.61% of hydroquinone market size in 2025 and is advancing at a 4.31% CAGR through 2031. MEHQ and DTBHQ guard acrylic and unsaturated polyester monomers during storage, averting runaway reactions that can reach 200 °C in minutes. Antioxidant applications, chiefly TBHQ for edible oils, follow closely and present a defensive end-use shield whenever cosmetics consumption softens.
Intermediate applications are supported by feeding dye precursors and pharmaceutical synthesis. Photosensitive chemicals represent lower hydroquinone market demand after digital photography’s rise, although niche uses in archival microfilm and fine-art developing persist. Producers targeting inhibitors and antioxidants thus enjoy more resilient volume baselines compared with legacy photographic segments.
By End-use Industry: Polymers Lead, Cosmetics Contract
Polymers accounted for 35.71% of hydroquinone market demand in 2025 and are projected to grow at a 4.77% CAGR to 2031, powered by vinyl and acrylic chain expansions across Asia. The sector routinely specifies inhibitor doses between 10 ppm and 300 ppm, translating into a steady offtake linked to monomer throughput.
Cosmetics have shrunk sharply after EU and U.S. bans on OTC hydroquinone creams. Specialty-grade hydroquinone-dipalmitate and prescription-only formulations are cushioning the fall but cannot fully offset lost volume. Rubber, paints, adhesives, and a collection of smaller outlets—agriculture, water treatment, oilfield chemicals—provide a diversified tail that tempers cyclic exposure.
Geography Analysis
Asia-Pacific dominated the hydroquinone market with a 47.92% revenue share in 2025 and is advancing at a 4.33% CAGR, fueled by India’s capacity ramp-up and China’s price-led export strategy. Although discounting compresses margins, regional producers benefit from proximity to acrylic-acid complexes and lower energy tariffs.
North America is supported by strong MEHQ pull from acrylic resin makers and TBHQ demand from snack-food brands. Eastman’s dual-route set-up in the United States helps cushion phenol price gyrations and shortens lead times for pharmaceutical-grade shipments.
Europe faces the twin headwinds of REACH compliance costs and elevated electricity prices, restraining local output expansion. Nevertheless, premium niches such as USP-grade hydroquinone and novel antioxidants sustain select high-purity facilities. South America and the Middle-East and Africa collectively consume a low global supply, importing mainly for rubber, petrochemical, and packaging applications.

Competitive Landscape
Market concentration is moderate: the top five suppliers— Syensqo, Mitsui Chemicals , UBE Corporation, Camlin Fine Sciences, and Eastman—command a combined share of 68%, while a long tail of Chinese and Japanese firms fills regional gaps. Vertical integration into downstream derivatives like TBHQ and MEHQ differentiates leaders that can protect EBITDA margins when commodity prices erode.
Camlin’s 2022 debottlenecking in India illustrates the pivot toward low-cost hubs, whereas its temporary shutdown in Europe underscores sensitivity to energy and labor overheads. Eastman emphasizes dual-route optionality and USP-grade compliance, targeting pharmaceuticals, specialty chemicals, and high-purity photography niches.
Technology trajectories diverge: integrated phenol producers lean on the cumene process to monetize acetone, while green-field entrants adopt H₂O₂ hydroxylation for capital efficiency and regulatory ease. Academic breakthroughs in lignin-derived phenoxazines signal potential long-run displacement of traditional inhibitors, adding innovation pressure on incumbents.
Hydroquinone Industry Leaders
Camlin Fine Sciences Ltd.
Eastman Chemical Company
Mitsui Chemicals, Inc.
Syensqo
UBE Corporation
- *Disclaimer: Major Players sorted in no particular order

Recent Industry Developments
- December 2025: Clean Science and Technology Limited commenced commercial production of hydroquinone at its Kurkumbh facility. This initiative aimed to reduce import dependency and support local manufacturing in India, with an installed capacity of 10,000 MTPA.
- July 2025: The National Agency for Food and Drug Administration and Control (NAFDAC) warned against the use of bleaching creams containing excessive hydroquinone to protect public health. It stated that using creams with hydroquinone levels exceeding 2% is harmful and emphasized that mixing creams by unqualified individuals is inappropriate.


Global Hydroquinone Market Report Scope
Hydroquinone is an aromatic compound manufactured during the synthesis of dyes, oils, motor fuels, etc. Hydroquinone is produced as an inhibitor, intermediate, and antioxidant during these processes. Quinol is another name for hydroquinone.
The hydroquinone market is segmented by production process, application, end-user industry, and geography. By production process, the market is segmented into cumene hydroperoxide route, H₂O₂ hydroxylation of phenol, and aniline oxidation. By application, the market is segmented into intermediate, antioxidant, polymerization inhibitor, and photosensitive chemical. By end-use industry, the market is segmented into polymers, cosmetics, paints and adhesives, rubber, and other end-use industries. The report also covers the market size and forecasts for hydroquinone in 27 countries across major regions. For each segment, the market sizing and forecasts have been done on the basis of value (USD).
| Cumene Hydroperoxide Route |
| H₂O₂ Hydroxylation of Phenol |
| Aniline Oxidation |
| Intermediate |
| Antioxidant |
| Polymerization Inhibitor |
| Photosensitive Chemical |
| Polymers |
| Cosmetics |
| Paints and Adhesives |
| Rubber |
| Other End-use Industries |
| Asia-Pacific | China |
| India | |
| Japan | |
| South Korea | |
| Malaysia | |
| Thailand | |
| Indonesia | |
| Vietnam | |
| Rest of Asia-Pacific | |
| North America | United States |
| Canada | |
| Mexico | |
| Europe | Germany |
| United Kingdom | |
| Italy | |
| France | |
| Russia | |
| Spain | |
| Turkey | |
| NORDIC Countries | |
| Rest of Europe | |
| South America | Brazil |
| Argentina | |
| Colombia | |
| Rest of South America | |
| Middle-East and Africa | Saudi Arabia |
| United Arab Emirates | |
| Qatar | |
| Egypt | |
| Nigeria | |
| South Africa | |
| Rest of Middle-East and Africa |
| By Production Process | Cumene Hydroperoxide Route | |
| H₂O₂ Hydroxylation of Phenol | ||
| Aniline Oxidation | ||
| By Application | Intermediate | |
| Antioxidant | ||
| Polymerization Inhibitor | ||
| Photosensitive Chemical | ||
| By End-use Industry | Polymers | |
| Cosmetics | ||
| Paints and Adhesives | ||
| Rubber | ||
| Other End-use Industries | ||
| By Geography | Asia-Pacific | China |
| India | ||
| Japan | ||
| South Korea | ||
| Malaysia | ||
| Thailand | ||
| Indonesia | ||
| Vietnam | ||
| Rest of Asia-Pacific | ||
| North America | United States | |
| Canada | ||
| Mexico | ||
| Europe | Germany | |
| United Kingdom | ||
| Italy | ||
| France | ||
| Russia | ||
| Spain | ||
| Turkey | ||
| NORDIC Countries | ||
| Rest of Europe | ||
| South America | Brazil | |
| Argentina | ||
| Colombia | ||
| Rest of South America | ||
| Middle-East and Africa | Saudi Arabia | |
| United Arab Emirates | ||
| Qatar | ||
| Egypt | ||
| Nigeria | ||
| South Africa | ||
| Rest of Middle-East and Africa | ||


Key Questions Answered in the Report
How large will the hydroquinone market be by 2031?
The hydroquinone market size is projected to reach USD 521.30 million by 2031, expanding at a 3.99% CAGR from 2026-2031.
Which application will capture the fastest growth?
Polymerization inhibitors are forecast to grow at a 4.31% CAGR, driven by Asian acrylic-monomer capacity additions and stricter safety protocols.
Why are producers shifting toward H₂O₂ hydroxylation?
The route lowers capital outlays by up to 40%, trims waste-treatment costs, and meets EU emission standards, making it an attractive alternative to the cumene process.
What is driving demand for TBHQ?
Food manufacturers favor TBHQ for high-temperature stability, and global packaged-food growth under standardized WHO/FDA limits ensures predictable uptake.
Page last updated on:


