Pyrrolidone Market Size and Share
Market Overview
| Study Period | 2021 - 2031 |
|---|---|
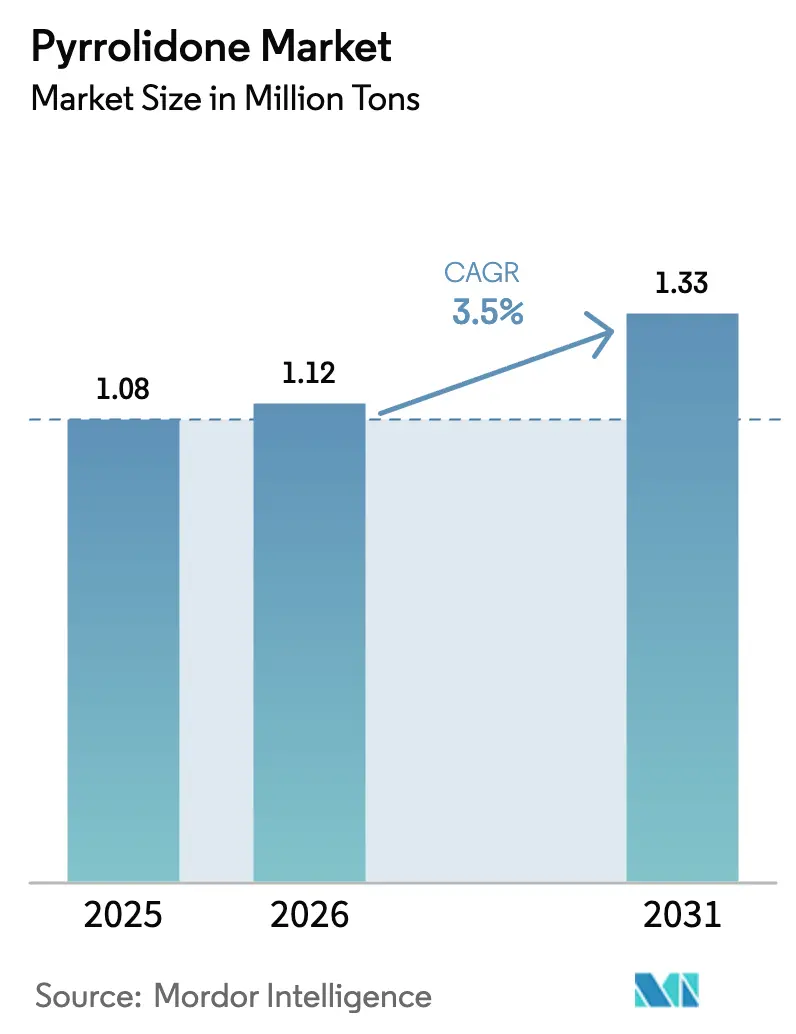
| Market Volume (2026) | 1.12 Million tons |
| Market Volume (2031) | 1.33 Million tons |
| Growth Rate (2026 - 2031) | 3.50% CAGR |
| Fastest Growing Market | Asia Pacific |
| Largest Market | Asia Pacific |
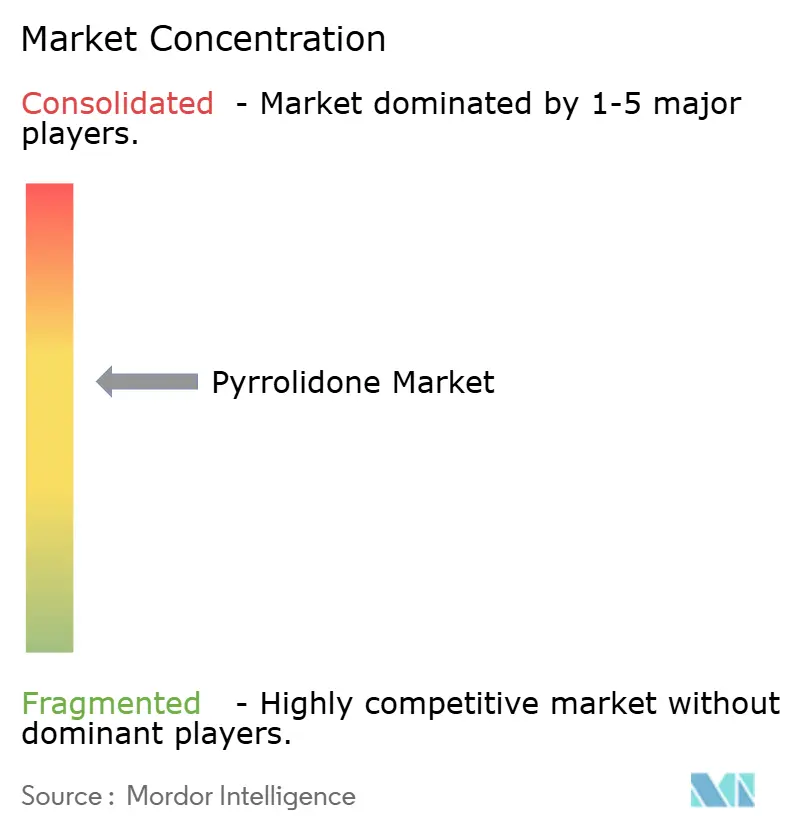
| Market Concentration | Medium |
Major Players *Disclaimer: Major Players sorted in no particular order Image © Mordor Intelligence. Reuse requires attribution under CC BY 4.0. | |
Pyrrolidone Market Analysis by Mordor Intelligence
The Pyrrolidone Market size is projected to be 1.08 million tons in 2025, 1.12 million tons in 2026, and reach 1.33 million tons by 2031, growing at a CAGR of 3.5% from 2026 to 2031. Steady headline growth hides a structural shift toward semiconductor-grade and battery-grade purity, both of which require ultra-low-metal recovery circuits and drive capital-expenditure cycles at most incumbent plants. Producers are also contending with stricter toxicity thresholds in the European Union and the United States, which create a two-speed market: Asian suppliers race to add electronic-grade capacity, while European formulators pivot to bio-based blends that stay below the 0.3% weight-by-weight limit set by REACH Annex XVII. At the same time, lithium-ion battery expansion keeps Asia-Pacific solvent demand rising even as per-cell consumption falls thanks to closed-loop recovery units. Competitive pressure is intensifying because Chinese entrants can undercut delivered cost by double-digit percentages, forcing Western incumbents to differentiate through purity, recovery efficiency, and ESG credentials.
Key Report Takeaways
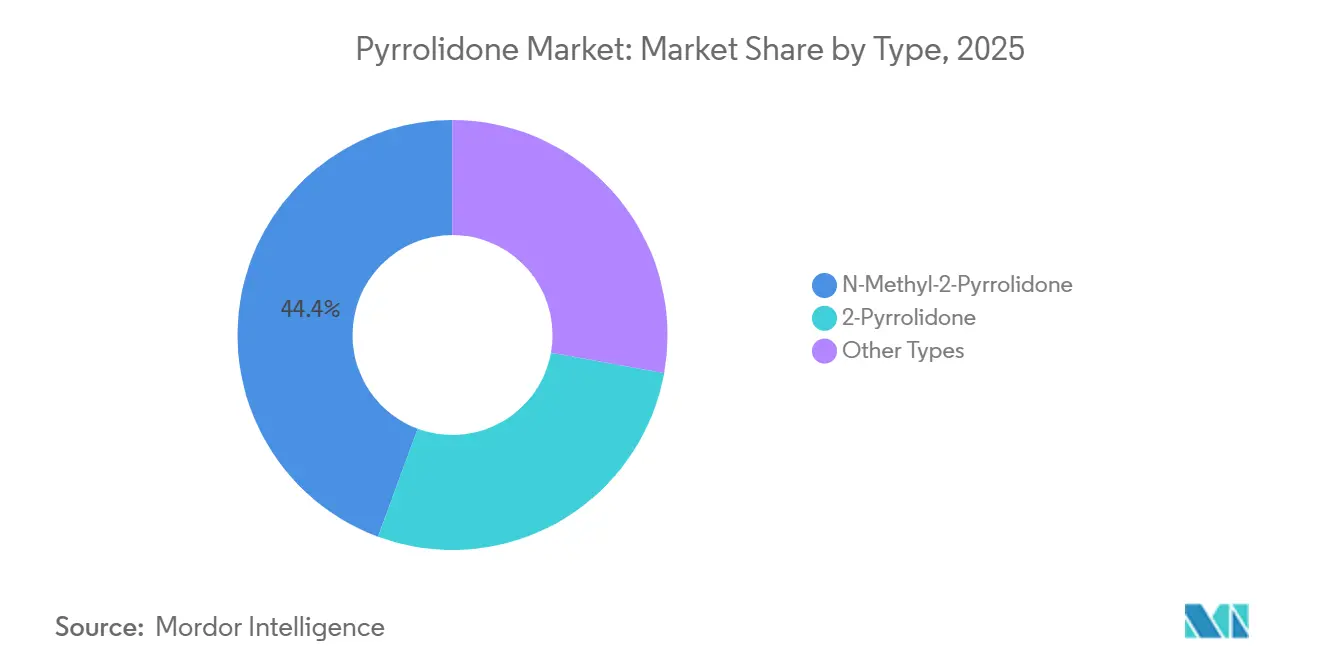
- By type, N-Methyl-2-Pyrrolidone held 44.36% pyrrolidone market share in 2025 while 2-Pyrrolidone posted the fastest growth at a 4.18% CAGR through 2031.
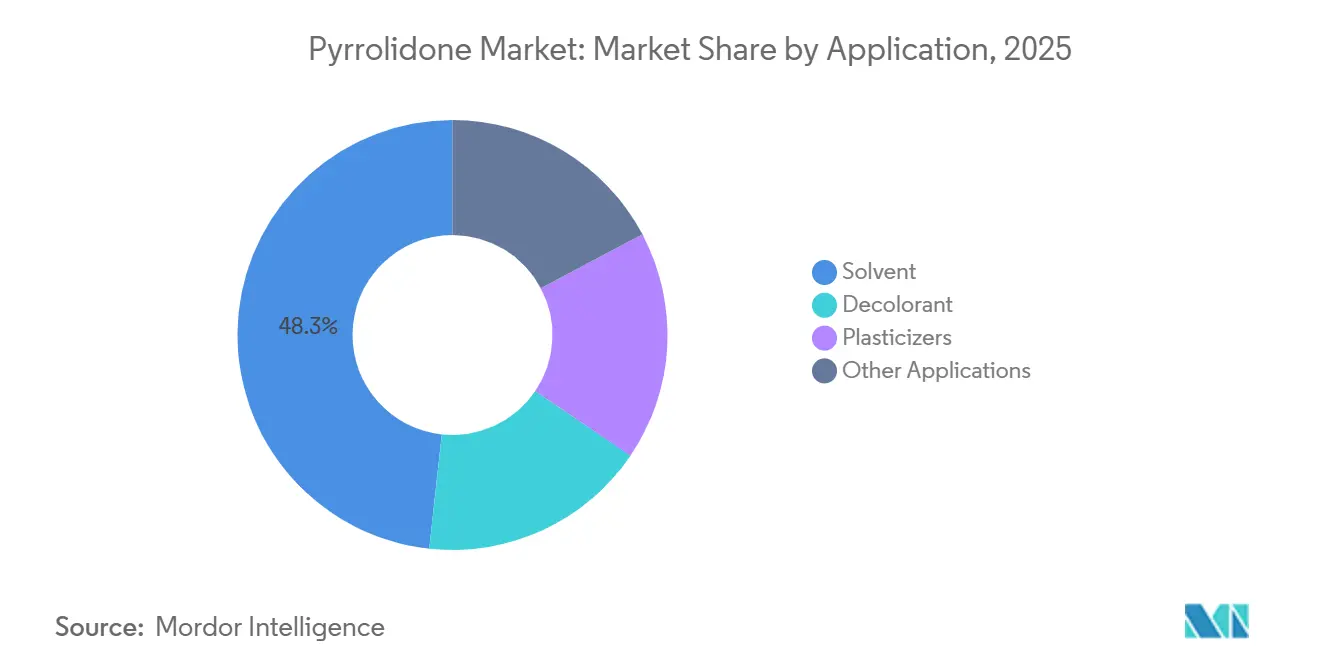
- By application, solvent accounted for 48.27% of the pyrrolidone market size in 2025, yet plasticizers are forecast to expand at 4.24% CAGR through 2031.
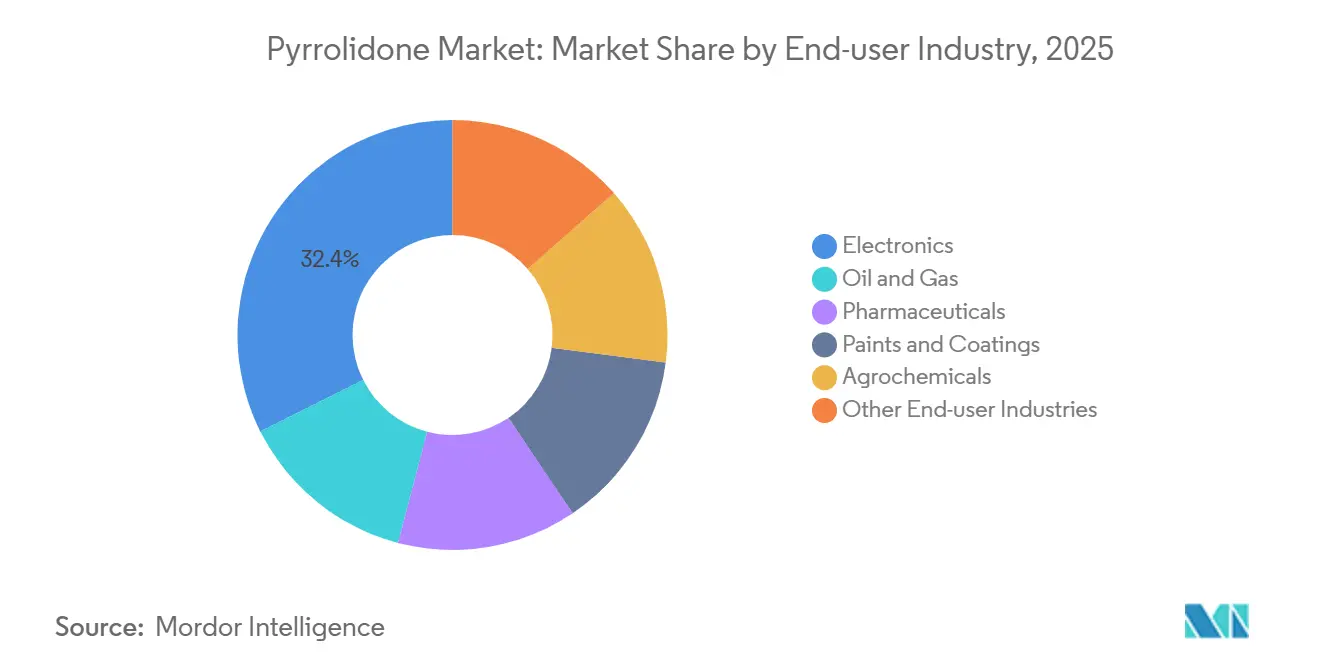
- By end-user industry, electronics led with a 32.41% share of the pyrrolidone market size in 2025 and are advancing at a 4.31% CAGR through 2031.
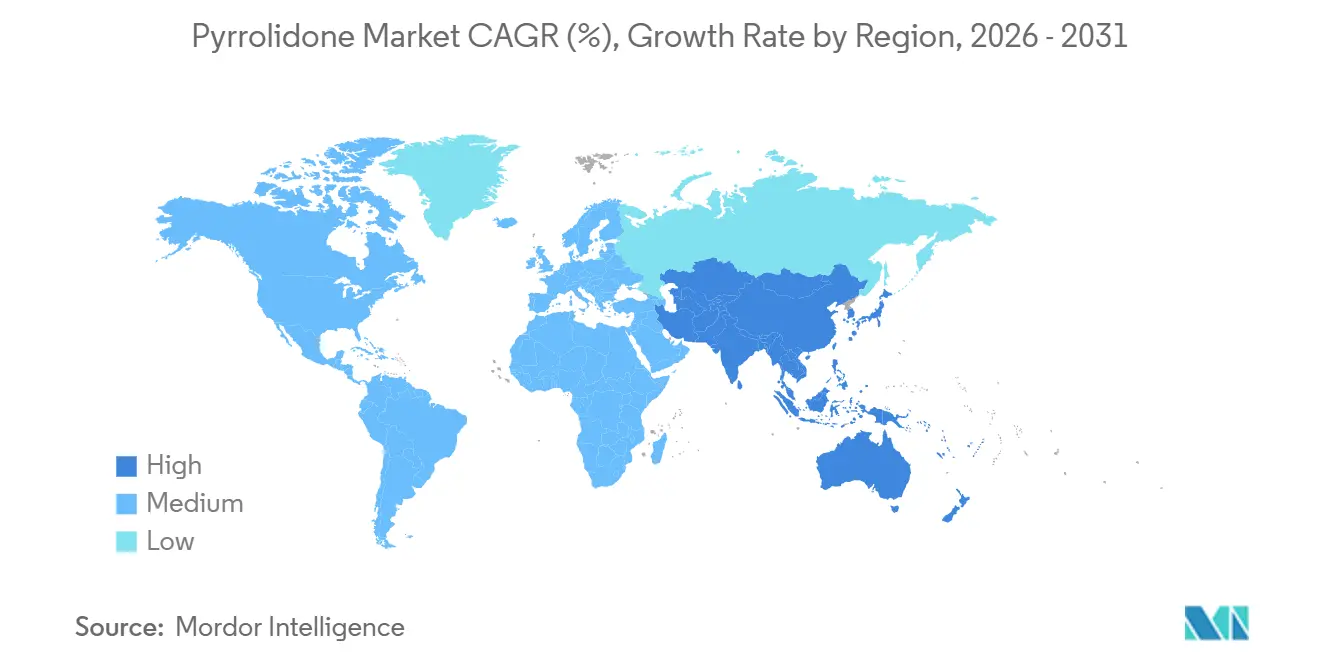
- By geography, Asia-Pacific controlled 48.89% of volume in 2025 and is projected to expand at 3.92% CAGR through 2031.
Note: Market size and forecast figures in this report are generated using Mordor Intelligence’s proprietary estimation framework, updated with the latest available data and insights as of January 2026.
Global Pyrrolidone Market Trends and Insights
Drivers Impact Analysis*
| Driver | (~) % Impact on CAGR Forecast | Geographic Relevance | Impact Timeline |
|---|---|---|---|
| Soaring demand for Li-ion battery cathode manufacturing | +1.4% | Asia-Pacific core, spill-over to North America and Europe | Medium term (2-4 years) |
| Expanding use as high-purity stripping solvent in semiconductor fabs | +0.9% | Asia-Pacific (South Korea, Taiwan, Japan), North America (Arizona, Texas) | Long term (≥ 4 years) |
| Strong uptake in pharmaceutical synthesis of 2-P derivatives | +0.6% | North America, Europe, India | Medium term (2-4 years) |
| Bio-based NMP commercialization gaining regulatory traction | +0.3% | Europe, North America | Long term (≥ 4 years) |
| Premium pricing for ultra-low-metal grades (less than 10 ppb) | +0.4% | Global, concentrated in electronics hubs | Short term (≤ 2 years) |
| Source: Mordor Intelligence | |||
Soaring Demand for Li-Ion Battery Cathode Manufacturing
Lithium-ion battery lines consumed 180,000 tons of NMP in 2025, and gigafactory build-outs continue despite falling per-cell solvent intensity. Chinese, South Korean, and Japanese cell plants are co-locating distillation units that recover 95%–98% of solvent, shrinking consumption per kilowatt-hour from 1.2 kg to 0.05 kg. Stable spot pricing in 2025, despite a 22% rise in cathode output, shows that recovery rather than virgin demand absorbs much of the growth. Capital expenditure for closed-loop systems now sits at roughly USD 8 million–USD 12 million per 50 GWh plant, yet the lower energy cost per kilogram—down from 3.5 kWh to below 2 kWh—improves both margins and ESG scores. These dynamics keep battery producers locked into the pyrrolidone market even as regulatory pressure rises elsewhere.
Expanding Use as High-Purity Stripping Solvent in Semiconductor Fabs
Advanced-node fabs need NMP that meets SEMI C33-0213 Grade 4 purity, capping each metallic element at 100 ppt. Achieving this threshold requires multi-stage distillation, ion-exchange polishing, and inline ICP-MS monitoring, boosting production cost by up to 60% but allowing 15%–20% higher selling prices. Fujifilm’s 2024 EUV photoresist developer shows how material suppliers integrate solvent purification into value-added blends that improve wafer yield. Newly commissioned fabs in Arizona and Texas already specify electronic-grade NMP, signaling that North American demand will align with Asian purity standards within two years. The result is a profitability corridor that rewards suppliers who can guarantee sub-10 ppb impurity levels.
Strong Uptake in Pharmaceutical Synthesis of 2-P Derivatives
The U.S. FDA’s 2024 excipient update categorized pyrrolidones as safe for topical use up to 10% weight-by-weight, clearing a path for wider adoption in transdermal patches[1]U.S. Food and Drug Administration, “Inactive Ingredient Database Update 2024,” fda.gov . Ashland’s Pharmasolve NMP now appears in a dozen FDA filings for nicotine-replacement, hormone-replacement, and analgesic patches, each of which pays a 60%–80% premium over industrial-grade solvent. Pharmaceutical batch sizes are small, so producers can dedicate reactors and purification loops without stranding capacity. The margin uplift keeps the pyrrolidone market attractive to specialty-chemical firms even as commodity demand softens in coatings.
Bio-Based NMP Commercialization Gaining Regulatory Traction
BASF’s biomass-balance NMP, launched in May 2024, uses renewable γ-butyrolactone to cut Scope 3 carbon emissions by up to 35% for European battery manufacturers. Although bio-based feedstock adds a 25%–35% price premium, EU battery regulations and automaker sustainability scorecards favor low-carbon materials. Pilot capacity sits at 15,000 tons per year, but multi-year offtake agreements suggest scale-up to 50,000 tons by 2028. The divergence between cost-sensitive Asian buyers and premium European customers is creating a bifurcated supply chain within the pyrrolidone industry.
Restraints Impact Analysis*
| Restraint | (~) % Impact on CAGR Forecast | Geographic Relevance | Impact Timeline |
|---|---|---|---|
| REACH and US EPA toxicity restrictions on NMP | -0.8% | Europe, North America | Short term (≤ 2 years) |
| Feed-stock γ-butyrolactone price volatility | -0.4% | Global | Medium term (2-4 years) |
| Investor ESG screens on VOC-intensive recovery units | -0.2% | Europe, North America | Medium term (2-4 years) |
| Source: Mordor Intelligence | |||
REACH and US EPA Toxicity Restrictions on NMP
REACH Annex XVII prohibits mixtures with ≥0.3% NMP, and the US EPA’s June 2024 rule proposes similar limits for consumer paint removers[2]European Chemicals Agency, “REACH Annex XVII Entry 71,” echa.europa.eu . Roughly 35,000 tons of annual demand disappeared from European paints between 2020 and 2025 as formulators switched to propylene carbonate and dimethyl sulfoxide. Industrial users remain, but compliance costs—including closed-system handling and revised safety data sheets—favor vertically integrated producers such as BASF and Ashland. Smaller blenders, particularly in Southern Europe, have exited the pyrrolidone market entirely, consolidating supply and modestly increasing margins for surviving incumbents.
Feed-Stock γ-Butyrolactone Price Volatility
GBL spot prices jumped 45% in 2024 after Chinese inspections curtailed 1,4-butanediol output, squeezing NMP margins by 15–20 points. Battery customers often lock in annual contracts, limiting pass-through flexibility, so Western suppliers are backward-integrating into GBL to stabilize costs. BASF’s patent on reactive-distillation NMP production underscores the capital intensity required to weather feedstock swings. Chinese plants near Shandong BDO hubs retain a cost advantage, widening regional price differentials inside the pyrrolidone market.
*Our forecasts treat driver/restraint impacts as directional, not additive. The impact forecasts reflect baseline growth, mix effects, and variable interactions.
Segment Analysis
By Type: NMP Anchors Volume, 2-Pyrrolidone Captures Pharma Growth
N-Methyl-2-Pyrrolidone commanded 44.36% of volume in 2025, reflecting its indispensability in battery slurries and photoresist stripping. While NMP keeps dominance, 2-Pyrrolidone is expanding at a 4.18% CAGR as formulators exploit its lower toxicity profile in transdermal patches. Ashland’s Pharmasolve 2-Pyrrolidone gives patch makers a penetration enhancer free of reproductive-hazard labeling, supporting premium pricing. Other variants—N-ethyl-2-pyrrolidone and N-vinyl-2-pyrrolidone—remain niche, mainly for specialty-polymer synthesis.
Purity stratification is now the primary competitive lever. Semiconductor-grade product commands USD 4,500–USD 5,200 per ton versus USD 2,800–USD 3,200 for battery-grade and USD 2,200–USD 2,800 for industrial solvent. Inline ion-chromatography and ICP-MS add USD 0.15–USD 0.25 per kilogram but protect margins. As a result, producers differentiate less on molecule and more on purification depth, a dynamic that reshapes pricing in the pyrrolidone market.


By Application: Solvent Dominance Masks Plasticizers’ Structural Shift
Solvent held 48.27% of volume in 2025, led by electronics and petrochemicals. Asia-Pacific accounts for most of the solvent growth, rising at a 4.1% CAGR as battery and semiconductor capacity builds out. Europe moves in the opposite direction because REACH restrictions remove NMP from consumer paints. Plasticizers are growing at 4.24% CAGR through 2031 as compounders integrate pyrrolidone-containing polyamides into flame-retardant TPU. BASF’s 2024 patent shows that 8%–12% pyrrolidone-PA loading achieves UL 94 V-0 ratings without halogens. Margin dispersion is evident: electronics solvents deliver 18%–22% EBITDA, whereas decolorant sales in petrochemicals hover at 8%–12%, confirming a distinct profitability hierarchy in the pyrrolidone market.
By End-user Industry: Electronics Pulls Ahead on Purity, Pharma Pivots to 2-P
Electronics absorbed 32.41% of volume in 2025 and is advancing at 4.31% CAGR through 2031, the fastest of any segment. Battery demand alone may climb further by 2031 as EV penetration accelerates. Semiconductor fabs added demand in 2025, with each advanced node requiring more stripping solvent per wafer. Pharmaceuticals benefit mainly from 2-Pyrrolidone penetration enhancers that avoid REACH hazard labels. Oil and gas stays stable but niche, while paints and coatings drop in Europe yet grow in Asia. Agrochemicals remain constrained by solvent-substitution pressure. Vertical integration into recovery loops and purification is now commonplace among electronics majors, altering procurement patterns inside the pyrrolidone market.
Geography Analysis
Asia-Pacific controlled 48.89% of volume in 2025 and will grow at 3.92% CAGR through 2031, anchored by MYJ Chemical’s 60,000-ton electronic-grade facility in Henan and South Korean gigafactories run by LG Energy Solution, Samsung SDI, and SK On. China benefits from low-cost γ-butyrolactone in Shandong, undercutting Western suppliers by up to 20% delivered cost. Japan continues as a high-purity stronghold, yet total tonnage is flat because automotive OEMs offshore battery production. India’s agrochemical and coatings sectors add 8,000–10,000 tons of new demand, mostly met by Chinese imports. Regionalization is evident: Chinese plants focus on volume, Korean operations on battery-grade purity, and Japanese units on pharma-grade niche volumes.
In North America, semiconductor investment in Arizona and Texas drives electronic-grade demand, while pharmaceutical adoption of 2-Pyrrolidone underpins specialty growth. The US EPA’s 2024 draft rule removed 12,000–15,000 tons from consumer paint removers, but industrial exemptions keep electronics and pharma users active. Eastman’s Kingsport plant satisfies domestic security needs despite a 10%–12% price premium over imports.
Europe is shrinking due to REACH Annex XVII. Germany still hosts 40,000 tons of BASF capacity, largely exported to Poland and Hungary gigafactories. Bio-based NMP helps European producers protect margins, but paints and coatings have largely switched to safer solvents. South America and the Middle East and Africa shares are fueled by Brazilian agrochemicals and Saudi refinery projects, yet they remain net importers, reinforcing Asia’s dominance in the pyrrolidone market.

Competitive Landscape
The pyrrolidone market shows moderate concentration: BASF, LyondellBasell, Ashland, Shandong Zhishang Chemical, and Mitsubishi Chemical jointly control 63% of capacity. Chinese makers such as Puyang Guangming, Zhejiang Realsun, and MYJ Chemical are gaining volume by selling electronic-grade NMP 15%–20% below Western prices. BASF’s October 2025 Nanjing expansion added a 98% recovery loop, cutting operating cost from USD 1.80 to USD 1.15 per kilogram and trimming energy use to below 2 kWh, a key ESG metric. Ashland’s Micropure and Pharmasolve portfolios target electronic and pharmaceutical niches, fetching 50%–70% price premiums through guaranteed low amine content. Mitsubishi Chemical markets carbon-neutral roadmaps that aim for bio-based NMP by 2028. Indian contract manufacturers like Chemex Organochem are looking to fill gaps in pharma-grade 2-Pyrrolidone by leveraging low labor costs. Technology remains the decisive lever: inline ICP-MS monitoring lets suppliers hit sub-10 ppb purity, thereby commanding premiums that offset feedstock and compliance costs.
Pyrrolidone Industry Leaders
Ashland
Mitsubishi Chemical Group Corporation
LyondellBasell Industries Holdings B.V.
SHANDONG ZHISHANG CHEMICAL CO.LTD.
BASF
- *Disclaimer: Major Players sorted in no particular order

Recent Industry Developments
- June 2025: Wanhua and ElevenEs Ltd., a European manufacturer of lithium iron phosphate (LFP) batteries, signed a Memorandum of Understanding (MOU). This collaboration aimed to establish a comprehensive supply and technical partnership for NMP (N-methyl-2-pyrrolidone) solvents to support the sustainable development of both parties in the new energy industry.
- June 2024: The US Environmental Protection Agency (EPA) proposed a rule to restrict the concentration limit of N-Methyl-2-pyrrolidone (NMP) no greater than 45% in consumer paint removers of which significantly impacted the pyrrolidone market. This restriction is expected to reduce demand, affecting manufacturers and suppliers reliant on NMP for paint removal applications.


Global Pyrrolidone Market Report Scope
Pyrrolidone, specifically 2-pyrrolidone, is a five-membered organic compound that exists as a colorless liquid or solid near room temperature. It is a type of lactam widely used as a versatile solvent, a precursor for polymers such as polyvinylpyrrolidone (PVP), and an intermediate in pharmaceutical applications, including the production of Piracetam. Pyrrolidone is known for its ability to dissolve various substances and enhance drug penetration. Its derivatives, such as N-methyl-2-pyrrolidone (NMP), serve as important industrial solvents.
The pyrrolidone market is segmented by type, application, end-user industry, and geography. By type, the market is segmented into N-Methyl-2-Pyrrolidone, 2-Pyrrolidone, and other types. By application, the market is segmented into solvent, decolorant, plasticizers, and other applications. By end-user industry, the market is segmented into electronics, oil and gas, pharmaceuticals, paints and coatings, agrochemicals, and other end-user industries. The report also covers the market size and forecasts for pyrrolidone in 25 countries across major regions. For each segment, the market sizing and forecasts have been done on the basis of volume (tons).
| N-Methyl-2-Pyrrolidone |
| 2-Pyrrolidone |
| Other Types |
| Solvent |
| Decolorant |
| Plasticizers |
| Other Applications |
| Electronics |
| Oil and Gas |
| Pharmaceuticals |
| Paints and Coatings |
| Agrochemicals |
| Other End-user Industries |
| Asia-Pacific | China |
| India | |
| Japan | |
| South Korea | |
| Malaysia | |
| Thailand | |
| Indonesia | |
| Vietnam | |
| Rest of Asia-Pacific | |
| North America | United States |
| Canada | |
| Mexico | |
| Europe | Germany |
| United Kingdom | |
| Italy | |
| France | |
| Spain | |
| NORDIC Countries | |
| Rest of Europe | |
| South America | Brazil |
| Argentina | |
| Colombia | |
| Rest of South America | |
| Middle-East and Africa | Saudi Arabia |
| United Arab Emirates | |
| Qatar | |
| Egypt | |
| Nigeria | |
| South Africa | |
| Rest of Middle-East and Africa |
| By Type | N-Methyl-2-Pyrrolidone | |
| 2-Pyrrolidone | ||
| Other Types | ||
| By Application | Solvent | |
| Decolorant | ||
| Plasticizers | ||
| Other Applications | ||
| By End-user Industry | Electronics | |
| Oil and Gas | ||
| Pharmaceuticals | ||
| Paints and Coatings | ||
| Agrochemicals | ||
| Other End-user Industries | ||
| By Geography | Asia-Pacific | China |
| India | ||
| Japan | ||
| South Korea | ||
| Malaysia | ||
| Thailand | ||
| Indonesia | ||
| Vietnam | ||
| Rest of Asia-Pacific | ||
| North America | United States | |
| Canada | ||
| Mexico | ||
| Europe | Germany | |
| United Kingdom | ||
| Italy | ||
| France | ||
| Spain | ||
| NORDIC Countries | ||
| Rest of Europe | ||
| South America | Brazil | |
| Argentina | ||
| Colombia | ||
| Rest of South America | ||
| Middle-East and Africa | Saudi Arabia | |
| United Arab Emirates | ||
| Qatar | ||
| Egypt | ||
| Nigeria | ||
| South Africa | ||
| Rest of Middle-East and Africa | ||


Key Questions Answered in the Report
How big is the pyrrolidone market in 2026?
The pyrrolidone market size totals 1.12 million tons in 2026 and is projected to reach 1.33 million tons by 2031.
Which application is growing fastest for pyrrolidone?
Plasticizers are the fastest-growing application, expanding at 4.24% CAGR due to flame-retardant TPU adoption.
Why is electronic-grade NMP priced at a premium?
Electronic-grade NMP must meet sub-10 ppb metallic-impurity limits, requiring costly purification that supports a 60%–80% price premium.
How do REACH rules affect pyrrolidone demand in Europe?
REACH Annex XVII caps NMP content in consumer products, eliminating significant paint and coating demand and shifting focus to bio-based blends below 0.3% weight.
Page last updated on:


