Size and Share of E-commerce Market For Lighting Industry
Market Overview
| Study Period | 2020 - 2031 |
|---|---|
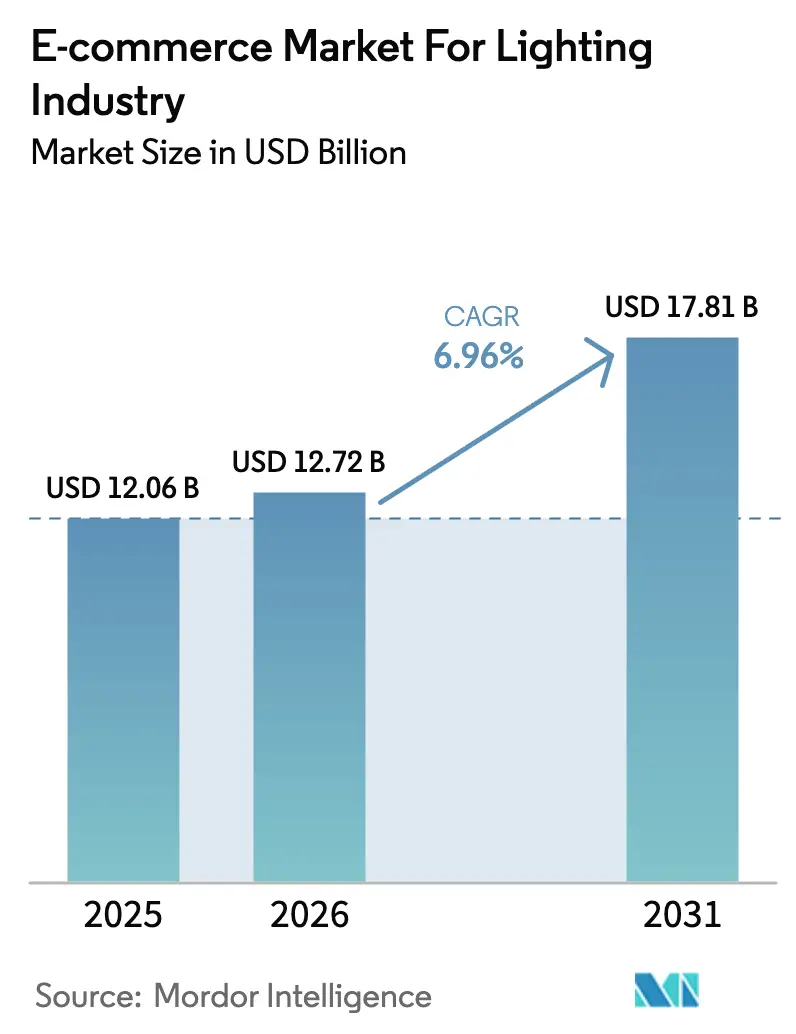
| Market Size (2026) | USD 12.72 Billion |
| Market Size (2031) | USD 17.81 Billion |
| Growth Rate (2026 - 2031) | 6.96% CAGR |
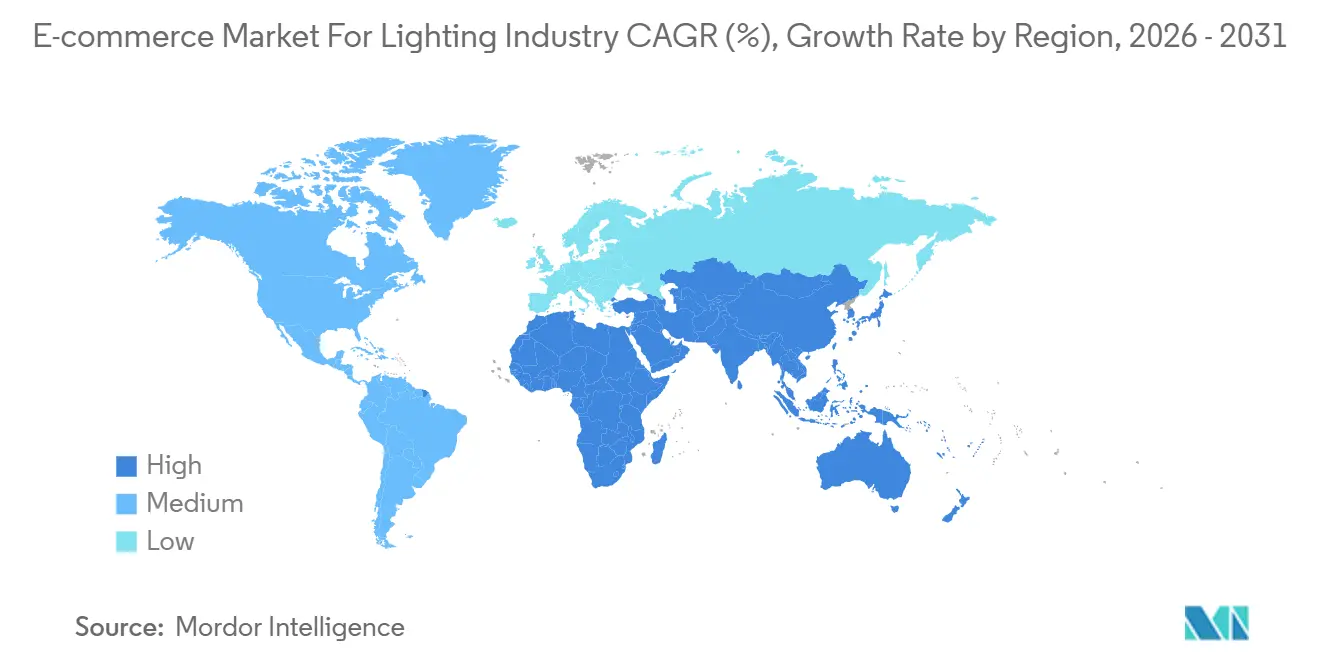
| Fastest Growing Market | Asia Pacific |
| Largest Market | Asia Pacific |
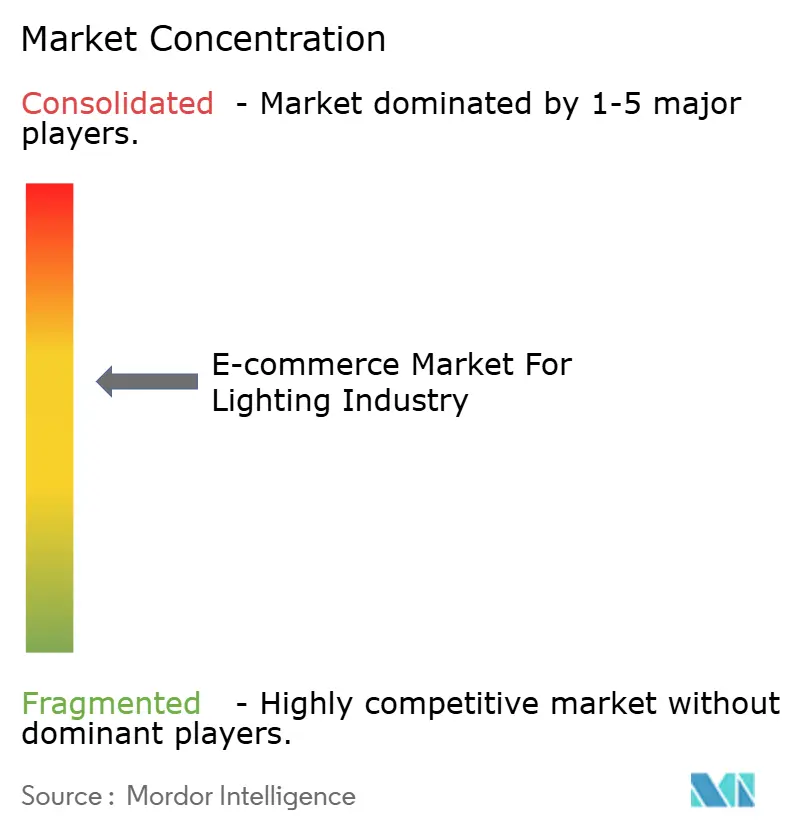
| Market Concentration | Medium |
Major Players *Disclaimer: Major Players sorted in no particular order Image © Mordor Intelligence. Reuse requires attribution under CC BY 4.0. | |
Analysis of E-commerce Market For Lighting Industry by Mordor Intelligence
The e-commerce market for lighting industry size was valued at USD 12.06 billion in 2025 and is estimated to grow from USD 12.72 billion in 2026 to reach USD 17.81 billion by 2031, at a CAGR of 6.96% during the forecast period (2026-2031). Ongoing energy-efficiency mandates that outlaw incandescent bulbs, the rollout of AI visual search tools that compress discovery-to-checkout times, rapid expansion of same-day logistics that lower breakage rates, and a pivot by manufacturers toward direct-to-consumer portals that monetize firmware and data subscriptions collectively propel top-line growth. Competitive strategy revolves around vertical integration, as incumbents buy software firms to bundle controls with fixtures, while social-commerce-savvy challengers use shoppable short-form video to attract Generation Z buyers chasing aesthetic customization. Platform economics are evolving, marketplaces still dominate unit volume, yet brand-owned sites are growing faster as sellers recapture margin lost to referral fees and municipal procurement for smart-city luminaires is emerging as a new e-tender channel that shifts value toward service contracts. Because the hardware sale increasingly links to recurring software revenue, players able to combine certified luminaires, cloud analytics, and reliable fulfillment stand to gain disproportionate share.
Key Report Takeaways
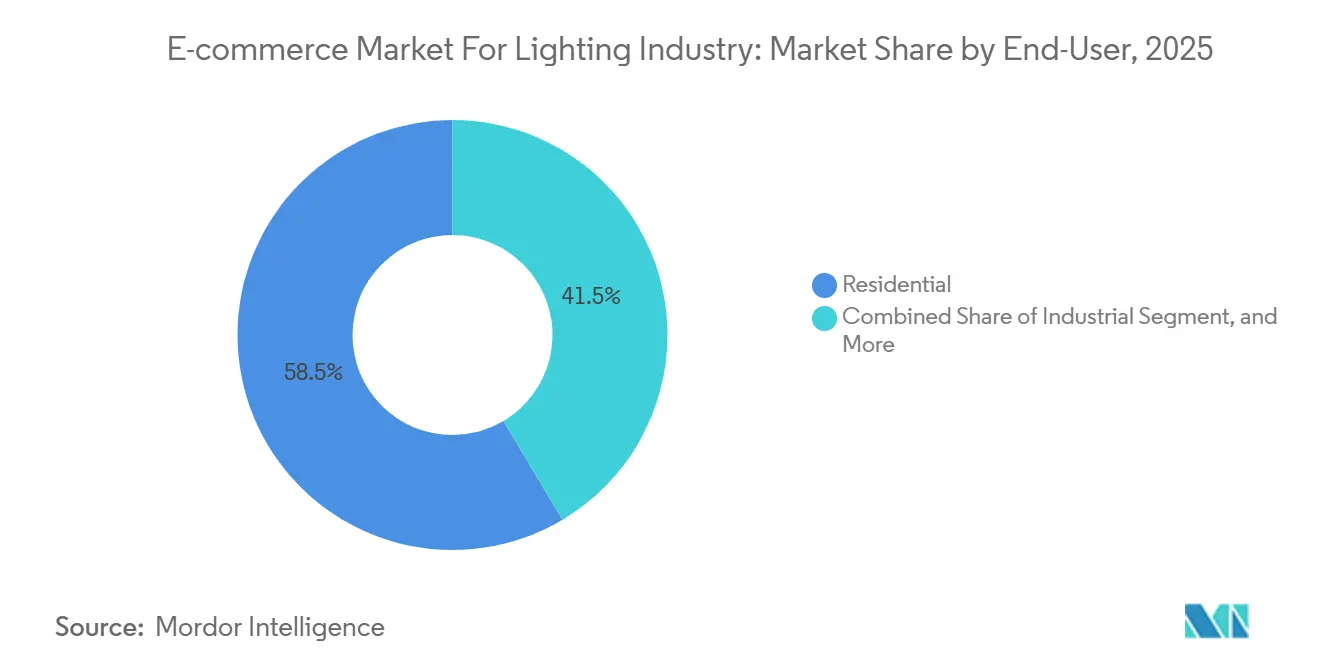
- By end-user, the residential segment led with 58.54% of e-commerce market for lighting industry share in 2025, while the commercial segment is forecast to expand at a 7.83% CAGR through 2031.
- By product type, LED bulbs and lamps accounted for 38.43% of the e-commerce market for lighting industry in 2025, whereas smart controls are expected to grow at a 7.42% CAGR to 2031.
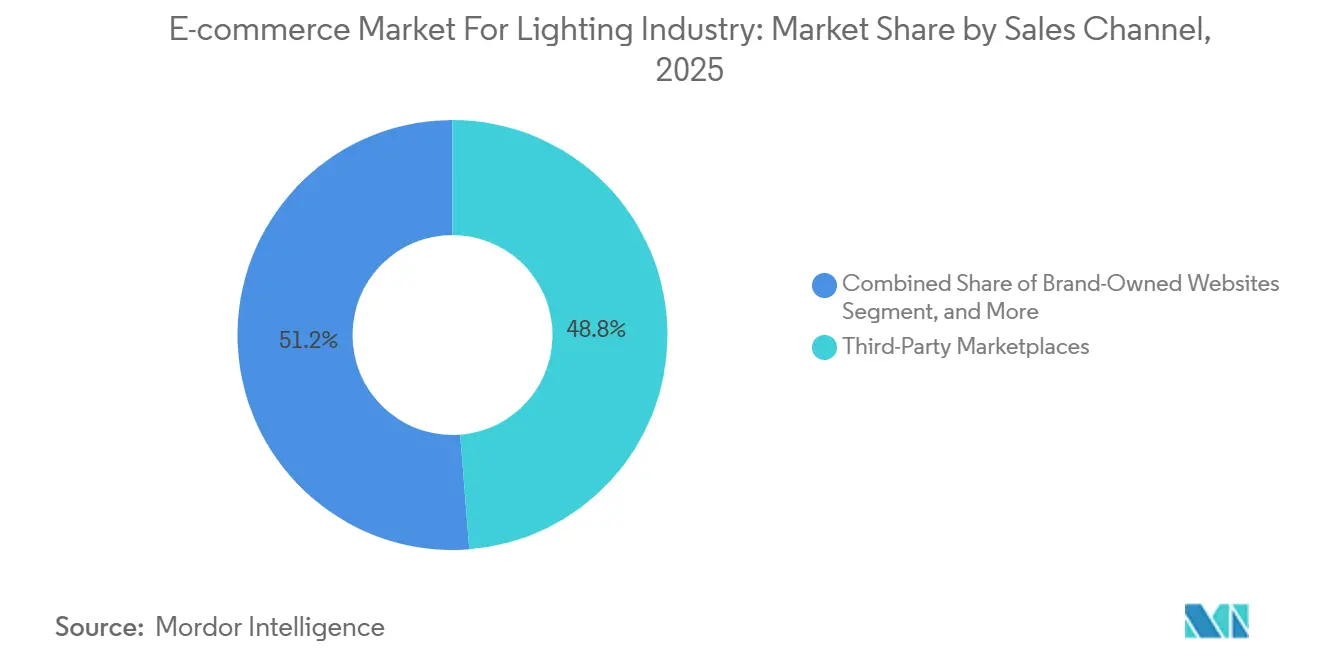
- By sales channel, third-party marketplaces captured 48.77% of revenue in 2025, yet brand-owned websites are set to post a 7.71% CAGR across the forecast period.
- By delivery model, standard shipping held 54.43% of the e-commerce market for lighting industry in 2025, but express and same-day services are advancing at the strongest 8.12% CAGR to 2031.
- By geography, Asia-Pacific commanded 40.42% of revenue in 2025 and is projected to register the fastest 8.31% CAGR between 2026 and 2031.
Note: Market size and forecast figures in this report are generated using Mordor Intelligence’s proprietary estimation framework, updated with the latest available data and insights as of January 2026.
Insights and Trends of E-commerce Market For Lighting Industry
Drivers Impact Analysis*
| Driver | (~) % Impact on CAGR Forecast | Geographic Relevance | Impact Timeline |
|---|---|---|---|
| Government Mandates for Phase-Out of Incandescent Bulbs | +1.3% | North America and Europe first, global follow-through | Medium term (2-4 years) |
| Rising Adoption of Energy-Efficient LED Fixtures | +1.5% | Asia-Pacific, Middle East, North America | Long term (≥ 4 years) |
| Proliferation of DIY Smart-Home Ecosystems | +1.2% | North America and Europe core, urban Asia-Pacific spillover | Medium term (2-4 years) |
| Increasing Refurbishment of Commercial Real Estate | +0.9% | North America and Europe, selective tier-1 Asian cities | Medium term (2-4 years) |
| Convenience-Driven Shift Toward Same-Day Delivery | +1.0% | Dense metros worldwide | Short term (≤ 2 years) |
| Surge in AI-Powered Visual Search on Retail Apps | +0.8% | Highest use in North America and China | Short term (≤ 2 years) |
| Source: Mordor Intelligence | |||
Government Mandates for Phase-Out of Incandescent Bulbs
A December 2024 United States Department of Energy rule obligates general service lamps to reach 120 lumens per watt efficacy by January 2028, effectively eliminating incandescent and most halogen SKUs from retail and digital shelves. Similar bans in the European Union, Canada and Australia converge to force accelerated LED substitution, trimming catalog clutter and steering consumers toward compliant alternatives. Certification portals require photometric test uploads before a product can be listed, raising market-entry barriers for small sellers without in-house labs. Clearance discounts on the final wave of legacy inventory teach shoppers to expect LED price parity, boosting search traffic for high-efficacy bulbs on major marketplaces. Utilities in California and New York now mail LED starter kits purchased through bulk e-procurement portals, normalizing online acquisition for lighting fixtures and building long-term digital buying habits.
Rising Adoption of Energy-Efficient LED Fixtures
Commercial owners retrofit fluorescent troffers and HID bays with LED panels to meet tighter power-density caps that the International Energy Conservation Code 2021 introduced.[1]International Code Council, “International Energy Conservation Code,” ICCSAFE.ORG The United States Department of Energy Better Buildings program documented average paybacks of 1.4-2.7 years and maintenance savings up to 80% for offices making the switch. Signify reported 87% of its EUR 1.647 billion (USD 1.81 billion) Q3 2024 sales came from LED-based products, underscoring the global skew toward high-efficacy luminaires. Asia-Pacific governments push adoption harder, India mandates LEDs in public buildings and China’s 14th Five-Year Plan targets 70% LED penetration in commercial spaces, funneling incremental demand to B2B e-commerce portals that aggregate certified fixtures. Online filters for lumen output and CCT compress procurement cycles from weeks to days, benefiting regional contractors.
Proliferation of DIY Smart-Home Ecosystems
Matter versions 1.1 through 1.3 expand device classes and boost interoperability across Apple HomeKit, Google Home, Amazon Alexa and Samsung SmartThings. Shoppers now photograph a showroom pendant with Amazon Lens and receive instant links to compatible smart bulbs online, a feature whose usage jumped 76% during 2024. An EU consumer survey found 35% of households plan to buy smart-home products within 12 months, with lighting the favored entry category. U.S. respondents value open ecosystems, driving adoption of multi-brand kits sourced via marketplaces that label SKUs “Works with Matter.” Bundle discounts and drop-shipping lower entry barriers, fragmenting market share and intensifying price competition.
Increasing Refurbishment of Commercial Real Estate
Vacancy rates topping 18% in many U.S. downtowns fuel landlord investment in wellness-certified upgrades, including tunable-white LEDs that cycle from 2700 K at dawn to 5000 K midday. Federal General Services Administration guidance demands ≥100 lumens per watt efficacy and CRI above 80, specifications buyers filter for on Acuity Brands and Signify portals. Peer-reviewed clinical studies link circadian lighting to better sleep and alertness, validating premium fixtures that capture 20-30% price premiums. Maintenance guides from CIBSE extend replacement intervals to 70 000 hours, reducing service calls and making online bulk orders more cost-effective.
Restraints Impact Analysis*
| Restraint | (~) % Impact on CAGR Forecast | Geographic Relevance | Impact Timeline |
|---|---|---|---|
| High Return Rates Due to Product Damage in Transit | -0.7% | North America and Europe | Short term (≤ 2 years) |
| Fragmented Regulations on Cross-Border E-commerce | -0.6% | Europe and Asia-Pacific | Medium term (2-4 years) |
| Cyber-Security Breaches Eroding Consumer Trust | -0.5% | North America and Europe | Short term (≤ 2 years) |
| Supply-Chain Disruptions for Key LED Components | -0.4% | Global, concentrated in China | Medium term |
| Source: Mordor Intelligence | |||
High Return Rates Due to Product Damage in Transit
Lighting fixtures posted a 17.6% online return rate during 2024, the highest among durable goods categories, as reported by the National Retail Federation. Dimensional-weight pricing introduced by carriers inflates shipping costs on low-density pendants, squeezing margins unless sellers raise list prices and risk lower conversion. Free-return policies encourage buyers to test multiple color temperatures, elevating reverse-logistics volumes, while rural addresses still rely on multi-day ground services that add handling touches and increase breakage risk.
Fragmented Regulations on Cross-Border E-commerce
The European Union Digital Services Act forces marketplaces to verify seller identities and retain liability for VAT on low-value imports, prompting many small Chinese vendors to exit EU listings rather than assume compliance overhead. India’s BIS scheme can cost USD 15 000 per SKU and take nine months, and Japan’s PSE mark adds factory audits, reducing catalog breadth on local platforms. Duplicate photometric testing under DOE LM-79, IEC 62722 and JIS C 8105 triples certification budgets, delaying product launches by quarters and slowing cross-border scale-up.
*Our forecasts treat driver/restraint impacts as directional, not additive. The impact forecasts reflect baseline growth, mix effects, and variable interactions.
Segment Analysis
By End-User: Residential Dominance Masks Commercial Velocity
The residential customer base produced 58.54% of e-commerce market for lighting industry share in 2025, sustained by do-it-yourself upgrades that swap incandescent cans for voice-controlled LEDs available in next-day assortments. Growing interoperability lets homeowners order multi-brand bundles, raising average order values even as bulb replacement cycles climb to a decade.[2]Connectivity Standards Alliance, “Matter Protocol Specifications,” CSA-IOT.ORG
Commercial buyers, although smaller in spending today, are expected to expand at 7.83% CAGR through 2031 as landlords retrofit to satisfy city energy benchmarking laws and tenant wellness expectations. Federal procurement rules that require ≥100 lumens per watt push specifiers toward pre-certified SKUs, trimming bid timelines on B2B portals. The e-commerce market for lighting industry size also gains from municipal smart-city tenders that order thousands of sensor-embedded luminaires in one click.


By Product Type: Smart Controls Outpace Commodity Bulbs
LED bulbs and lamps captured 38.43% of 2025 revenue but face price erosion as generic A19 bulbs retail for under USD 2 on global marketplaces. Smart controls, however, are forecast to grow at 7.42% CAGR as Matter-certified retrofit dimmers exploit existing LED bases and create annuity-style firmware and cloud-storage income for vendors.
The e-commerce market for lighting industry attached to smart controls benefits from premium pricing and subscription analytics that monitor energy and occupancy. By contrast, traditional fluorescent and halogen SKUs decline in double digits after the 2028 DOE backstop removes sub-120-lumen-per-watt lamps from retail channels.
By Sales Channel: Marketplaces Cede Share To Direct Brands
Third-party marketplaces collected 48.77% of 2025 sales, underpinned by 2 million active Amazon merchants, but referral and fulfillment fees cut into profits and motivate manufacturers to pivot toward direct portals that are growing at 7.71% CAGR. “Buy with Prime” plugins let brands bolt Amazon logistics onto proprietary storefronts while retaining valuable first-party customer data.
Specialty e-tailers such as Build dot com curate architectural fixtures, charging premiums for design consultation, and corporate portals gate trade accounts with volume discounts. The e-commerce market for lighting industry share is likely to tilt gradually toward these direct environments as brands add interactive configurators, photometric simulations and subscription firmware services that marketplaces cannot replicate.
By Delivery Model: Express Shipping Redefines Expectations
Standard ground held 54.43% of deliveries in 2025 because it remains cheapest for bulk orders, yet express and same-day services are advancing at an 8.12% CAGR as electric van fleets and urban drone corridors shorten lead times below two hours in core metros. Fewer handling nodes cut breakage on glass globes, encouraging contractors to pay premiums for reliable speed.
Click-and-collect resonates with urban shoppers who want instant pickup without paying delivery fees, while drop-shipping expands SKU variety but raises variability in packaging quality and transit times, increasing return risk. The bifurcation underscores an opportunity for specialized logistics providers to package fixtures securely and offer white-glove installation booked at checkout.
Geography Analysis
Asia-Pacific, the largest territory, held 40.42% of revenue in 2025 and is tracking an 8.31% CAGR through 2031 as tier-2 Indian cities and Indonesian metros leapfrog to two-hour quick-commerce deliveries of LED bulbs. China’s 14th Five-Year Plan sets a 70% LED penetration target in commercial properties, channelling state tenders toward domestic e-procurement sites. Mobile payment ubiquity via UPI and GrabPay unlocks new cohorts of shoppers previously constrained by cash-on-delivery limitations.
North America ranks second in the e-commerce market for lighting industry, buoyed by stringent state energy codes, expansive same-day logistics grids and smart-home penetration that now exceeds 50% of broadband households. B2B portals integrate with contractor ERP systems, letting electricians auto-import BOMs and cut purchase orders in minutes.Europe grows steadily on the back of the Digital Services Act, which purges unsafe imports and fortifies consumer trust while requiring marketplaces to shoulder VAT on low-value entries. Quick-commerce nodes in Paris, Berlin and Madrid promise two-hour delivery, yet cross-border fulfillment still grapples with divergent recycling-fee regimes and customs declarations.
Middle East momentum stems from smart-city programs; Saudi Arabia’s USD 500 billion NEOM earmarks networked streetlights with air-quality sensors, creating new bulk e-tender workflows. South America contends with high import tariffs but pockets of growth emerge in São Paulo where utilities offer LED rebates to curb rising electricity prices. Africa remains nascent at under 5% e-commerce penetration, but solar-LED kits paid through mobile-money are gaining traction in Kenya and Nigeria.

Competitive Landscape
Signify, Acuity Brands, AMS Osram, Eaton and Legrand together command roughly 35-40% of online revenue, indicating a moderately concentrated field where scale confers advantage in testing, certification and logistics. Signify generated 87% of Q3 2024 sales from LED products and now bundles Interact cloud analytics with hardware, turning one-off sales into annuity contracts.[3]Signify N.V., “Q3 2024 Results,” RESULTS.SIGNIFY.COM
Acuity Brands follows a similar path, using its Intelligent Spaces Group to integrate lighting, HVAC and security data after acquiring Savant Systems for USD 340 million in 2022. AMS Osram divested automotive lighting for EUR 800 million (USD 850 million) in 2024 to focus on UV-C disinfection LEDs and micro-display niches. Eaton and Hubbell deploy contractor-centric portals that auto-generate photometric files and integrate with Revit, streamlining specification workflows.
Challenger brands Nanoleaf and Yeelight cultivate Generation Z through Instagram live-shopping and list modular panels that double as décor, capturing price premiums of up to 40% over commodity fixtures. Compliance overhead from the Digital Services Act narrows the long tail, favoring vertically integrated manufacturers able to absorb new costs. Amazon’s marketplace, home to 60% third-party sales, remains indispensable for reach, yet escalating fulfillment fees drive brands toward omnichannel mixes that safeguard gross margin.
Leaders of E-commerce Market For Lighting Industry
Savant Systems Inc.
Signify NV
Panasonic Corporation
AMS Osram AG
Acuity Brands Inc.
- *Disclaimer: Major Players sorted in no particular order

Recent Industry Developments
- November 2025: Signify partnered with Google Cloud to fuse Interact analytics with Google’s building-management suite, enabling real-time occupancy insights for office landlords in New York and San Francisco.
- September 2025: Acuity Brands acquired a minority stake in a European smart-building software firm, extending Intelligent Spaces Group coverage across the EU.
- July 2025: Eaton launched a direct U.S. and Canadian portal for residential lighting, selling Matter-ready switches and paid firmware updates.
- May 2025: Panasonic allocated USD 150 million to lift LED output at its Osaka facility, addressing supply constraints for commercial orders across Asia-Pacific.


Scope of Report on E-commerce Market For Lighting Industry
The E-commerce Market for the Lighting Industry refers to the online buying and selling of lighting products such as LED bulbs, fixtures, smart lights, chandeliers, outdoor lighting, and commercial lighting through digital channels (websites, apps, marketplaces) instead of traditional physical retail stores.
The E-commerce Market for Lighting Industry Report is Segmented by End-User (Residential, Commercial, Industrial, and Municipal and Government), Product Type (LED Fixtures, LED Bulbs and Lamps, Smart Lighting Controls, and Traditional Lighting), Sales Channel (Brand-Owned Websites, Third-Party Marketplaces, and Online Specialty Retailers), Delivery Model (Standard Shipping, Express/Same-Day Delivery, Click-and-Collect, and Drop Shipping), and Geography (North America, South America, Europe, Asia-Pacific, and Middle East and Africa). The Market Forecasts are Provided in Terms of Value (USD).
| Residential |
| Commercial |
| Industrial |
| Municipal and Government |
| LED Fixtures |
| LED Bulbs and Lamps |
| Smart Lighting Controls |
| Traditional Lighting |
| Brand-Owned Websites |
| Third-Party Marketplaces |
| Online Specialty Retailers |
| Standard Shipping |
| Express/Same-Day Delivery |
| Click-and-Collect |
| Drop Shipping |
| North America | United States | |
| Canada | ||
| Mexico | ||
| South America | Brazil | |
| Argentina | ||
| Rest of South America | ||
| Europe | Germany | |
| United Kingdom | ||
| France | ||
| Spain | ||
| Rest of Europe | ||
| Asia-Pacific | China | |
| Japan | ||
| India | ||
| South Korea | ||
| Australia and New Zealand | ||
| Rest of Asia-Pacific | ||
| Middle East and Africa | Middle East | Saudi Arabia |
| United Arab Emirates | ||
| Turkey | ||
| Rest of Middle East | ||
| Africa | South Africa | |
| Egypt | ||
| Nigeria | ||
| Rest of Africa | ||
| By End-User | Residential | ||
| Commercial | |||
| Industrial | |||
| Municipal and Government | |||
| By Product Type | LED Fixtures | ||
| LED Bulbs and Lamps | |||
| Smart Lighting Controls | |||
| Traditional Lighting | |||
| By Sales Channel | Brand-Owned Websites | ||
| Third-Party Marketplaces | |||
| Online Specialty Retailers | |||
| By Delivery Model | Standard Shipping | ||
| Express/Same-Day Delivery | |||
| Click-and-Collect | |||
| Drop Shipping | |||
| By Geography | North America | United States | |
| Canada | |||
| Mexico | |||
| South America | Brazil | ||
| Argentina | |||
| Rest of South America | |||
| Europe | Germany | ||
| United Kingdom | |||
| France | |||
| Spain | |||
| Rest of Europe | |||
| Asia-Pacific | China | ||
| Japan | |||
| India | |||
| South Korea | |||
| Australia and New Zealand | |||
| Rest of Asia-Pacific | |||
| Middle East and Africa | Middle East | Saudi Arabia | |
| United Arab Emirates | |||
| Turkey | |||
| Rest of Middle East | |||
| Africa | South Africa | ||
| Egypt | |||
| Nigeria | |||
| Rest of Africa | |||


Key Questions Answered in the Report
What is the current value of online lighting sales globally?
The e-commerce market for lighting market totals USD 12.72 billion in 2026 and is projected to reach USD 17.81 billion by 2031.
How quickly are digital lighting sales expanding?
The sector is expected to register a 6.96% CAGR between 2026 and 2031, propelled by LED mandates, AI-driven shopping tools and faster fulfillment networks.
Which region generates the highest online lighting revenue?
Asia-Pacific leads with 40.42% share in 2025 and is also the fastest-growing region, forecast at an 8.31% CAGR between 2026 and 2031.
Why are smart lighting controls attracting investment?
Matter-certified retrofit switches and dimmers add intelligence to existing LEDs, deliver subscription revenue and are projected to grow at a 7.42% CAGR through 2031.
What is the biggest logistical challenge in shipping lighting products?
Fragility drives a 17.6% return rate, making damage-free same-day delivery and secure packaging vital for profitability.
Page last updated on:


