Hovercraft Market Size and Share
Market Overview
| Study Period | 2019 - 2031 |
|---|---|
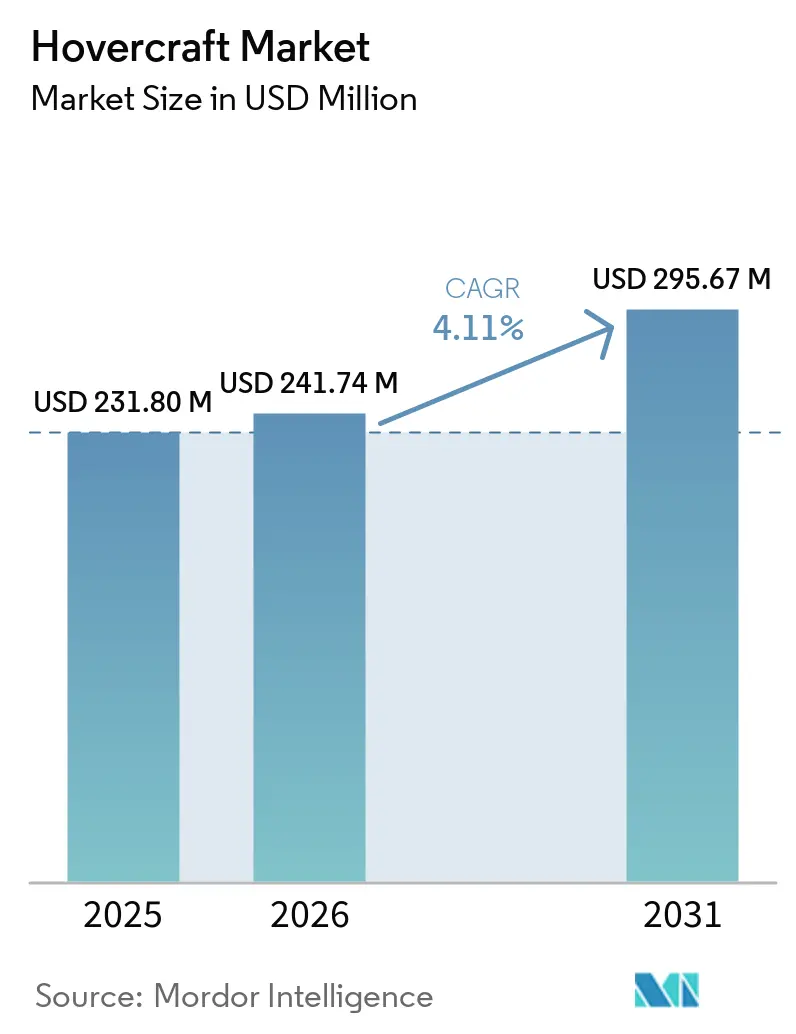
| Market Size (2026) | USD 241.74 Million |
| Market Size (2031) | USD 295.67 Million |
| Growth Rate (2026 - 2031) | 4.11% CAGR |
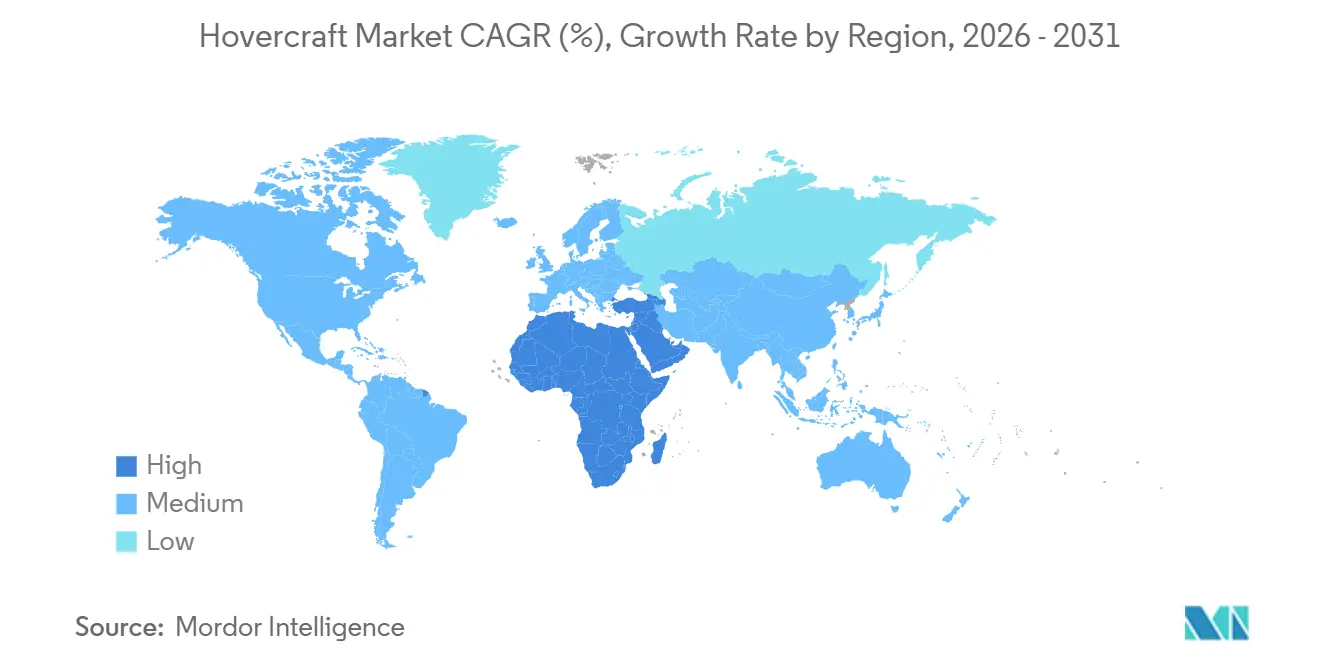
| Fastest Growing Market | Middle East and Africa |
| Largest Market | Asia Pacific |
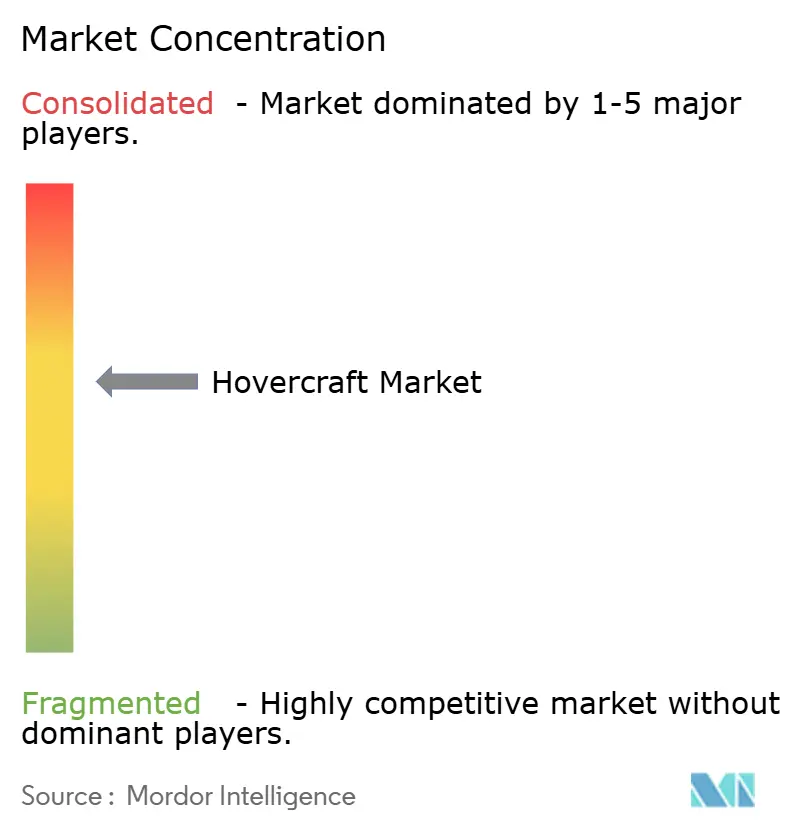
| Market Concentration | Medium |
Major Players *Disclaimer: Major Players sorted in no particular order Image © Mordor Intelligence. Reuse requires attribution under CC BY 4.0. | |
Hovercraft Market Analysis by Mordor Intelligence
The hovercraft market size is expected to grow from USD 231.80 million in 2025 to USD 241.74 million in 2026 and is forecasted to reach USD 295.67 million by 2031 at a 4.11% CAGR over 2026-2031. Military fleet recapitalization, municipal flood-response spending, offshore-wind logistics, and propulsion innovations are converging to broaden demand beyond traditional defense customers. Medium craft dominate defense lift requirements, yet small electric units are multiplying within city emergency fleets. Diesel engines still power the majority of the installed base, but fully electric configurations are gaining traction as battery energy density surpasses 300 Wh/kg. The Asia-Pacific region remains the largest customer bloc, while the Middle East and Africa are registering the fastest revenue growth as offshore operators shift crew transfers from helicopters to surface-effect vessels. Competitive intensity is rising as hydrofoils and ground-effect craft pursue high-speed coastal routes, pressuring incumbents to accelerate zero-emission upgrades.
Key Report Takeaways
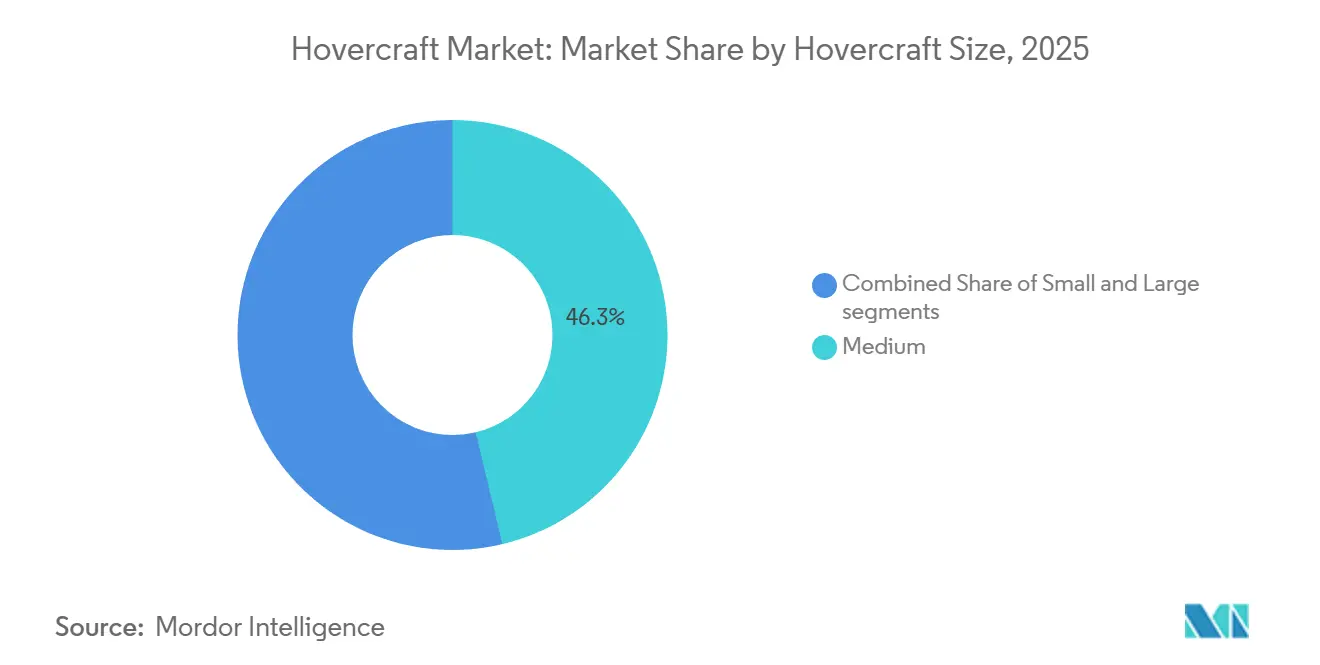
- By hovercraft size, medium craft led with 46.27% revenue share in 2025; small craft are projected to expand at a 5.23% CAGR to 2031.
- By application, defense and security accounted for 37.44% of the 2025 hovercraft market share; offshore energy support is forecasted to post a 5.24% CAGR through 2031.
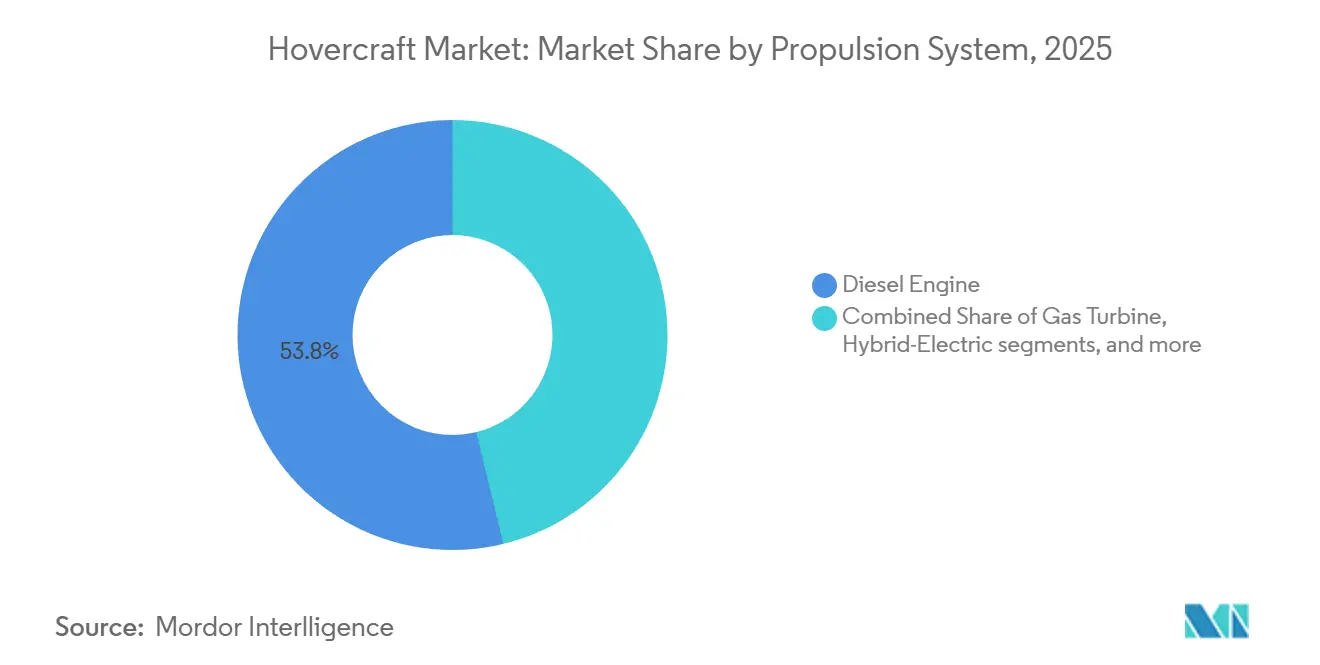
- By propulsion system, diesel engines held 53.81% of the 2025 installed base; fully electric designs are expected to grow at a 9.11% CAGR over the outlook period.
- By end user, military buyers comprised 61.23% of 2025 sales; commercial operators are set to advance at a 4.87% CAGR to 2031.
- By geography, Asia-Pacific captured 33.11% of 2025 demand; the Middle East and Africa hovercraft market is projected to expand at a 6.01% CAGR through 2031.
Note: Market size and forecast figures in this report are generated using Mordor Intelligence’s proprietary estimation framework, updated with the latest available data and insights as of January 2026.
Global Hovercraft Market Trends and Insights
Drivers Impact Analysis*
| Driver | (~) % Impact on CAGR Forecast | Geographic Relevance | Impact Timeline |
|---|---|---|---|
| Rising demand for amphibious transport amid climate-driven floods | +1.2% | Global with focus on South Asia, Southeast Asia, North America | Medium term (2-4 years) |
| Military fleet replacement cycles for modern assault craft | +0.9% | North America, Asia-Pacific, Europe | Long term (≥ 4 years) |
| Advances in low-noise electric and hydrogen propulsion | +0.7% | Europe, North America, Asia-Pacific | Medium term (2-4 years) |
| Relaxed regulations supporting commercial passenger services | +0.4% | Europe, Asia-Pacific, Middle East | Short term (≤ 2 years) |
| Offshore energy and polar logistics requirements | +0.6% | Middle East, North America, Europe | Medium term (2-4 years) |
| Increased investment in flood-oriented emergency response | +0.5% | Asia-Pacific, North America, Europe | Short term (≤ 2 years) |
| Source: Mordor Intelligence | |||


Rising Demand for Amphibious Transport Driven by Climate-Related Flooding
Extreme rainfall pushed coastal cities to seek all-terrain craft that can traverse submerged streets, debris-laden canals, and ice-choked rivers. India’s PROTECT-funded disaster program and the US Department of Transportation’s (DoT's) USD 9 billion resilience fund both create grant pathways for municipal hovercraft procurement.[1] U.S. Department of Transportation, “Climate Adaptation Plan 2024-2027,” transportation.gov Provincial and county-level agencies in the Netherlands and the United Kingdom are trialing air-cushion rescue fleets for dike-breach scenarios where boats draw too much draft and wheeled vehicles stall in mud. Leasing models are emerging because flood events are episodic, allowing cities to secure capabilities without a permanent capital outlay. Demand spikes concentrate in South and Southeast Asia during monsoon seasons and along the US Gulf Coast during hurricane months, creating a predictable but short deployment window. Manufacturers that supply modular, quickly deployable small craft stand to capture this cyclical but resilient revenue stream.
Military Fleet Replacement Cycles for Modern Assault and Logistics Hovercraft
The US Navy’s Ship-to-Shore Connector (SSC) program exemplifies the typical decade-long timeline of defense recapitalization. The first experimental unit sailed in 2020, and deliveries under the USD 394.3 million follow-on order are expected to run through 2030. Modern SSC hulls can lift 74 tons, enough to support an M1A2 tank, while halving the gearbox count, which reduces life-cycle maintenance costs. China’s December 2024 launch of the Type 076 amphibious assault ship widens the Pacific arms race by adding a well deck sized for landing craft and hovercraft. Nordic states echo the trend; Finland ordered three 12.7 m Arctic-capable units from Griffon Marine in 2025 for ice patrol duties. Although defense budgets absorb cost overruns better than municipal coffers, competing programs such as the Polar Security Cutter in the United States siphon funds, slowing auxiliary hovercraft acquisitions.
Advances in Low-Noise Electric and Hydrogen Propulsion Technologies
Coastal noise limits below 75 dB(A) exclude legacy diesel hovercraft from many commuter and eco-tourism routes. The ZEHPHyr consortium is retrofitting 12-seat and 80-seat craft with hydrogen fuel cells and high-power batteries after securing a grant, targeting commercial proof of concept after 2025.[2] Aquatera, “Hydrogen Powered Hovercraft Feasibility Project Gets Green Light,” aquatera.co.uk Early trials show 20-30 dB reductions compared to diesel, as electric fans eliminate the noise of combustion. The Canadian Coast Guard is studying full battery and hybrid options for its next-generation fleet, aligning with the IMO’s net-zero 2050 pathway. Battery packs with a capacity of 250-280 Wh/kg already enable a 100-nautical-mile range for sub-15-meter hulls, and industry roadmaps project 400 Wh/kg solid-state cells by 2028, which would unlock medium-class routes. Infrastructure remains a bottleneck; hydrogen bunkering is available at fewer than 10 commercial ports worldwide, resulting in roughly a 20% increase in operating costs compared to diesel.
Growing Offshore Energy and Polar Logistics Requirements
Offshore wind build-out in the North Sea, Arabian Gulf, and US Atlantic seaboard is shifting crew transfers from helicopters to surface-effect vessels, which reduces fuel burn and weather-related downtime. Strategic Marine’s three AIRCAT 35 units, delivered to Angola for USD 45 million, carry 80 technicians at 50 knots and cut heli budgets by millions. ADNOC is outfitting the region’s first autonomous 60m landing craft with hybrid-electric propulsion, which promises a 30% reduction in CO2 emissions when it launches in 2026. Arctic trade lanes add another layer: Rostec’s Husky-10, rated to –50 °C, is ready for serial production to serve Northern Sea Route outposts. A 2024 Nature study forecasts year-round Arctic navigability after 2065, suggesting a long-term demand for shallow-draft craft capable of gliding over newly formed ice sheets. Logistics firms that unlock persistent high-latitude operations will gain an early-mover advantage in mining, research, and emergency response.
Restraints Impact Analysis*
| Restraint | (~) % Impact on CAGR Forecast | Geographic Relevance | Impact Timeline |
|---|---|---|---|
| High operating noise and environmental restrictions in coastal regions | -0.6% | Europe, North America, Asia-Pacific | Short term (≤ 2 years) |
| Scarcity of certified pilots and specialized maintenance technicians | -0.5% | Global | Medium term (2-4 years) |
| Competition from ground-effect vehicles and hydrofoil vessels | -0.4% | North America, Europe, Asia-Pacific | Medium term (2-4 years) |
| Fuel cost volatility impacting military procurement cycles | -0.3% | Global | Short term (≤ 2 years) |
| Source: Mordor Intelligence | |||
High Operating Noise and Environmental Restrictions in Coastal Regions
Gas-turbine and high-RPM diesel fans routinely exceed 85 dB(A), breaching the US National Park Service’s 75 dB(A) underway limit and comparable rules in California and Scandinavia.[3]U.S. National Park Service, “Noise Regulations,” nps.gov Port authorities at Southampton, San Francisco, and Osaka have imposed seasonal curfews that curtail tourist runs and ferry schedules. Operators pursuing compliance must derate engines, add acoustic shields, or switch to electric drives, each option imposing range or cost penalties. Hovertravel, the world’s oldest passenger service, continues its Solent operations under community scrutiny and is now studying the repower of its fleet with battery-electric technology to preserve its 60-year route. Unless zero-emission retrofits reach economic parity by 2028, operators may divert investment toward hydrofoil alternatives that sail under stricter noise caps.
Scarcity of Certified Pilots and Specialized Maintenance Technicians
Hovercraft piloting blends marine navigation with aviation-style pitch and lift control, yet few national authorities offer type-specific ratings. The US Coast Guard’s NVIC 20-14 sets high-speed-craft benchmarks, but only a handful of schools run hover-specific courses. Skirt maintenance skills are equally scarce; rubberized fabric degrades rapidly on ice or coral, demanding patch rigs and heat-bond techniques unfamiliar to conventional shipyards. Griffon Marine limits skirt warranties to 500 hours, shifting replacement cost to operators in harsh environments. Workforce gaps lead to higher downtime, which inflates commercial operating costs by an estimated 12-15%. Without coordinated academy programs and manufacturer support, skill shortages will continue to cap capacity additions through the medium term.
*Our forecasts treat driver/restraint impacts as directional, not additive. The impact forecasts reflect baseline growth, mix effects, and variable interactions.
Segment Analysis
By Hovercraft Size: Small Craft Gain as Municipalities Prioritize Flood Response
Medium units secured 46.27% of 2025 revenue due to defense and offshore logistics missions, while the small-craft cohort is forecast to grow at 5.23% CAGR as cities adopt electric rescue fleets and leisure users upgrade to zero-emission models, reinforcing momentum in the hovercraft market.[4]Naval Sea Systems Command, “Ship to Shore Connector Program Updates,” navsea.navy.mil Medium hulls, such as the 74-ton SSC, will remain integral to force-projection strategies, and Russia’s Husky-10 demonstrates how Arctic payload needs sustain mid-size demand.
Small designs under 15 meters are winning budget-constrained tenders from Finnish and Canadian agencies keen on rapid-response patrols. Battery weights scale linearly with hull volume, allowing compact footprints to reach 100-nautical-mile range thresholds sooner, thereby fueling the expansion of the hovercraft market at the municipal level. Large craft face a contracting customer base outside China and Russia because amphibious mothership decks remain limited. As a result, producers that master modular small-craft production stand to capture rising orders without the multiyear defense procurement lag.


By Application: Offshore Energy Support Outpaces Defense as Wind Farms Multiply
Defense retained 37.44% of the 2025 value. Still, offshore energy support is projected to deliver a 5.24% CAGR through 2031, the fastest among the tracked uses, as wind farm operators shift from helicopters to high-speed surface-effect shuttles. Passenger ferries, exemplified by Hovertravel, face pressure from hydrofoil rivals that promise lower noise and fuel costs.
Search-and-rescue (SAR) and surveying remain niche yet strategically vital, especially as polar routes become more accessible. Offshore crew transfer economics drive recurring contracts that spread capital cost over daily rotations, contrasting with episodic defense buys. Segment operators who can certify hulls to both the IMO and offshore wind classification societies will anchor premium margins, underlining a demand pivot that diversifies the hovercraft market share away from traditional military reliance.
By Propulsion System: Fully Electric Surges as Batteries Cross 300 Wh/kg
Diesel engines comprised 53.81% of the 2025 fleet, but fully electric builds are expected to record a 9.11% CAGR to 2031, the steepest trajectory within the hovercraft industry. Hydrogen projects remain pilot-scale because onshore bunkering costs hover near USD 30 per kilogram, while hybrid-electric bridges allow diesel range retention in offshore lanes.
Regulators in the UK and Norway published decarbonization roadmaps, which are influencing procurement specifications that prioritize zero-emission readiness. The hovercraft market size for electric craft is driven by municipal operators, whose duty cycles seldom exceed 50 nautical miles. Diesel will still dominate heavy lift and extended-range missions, but OEMs that secure battery-safe classification and fan-motor acoustics below 70 dB will shape future tenders.
By End User: Commercial Operators Gain as Regulatory Frameworks Mature
Military entities bought 61.23% of units in 2025, yet commercial customers are forecast to post a 4.87% CAGR as certification reforms and offshore logistics demand converge. Passenger routes, offshore energy, and flood-response leasing all align with business models that offer a measurable return on invested capital, which contrasts with defense’s long budgeting cycles.
EASA’s 2025 VTOL guidance clarifies pathways for commercial air-cushion services, lowering compliance costs and spurring fleet investments across Europe, Australia, and the Gulf. The hovercraft market now features leasing pools that redeploy assets between flood season and offshore work, smoothing utilization and cash flow. Military orders still deliver higher unit prices, but commercial volume will accelerate diversification and dampen political risk in OEM backlogs.
Geography Analysis
The Asia-Pacific region accounted for 33.11% of 2025 deliveries, as China, Japan, and India bolstered their amphibious and disaster response capabilities. The region’s naval programs, including China’s Type 076 launch, anchor baseline demand, while emerging municipal orders across South Asia add incremental volume. However, the hovercraft market share leadership is gradually being challenged by the Middle East and Africa, which are projected to grow at a 6.01% CAGR, driven by offshore oil crew-transfer contracts and Red Sea security patrols.
Gulf operators, such as ADNOC and Saudi Aramco, quantify helicopter cost savings in the tens of millions of dollars annually, prompting further investment in hybrid-electric crew liners. Angola’s AIRCAT 35 deployment reflects similar economic conditions in West African oil plays. Europe, although hampered by tighter environmental scrutiny, maintains a steady pipeline via Arctic patrol procurements and the long-running Solent passenger service.
North America benefits from the SSC fleet renewal cycle and Canadian zero-emission design studies. Yet, US Coast Guard budget reallocations toward icebreakers slow auxiliary hovercraft buys, moderating regional expansion. South America remains underpenetrated, where shallow-draft steel boats undercut the acquisition costs of air-cushion vessels. Overall, the hovercraft market is increasingly mirroring global energy investment patterns, with high-growth corridors tied to wind-farm and hydrocarbon hubs.

Competitive Landscape
The hovercraft market is moderately consolidated. Five established suppliers - Textron Systems Corporation (Textron Inc.), Neoteric Hovercraft Inc., The British Hovercraft Company Ltd., Griffon Hoverwork Ltd., and Airlift Hovercraft Pty Ltd. - account for a prominent share of demand, primarily through exclusive military and government contracts. Textron Systems Corporation (Textron Inc.) anchors US defense contracts, while Griffon Hoverwork Ltd. leads European government deals and Rostec spearheads Arctic solutions.
Strategic differentiation centers on propulsion R&D and regulatory alignment. Griffon Marine collaborates with Aquatera and Bramble Energy on hydrogen prototypes to position for zero-emission coastal routes. Textron files hybrid-drive patents but remains tied to gas-turbine military programs. ADNOC’s autonomous landing craft initiative signals operator-led innovation that could bypass legacy builders. Hydrofoil developers Regent and Artemis contend for passenger routes with USD 9 billion in pre-orders, injecting competitive pressure that accelerates product refresh cycles.
Partnerships with classification societies and battery integrators are now as critical as expertise in composite hulls. Suppliers that lock in battery supply at a price below USD 120/kWh or secure noise certificates at levels below 70 dB(A) will capture premium segments. Conversely, vendors slow to pivot risk relegation to low-margin, fuel-intensive niches as the hovercraft market tilts toward electrified, regulated corridors.
Hovercraft Industry Leaders
Textron Systems Corporation (Textron Inc.)
Neoteric Hovercraft Inc.
The British Hovercraft Company Ltd.
Griffon Hoverwork Ltd.
Airlift Hovercraft Pty Ltd.
- *Disclaimer: Major Players sorted in no particular order

Recent Industry Developments
- December 2025: Griffon Marine secured a contract from the Finnish Border Guard (FBG) to construct and deliver three 2000TD-class hovercraft, with all vessels scheduled for delivery between 2026 and 2027.
- March 2025: The US Navy received its 13th Ship to Shore Connector, LCAC 112, from Textron Systems Corporation (Textron Inc.), after successful acceptance trials. This SSC program unit replaces existing LCACs while incorporating modern materials, propulsion systems, and onboard technologies.
- August 2023: The US Navy awarded Textron Systems Corporation (Textron Inc.) a USD 394.2-million contract to construct nine LCAC 100 vessels, following previous orders in 2023 and 2024. Construction completion is scheduled for September 2030.


Research Methodology Framework and Report Scope
Market Definitions and Key Coverage
Our study defines the hovercraft market as revenue generated from newly manufactured air-cushion vehicles that ride on a continuous sheet of pressurized air and can transition seamlessly between water, ice, swamp, and solid ground. These platforms are counted at the point of original sale, including craft purpose-built for military lift, civilian transport, offshore energy support, disaster response, and leisure operations.
Vehicles that achieve lift through wing-in-ground effect, personal hoverboards, and refurbished or second-hand craft are outside this scope.
Segmentation Overview
- By Hovercraft Size
- Small
- Medium
- Large
- By Application
- Defense and Security
- Passenger Ferry Services
- Offshore Energy Support
- Search and Rescue
- Surveying and Mapping
- Agricultural and Environmental Management
- By Propulsion System
- Diesel Engine
- Gas Turbine
- Hybrid-Electric
- Fully Electric
- Hydrogen Fuel-Cell
- By End User
- Military
- Commercial
- By Geography
- North America
- United States
- Canada
- Mexico
- Europe
- United Kingdom
- France
- Germany
- Italy
- Rest of Europe
- Asia-Pacific
- China
- India
- Japan
- South Korea
- Australia
- Rest of Asia-Pacific
- South America
- Brazil
- Argentina
- Rest of South America
- Middle East and Africa
- Middle East
- Saudi Arabia
- United Arab Emirates
- Rest of Middle East
- Africa
- South Africa
- Rest of Africa
- Middle East
- North America
Detailed Research Methodology and Data Validation
Primary Research
Mordor analysts interviewed hovercraft builders, naval architects, coast-guard officers, and offshore logistics contractors across North America, Europe, and Asia Pacific. These conversations validated average selling prices, clarified typical fleet retirement ages, and tested our assumptions on payload-driven demand swings following heightened defense budgets.
Desk Research
We began with open government sources such as United States Department of Defense contract releases, Eurostat trade codes for HS-880590, and the United Kingdom Maritime & Coastguard Agency vessel registry, which reveal procurement volumes and route deployments. Trade associations like the International Maritime Rescue Federation and the Society of Naval Architects & Marine Engineers supply data on rescue mission counts and hull material trends. Company 10-Ks, investor decks, and reputable media coverage retrieved through Dow Jones Factiva complemented these inputs. Where supplier revenues were opaque, D&B Hoovers helped us approximate segment sales. The sources cited are illustrative; many additional publications were consulted to corroborate figures and fill gaps.
Market-Sizing & Forecasting
We constructed a top-down model that starts with national defense and commercial transport spending pools, followed by penetration-rate assessments that translate budgets into likely hovercraft procurement. Selective bottom-up checks, supplier revenue roll-ups and sampled ASP × unit deliveries, are then used to fine-tune totals. Key variables include (1) defense capital expenditure by branch, (2) count of passenger ferry routes shorter than 50 km, (3) offshore energy platform additions, (4) reported search-and-rescue incidents, and (5) average unit selling price by craft size. A multivariate regression with ARIMA overlay projects each driver through 2030; expert consensus shapes scenario bounds when data are volatile. Where supplier splits were missing, we prorated sales using historical shipment shares and re-verified figures with regional distributors.
Data Validation & Update Cycle
Outputs pass three analyst reviews that compare modeled revenue with independent vessel launch databases and customs declarations. Anomalies trigger call-backs to industry contacts before sign-off. Reports refresh yearly, and material events such as large naval orders prompt interim updates; a final sense-check is run just before client delivery.
Why Our Hovercraft Baseline Commands Reliability
Published market values differ because firms define craft classes, convert currencies, and refresh data on divergent schedules.
Key Gap Drivers include varied treatment of custom military programs, inclusion or exclusion of commercial passenger refits, and inconsistent inflation adjustments.
Benchmark comparison
| Market Size | Anonymized source | Primary gap driver |
|---|---|---|
| USD 229.79 M (2025) | Mordor Intelligence | - |
| USD 167.6 M (2024) | Global Consultancy A | Wider reliance on historical unit exports; excludes offshore energy support craft |
| USD 282.6 M (2025) | Industry Association B | Counts experimental wing-in-ground effect vessels and applies list prices without regional ASP normalization |
These comparisons show that Mordor's tight scope alignment, blended modeling, and annual refresh cadence yield a balanced, transparent baseline that decision-makers can retrace and replicate with confidence.


Key Questions Answered in the Report
What is the global revenue forecast for hovercraft by 2031?
The hovercraft market is projected to reach USD 295.67 million in 2031, up from USD 241.74 million in 2026, reflecting a 4.11% CAGR.
Which application is expected to expand the fastest through 2031?
Offshore energy support leads with a projected 5.24% CAGR as wind farm operators switch from helicopters to surface effect crew boats.
How quickly are fully electric hovercraft sales growing?
Fully electric models are on track for a 9.11% CAGR, the steepest rate among propulsion types, as batteries pass 300 Wh/kg density.
Which region is set to post the highest growth over the forecast window?
The Middle East and Africa are poised for a 6.01% CAGR, driven by offshore-oil logistics and Red Sea security patrols.
What revenue share did medium-size hovercraft hold in 2025?
Medium craft commanded 46.27% of global revenue in 2025, anchored by defense and offshore logistics demand.
Who are the leading suppliers in defense procurement cycles?
Textron Systems Corporation (Textron Inc.) dominates US programs, while Griffon Hoverwork Ltd. secures European contracts.
Page last updated on:


