
Healthcare Reimbursement Market Size and Share
Market Overview
| Study Period | 2020 - 2031 |
|---|---|
| Market Size (2026) | USD 11.13 Trillion |
| Market Size (2031) | USD 14.77 Trillion |
| Growth Rate (2026 - 2031) | 5.82 % |
| Fastest Growing Market | Asia-Pacific |
| Largest Market | North America |
| Market Concentration | Medium |
Major Players *Disclaimer: Major Players sorted in no particular order Image © Mordor Intelligence. Reuse requires attribution under CC BY 4.0. | |
Healthcare Reimbursement Market Analysis by Mordor Intelligence
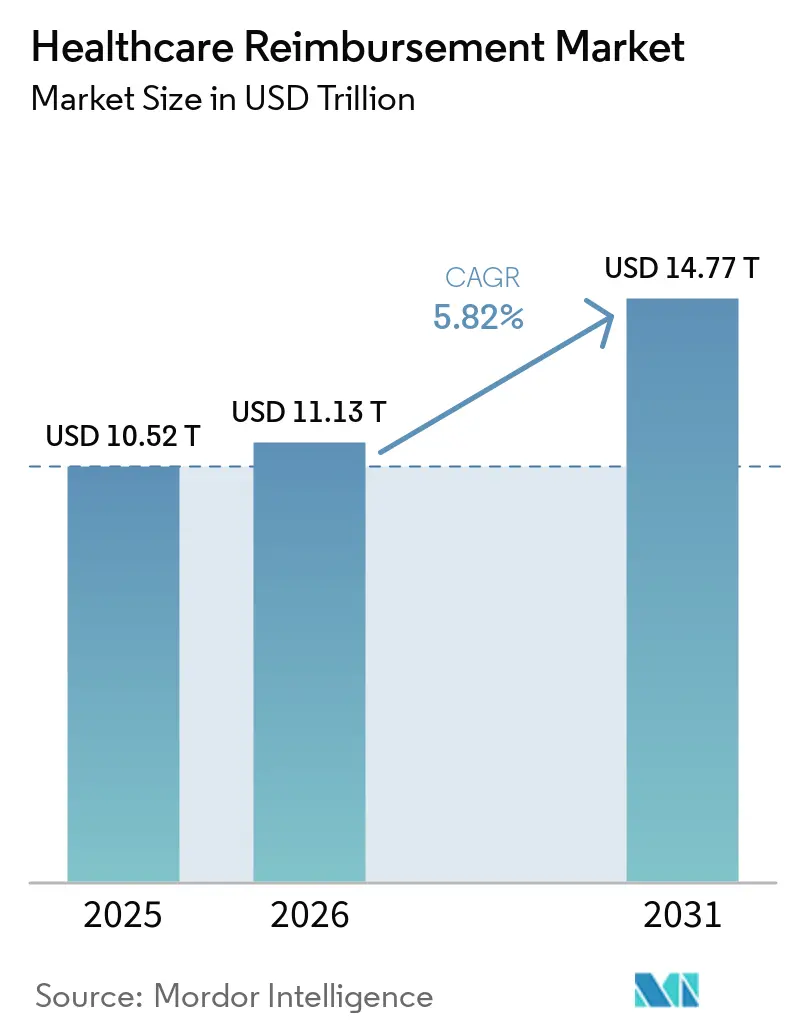
The Healthcare Reimbursement Market size is projected to expand from USD 10.52 trillion in 2025 and USD 11.13 trillion in 2026 to USD 14.77 trillion by 2031, registering a CAGR of 5.82% between 2026 and 2031.
Rising treatment costs are increasing the value and complexity of claims handled by providers and payers. Payment reform is moving reimbursement away from volume-based billing and toward care quality and patient outcomes. This shift requires different reporting, reconciliation, and payment processes across care settings. Payers and providers are also investing in tools that reduce denials, improve coding accuracy, and manage prior authorization. These requirements are widening the role of revenue cycle management platforms in the healthcare reimbursement market.
Key Report Takeaways
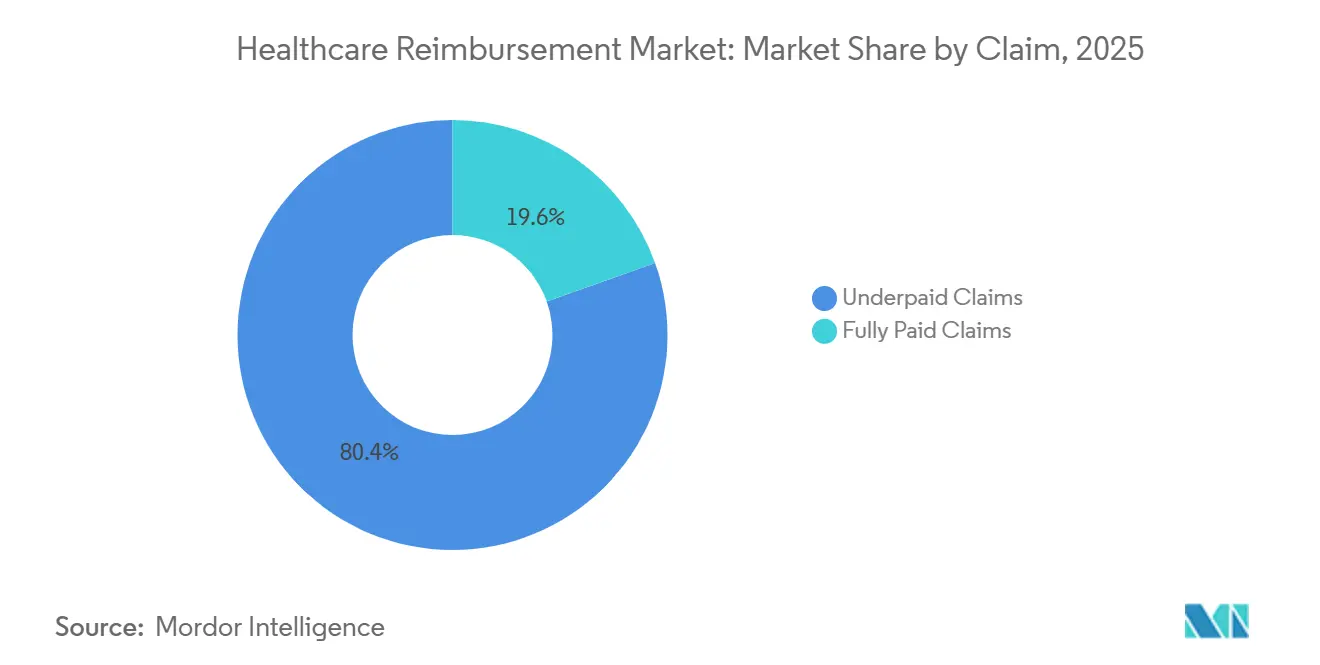
- By claim type, underpaid claims held 80.43% of the healthcare reimbursement market share in 2025, while fully paid claims are forecast to grow at a 7.43% CAGR through 2031.
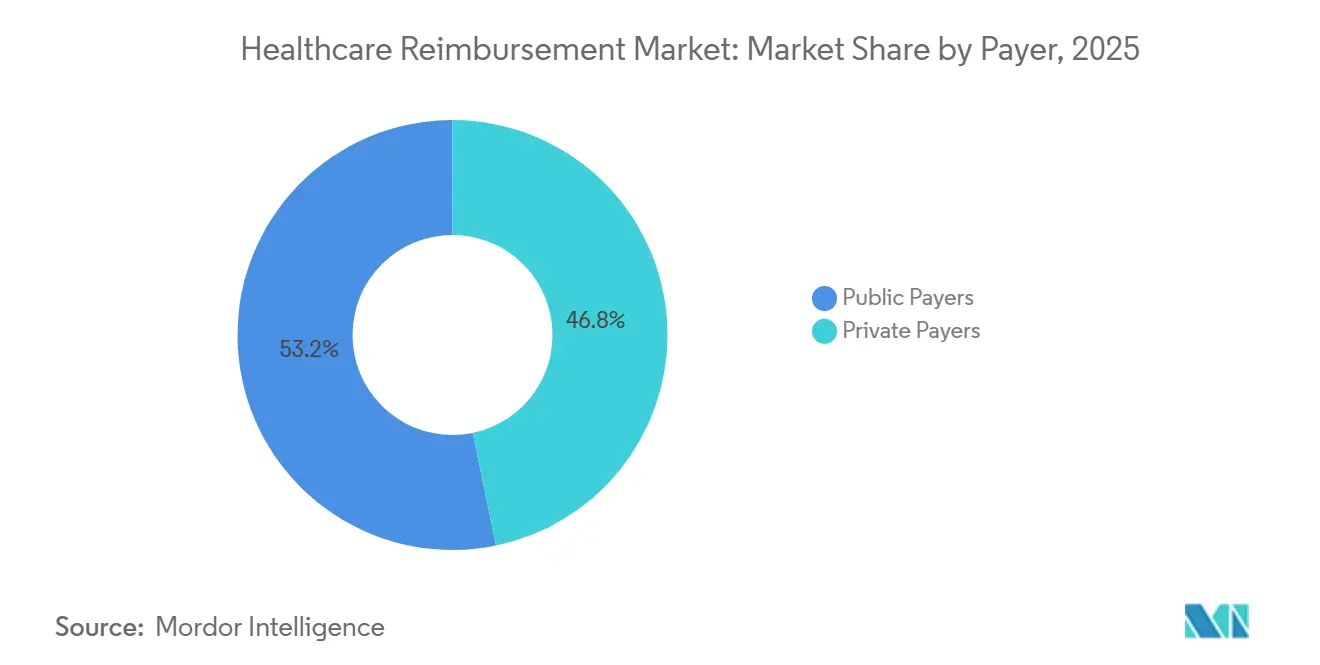
- By payer, public payers held 46.76% of the healthcare reimbursement market share in 2025, while private payers are forecast to grow at a 7.84% CAGR through 2031.
- By service provider, physician offices and clinics held 47.21% of the healthcare reimbursement market share in 2025, while diagnostic laboratories are forecast to grow at a 8.43% CAGR through 2031.
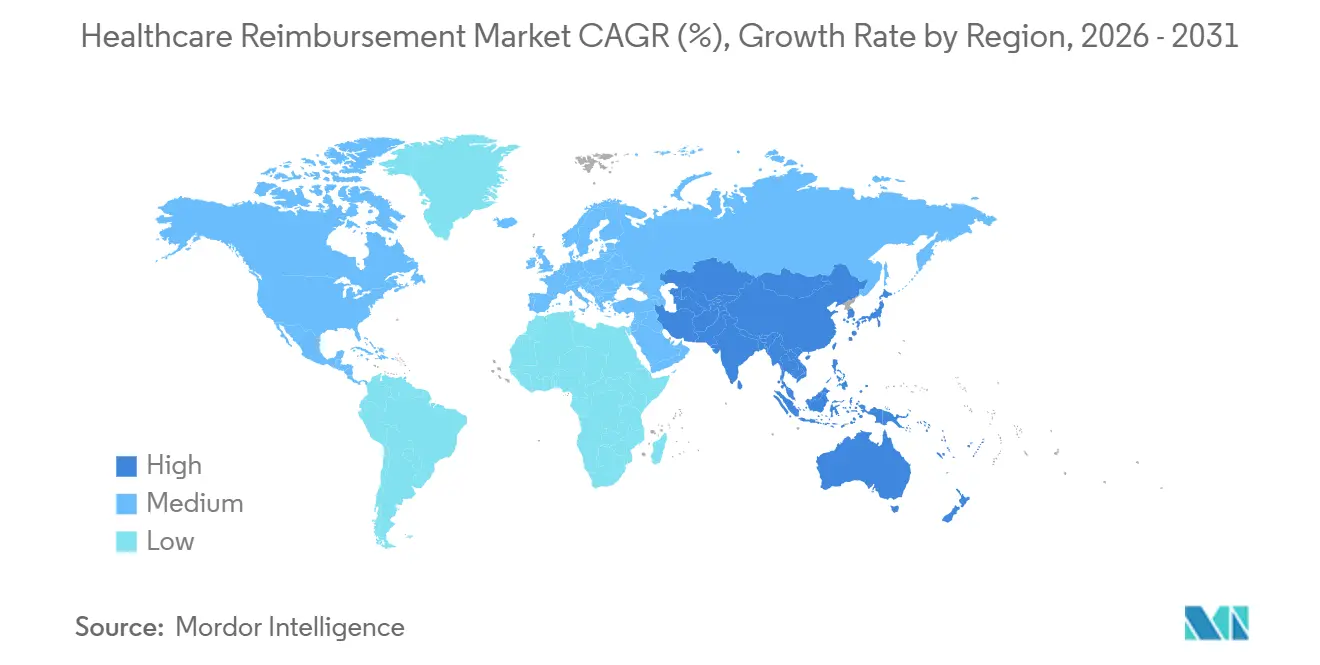
- By geography, North America held 42.54% of the healthcare reimbursement market share in 2025, while Asia-Pacific is forecast to grow at a 6.43% CAGR through 2031.
Note: Market size and forecast figures in this report are generated using Mordor Intelligence’s proprietary estimation framework, updated with the latest available data and insights as of January 2026.
Global Healthcare Reimbursement Market Trends and Insights
Drivers Impact Analysis*
| Driver | (~) % Impact on CAGR Forecast | Geographic Relevance | Impact Timeline |
|---|---|---|---|
| Expansion of Value-Based Care Models | +0.90% | Global, concentrated in North America and Europe | Medium term (2-4 years) |
| Rising Healthcare Service and Treatment Costs | +0.80% | Global, highest in Asia-Pacific, Latin America, and North America | Short term (≤ 2 years) |
| Chronic Disease and Aging-Related Utilization Growth | +0.70% | Global, most acute in Asia-Pacific and North America | Long term (≥ 4 years) |
| Public and Private Insurance Coverage Expansion | +0.50% | Asia-Pacific core, Middle East and Africa emerging, with spillover to South America | Medium term (2-4 years) |
| Digital Therapeutics and Medical AI Reimbursement Pathways | +0.50% | North America and Europe, with early gains in South Korea and Germany | Medium term (2-4 years) |
| Interoperable Real-World Evidence at Payment | +0.40% | Global, with North American and European regulatory frameworks leading | Long term (≥ 4 years) |
| Source: Mordor Intelligence | |||
Expansion of Value-Based Care Models
Value-based care is changing how healthcare reimbursement market participants measure, submit, and reconcile payments. The CMS Shared Savings Program included 511 Accountable Care Organizations serving 12.6 million traditional Medicare beneficiaries in January 2026. Participation increased 12.3% from 2025, which expanded the number of organizations working under shared-savings arrangements[1]Centers for Medicare & Medicaid Services, “2026 Medicare Accountable Care Organization Initiatives Participation Highlights,” CMS, cms.gov.. These arrangements require quality reporting, attribution management, and payment reconciliation beyond routine fee-for-service billing. CMS set the CY2026 qualifying Alternative Payment Model conversion factor at USD 33.57 per relative value unit, a 3.77% increase from 2025. Providers, therefore, need payment systems that can support both established billing processes and outcomes-linked contracts.
Rising Healthcare Service and Treatment Costs
Higher care costs increase pressure on providers to collect the full payment allowed under their contracts. Hospital expenses increased 7.5% in 2025, while drug expenses rose 13.6% and supply expenses rose 9.9%[2]American Hospital Association, “New AHA Report Hospitals Face Increased Challenges and Financial Pressures as They Care for Patients,” American Hospital Association, aha.org.. The American Hospital Association reported that 56% of hospital costs were connected to service lines where reimbursement did not cover the cost of care. This gap makes timely charge capture, correct coding, and denial follow-up more important across the healthcare reimbursement market. Drug spending and outpatient treatment also add claims that often need prior authorization or more supporting documentation. Providers are responding by placing greater attention on payment integrity and revenue recovery workflows.
Chronic Disease and Aging-Related Utilization Growth
Chronic conditions are increasing the number of services that must be coordinated and reimbursed across multiple providers. The Centers for Disease Control and Prevention states that chronic and mental health conditions account for 90% of U.S. annual healthcare expenditures[3]Centers for Disease Control and Prevention, “Fast Facts Health and Economic Costs of Chronic Conditions,” CDC, cdc.gov.. More complex care often involves several specialists, authorizations, and payment rules for a single patient. CMS launched the ACCESS model in July 2026 to support outcome-aligned payments for chronic conditions, including diabetes, chronic kidney disease, hypertension, and depression. The model provides annual payments of USD 90 to USD 420 per beneficiary. This change increases the need for systems that connect clinical activity with payment reporting in the healthcare reimbursement market.
Public and Private Insurance Coverage Expansion
Broader insurance coverage increases the number of claims that require eligibility checks, coding, submission, and adjudication. New coverage programs are especially relevant where providers and payers are building claims operations without long-established systems. CMS stated that bronze and catastrophic Marketplace plans became eligible for Health Savings Accounts in 2026, affecting 1.6 million additional enrollees. The same CMS fact sheet projected average post-tax-credit premiums of USD 50 per month for the lowest-cost HealthCare.gov plan. Each insured member creates an administrative payment pathway as well as an insurance relationship. Automated eligibility, claims routing, and denial management are therefore becoming more relevant as coverage grows across the healthcare reimbursement market.
Restraints Impact Analysis*
| Restraint | (~) % Impact on CAGR Forecast | Geographic Relevance | Impact Timeline |
|---|---|---|---|
| Complex Reimbursement Policies and Coding Requirements | -0.80% | Global, most acute in North America and Europe | Short term (≤ 2 years) |
| Fiscal Pressure on Public Payers and Reimbursement Rates | -0.70% | North America, Europe, and emerging markets with new public programs | Medium term (2-4 years) |
| Fragmented Clinical Data Ownership Across Provider Networks | -0.60% | Global, with particular severity in Asia-Pacific and South America | Long term (≥ 4 years) |
| Dual Fee-for-Service and Downside-Risk Contracts | -0.40% | North America, with early emergence in Europe | Medium term (2-4 years) |
| Source: Mordor Intelligence | |||
Complex Reimbursement Policies and Coding Requirements
Payer-specific rules and changing coding edits make it harder for providers to identify and recover every payment due. U.S. hospitals spent USD 43 billion in 2025 trying to collect insurer payments for care already delivered. The American Hospital Association linked this burden to prior authorization, claim denials, repeated documentation requests, and changing billing rules. Providers must manage different coverage criteria and coding standards across public and private payer contracts. This can delay payment and create contractual adjustments that are difficult to separate from valid adjudications. The resulting workload can limit the efficiency gains expected from healthcare reimbursement market technology.
Fiscal Pressure on Public Payers and Reimbursement Rates
Public payer budgets can constrain payment growth even when utilization and provider costs rise. CMS proposed measures in May 2026 that it projected would reduce Medicaid spending by USD 775 billion over 10 years. The proposed approach would limit some hospital payment rates through changes to state-directed payment rules. Providers with a high Medicaid or Medicare mix may face additional pressure to recover legitimate claims promptly. The American Hospital Association reported that Medicare paid 83 cents for every USD 1 spent by hospitals in 2023. This environment can slow investment capacity while strengthening the case for systems that reduce payment leakage in the healthcare reimbursement market.
*Our forecasts treat driver/restraint impacts as directional, not additive. The impact forecasts reflect baseline growth, mix effects, and variable interactions.
Segment Analysis
By Claim: Underpaid Claims Lead Reimbursement Activity
Underpaid claims held 80.43% of the healthcare reimbursement market share in 2025. Their position reflects the persistent difference between billed amounts, contracted rates, and payments received in multi-payer systems. Providers must review remittances and contractual adjustments to determine whether a payment was correct. This requires claim-level data, payer-specific rules, and staff time. Payment shortfalls are often difficult to identify when they are processed as routine adjustments. These operational gaps support continued demand for payment accuracy tools.
Fully paid claims are forecast to grow at a 7.43% CAGR through 2031. Their growth is linked to earlier identification of documentation and coding gaps before a claim reaches the payer. Eligibility verification and prior authorization automation can also reduce preventable rework. These tools can help claims move toward first-pass resolution. Payers are similarly using automated review to apply coverage and coding rules more consistently. The healthcare reimbursement market, therefore, serves both recovery after an underpayment and prevention before claim submission.


By Payer: Public Payers Lead, While Private Payers Grow Faster
Public payers accounted for 46.76% of the healthcare reimbursement market share in 2025. Medicare, Medicaid, and national health programs create high volumes of claims with detailed coverage and reporting requirements. Public payment rules can change through annual fee schedules and program updates. The CMS CY2026 physician fee schedule maintained separate conversion factors for qualifying Alternative Payment Model participants and other providers' services accurately. This preserves a large need for public program payment administration.
Private payers are forecast to grow at a 7.84% CAGR through 2031. Commercial insurance adds plan-specific authorization, benefit, and appeal requirements for providers. Private plans may also change administrative rules to reduce member and provider friction. UnitedHealthcare stated in 2026 that it would remove prior authorization requirements for 1,700 medical codes. Providers operating across public and private contracts must maintain separate workflows for each payer. This creates a practical opportunity for platforms that consolidate payer rules without removing necessary compliance controls.
By Service Provider: Physician Offices and Clinics Hold the Largest Share
Physician offices and clinics accounted for 47.21% of the healthcare reimbursement market share in 2025. Their share reflects continuing care delivery in outpatient and ambulatory settings. These organizations often manage high claim volumes with fewer internal administrative resources than large hospital systems. They also work across public, commercial, and employer-sponsored plans. Accurate coding and fast eligibility checks are important for maintaining cash flow in these settings. The healthcare reimbursement market supports these functions through billing, payment posting, and denial-management tools.
Diagnostic laboratories are forecast to grow at an 8.43% CAGR through 2031. More outpatient testing and specialty treatment monitoring increase the number of laboratory claims requiring correct documentation. Complex test panels can create additional coding and coverage checks. Hospitals remain an important source of reimbursement volume, although rising operating expenses increase their focus on claim recovery. The American Hospital Association reported 7.5% hospital expense growth in 2025. Other providers, including ambulatory surgery centers, home health agencies, and virtual care platforms, add further variation to reimbursement processes.
Geography Analysis
North America held 42.54% of the healthcare reimbursement market share in 2025. The region has a large multi-payer system, high service utilization, and detailed payment rules. U.S. providers must work with federal programs, state requirements, and commercial insurer policies. CMS continues to update provider payment rules and accountable care participation structures in 2026. Hospital cost pressures also reinforce demand for payment recovery tools. The American Hospital Association reported USD 43 billion in collection costs for insurer payments in 2025.
Europe remains an important healthcare reimbursement market because national systems are updating hospital payment and digital health pathways. Public payer systems shape provider reimbursement rules across the region. The need to connect clinical documentation with payment requirements remains central as reimbursement categories change. CMS payment developments in the United States also illustrate the wider shift toward different payment methods for qualifying value-based participants. European providers face similar needs for accurate billing and consistent evidence for reimbursable services. These requirements support the adoption of payment administration tools.
Asia-Pacific is forecast to grow at a 6.43% CAGR through 2031. The region combines expanding insurance participation with a growing need for claims administration capacity. China and India are important volume markets because of their large populations and broader access to health services. New employer and public coverage arrangements increase the need for eligibility and claims processes. The Middle East and Africa and South America are earlier-stage markets with growing insurance and provider infrastructure. The healthcare reimbursement market has an opening in these regions where payment platforms can be established as coverage programs develop.

Competitive Landscape
The healthcare reimbursement market comprises large health insurers and specialized revenue cycle management providers. Key payer participants include UnitedHealth Group, Elevance Health, CVS Health, and Humana. Dedicated payment and revenue cycle management vendors include Waystar, Optum, R1 RCM, Zelis, FinThrive, and Experian Health. Competition centers on claims processing, payment accuracy, prior authorization, and denial management. Larger organizations leverage extensive payment datasets to develop and deploy workflow tools, while independent vendors differentiate through specialized capabilities and strong provider service relationships.
UnitedHealth Group plans to expand the use of artificial intelligence across its operations in 2026. Its Optum business demonstrates how integrated payers can leverage internal claims and care operations capabilities to serve broader provider requirements. UnitedHealthcare also plans to eliminate prior authorization requirements for 1,700 medical codes in 2026. Zelis plans to acquire Rivet in January 2026, adding revenue cycle analytics and claims dashboards to its payments platform. These initiatives underscore the industry’s focus on reducing rework and improving visibility across payment operations.
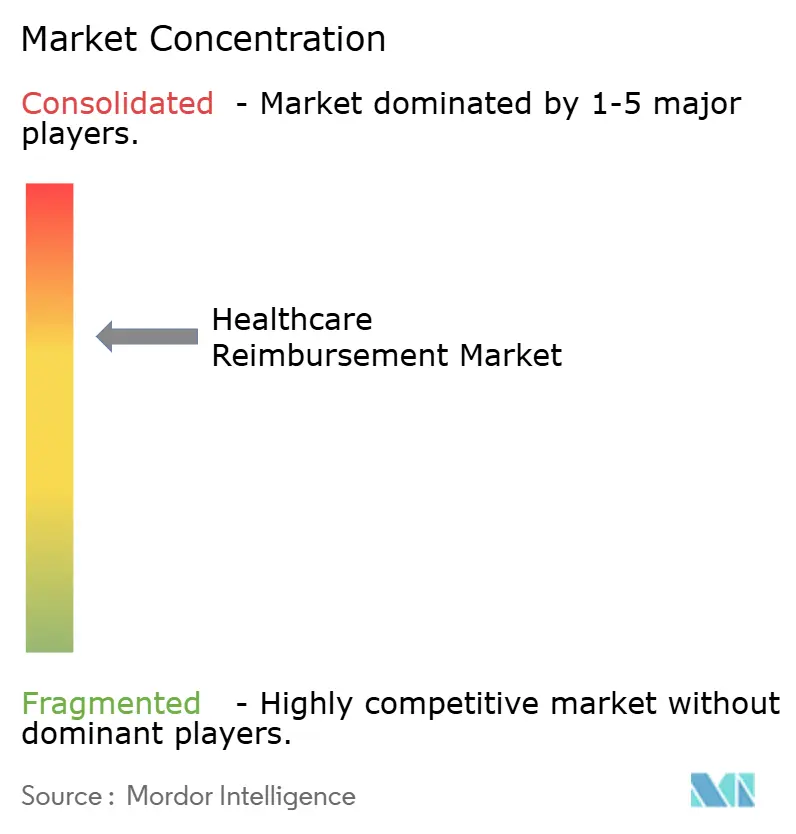
R1 RCM plans to acquire Humata Health in August 2026 to incorporate prior authorization automation into its Phare OS platform. IKS Health plans to complete its acquisition of TruBridge in July 2026, strengthening its support for rural and community hospitals. These transactions reflect sustained demand for integrated technology and service capabilities. Providers require practical support to manage payment workflows across diverse sites of care. Each vendor’s competitive position depends on its ability to reduce administrative burdens while maintaining compliance. As no combined market share data for the leading players was provided, a concentration score cannot be calculated using the stated methodology.
Healthcare Reimbursement Industry Leaders
UnitedHealth Group Incorporated
CVS Health Corporation
Elevance Health, Inc.
The Cigna Group
Health Care Service Corporation
- *Disclaimer: Major Players sorted in no particular order

Recent Industry Developments
- August 2026: R1 RCM announced the acquisition of Humata Health, an AI-powered, touchless prior-authorization technology company, to integrate Humata's agentic workflows into its Phare OS revenue cycle platform. R1's platform already handles more than 600 million payer transactions annually across 95 of the top 100 U.S. health systems. Humata reports a 96% first-pass authorization approval rate.
- July 2026: IKS Health completed the acquisition of TruBridge, a healthcare technology provider serving more than 1,500 rural and community hospital clients with EHR and revenue cycle management solutions.
- January 2026: Zelis acquired Rivet, integrating its analytics and claims dashboards into the Zelis platform.


Global Healthcare Reimbursement Market Report Scope
According to the report’s scope, healthcare reimbursement refers to the process by which healthcare providers are paid for services rendered, often by insurance companies or government programs. It involves the compensation mechanisms that facilitate payment for medical treatments and procedures.
The healthcare reimbursement market is segmented into claim, payer, service provider, and geography. By claim, the market is segmented into underpaid claims and fully paid claims. By payer, the market is segmented into private payers and public payers. By service provider, the market is segmented into hospitals, physician offices and clinics, diagnostic laboratories, and other service providers. By geography, the market is segmented into North America, Europe, Asia-Pacific, the Middle East and Africa, and South America. The report also covers the estimated market sizes and trends for 17 countries across major regions globally. The report offers values (USD) for all the above segments.
| Underpaid Claims |
| Fully Paid Claims |
| Private Payers |
| Public Payers |
| Hospitals |
| Physician Offices and Clinics |
| Diagnostic Laboratories |
| Other Service Providers |
| North America | United States |
| Canada | |
| Mexico | |
| Europe | Germany |
| United Kingdom | |
| France | |
| Italy | |
| Spain | |
| Rest of Europe | |
| Asia-Pacific | China |
| Japan | |
| India | |
| Australia | |
| South Korea | |
| Rest of Asia-Pacific | |
| Middle East and Africa | GCC |
| South Africa | |
| Rest of Middle East and Africa | |
| South America | Brazil |
| Argentina | |
| Rest of South America |
| By Claim | Underpaid Claims | |
| Fully Paid Claims | ||
| By Payer | Private Payers | |
| Public Payers | ||
| By Service Provider | Hospitals | |
| Physician Offices and Clinics | ||
| Diagnostic Laboratories | ||
| Other Service Providers | ||
| Geography | North America | United States |
| Canada | ||
| Mexico | ||
| Europe | Germany | |
| United Kingdom | ||
| France | ||
| Italy | ||
| Spain | ||
| Rest of Europe | ||
| Asia-Pacific | China | |
| Japan | ||
| India | ||
| Australia | ||
| South Korea | ||
| Rest of Asia-Pacific | ||
| Middle East and Africa | GCC | |
| South Africa | ||
| Rest of Middle East and Africa | ||
| South America | Brazil | |
| Argentina | ||
| Rest of South America | ||


Key Questions Answered in the Report
What is driving growth in healthcare reimbursement?
Growth is supported by rising treatment costs, broader insurance coverage, chronic care demand, and the shift toward value-based payment models.
How large is healthcare reimbursement in 2026?
The healthcare reimbursement market is valued at USD 11.13 Trillion in 2026 and is projected to reach USD 14.77 Tillion by 2031.
Which claim category has the largest share?
Underpaid claims held 80.43% share in 2025, reflecting the need to identify and recover payments that do not match contracted terms.
Which payer category is growing fastest?
Private payers are forecast to grow at a 7.84% CAGR through 2031, supported by commercial and employer-sponsored coverage.
Which provider setting is growing fastest?
Diagnostic laboratories are forecast to grow at an 8.43% CAGR through 2031 as outpatient testing and monitoring needs expand.
Which region is expanding fastest?
Asia-Pacific is forecast to grow at a 6.43% CAGR through 2031 as insurance coverage and claims administration needs increase.
Page last updated on:





