Graphene Market Size and Share
Market Overview
| Study Period | 2021 - 2031 |
|---|---|
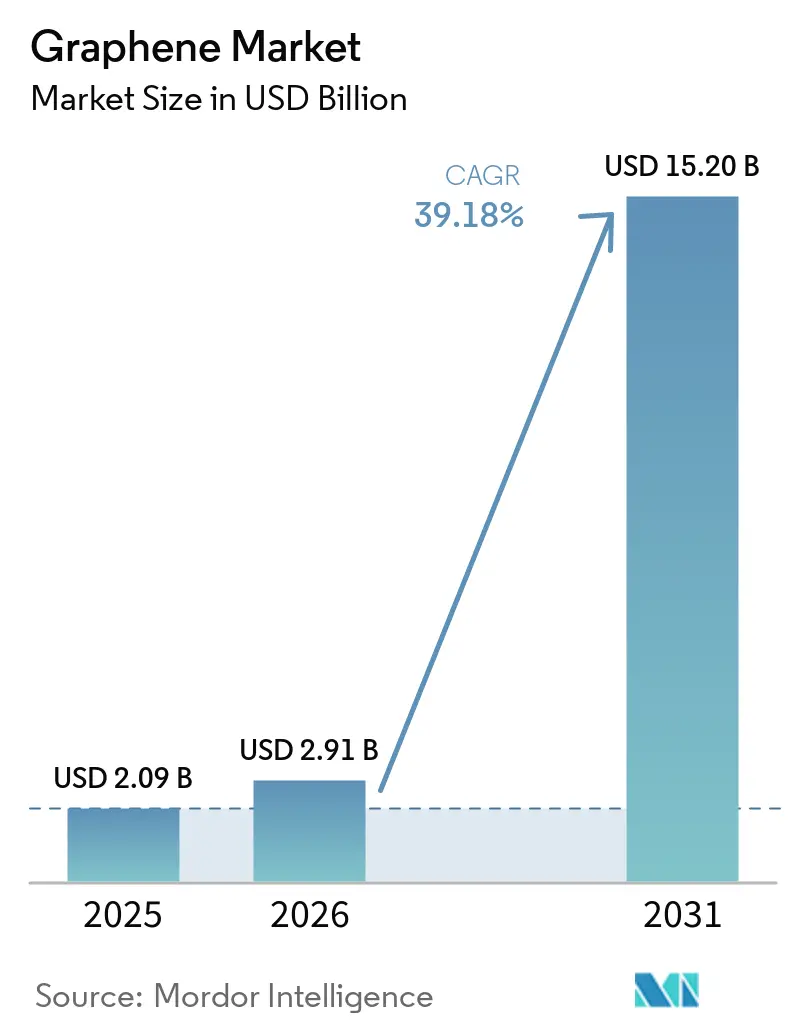
| Market Size (2026) | USD 2.91 Billion |
| Market Size (2031) | USD 15.20 Billion |
| Growth Rate (2026 - 2031) | 39.18% CAGR |
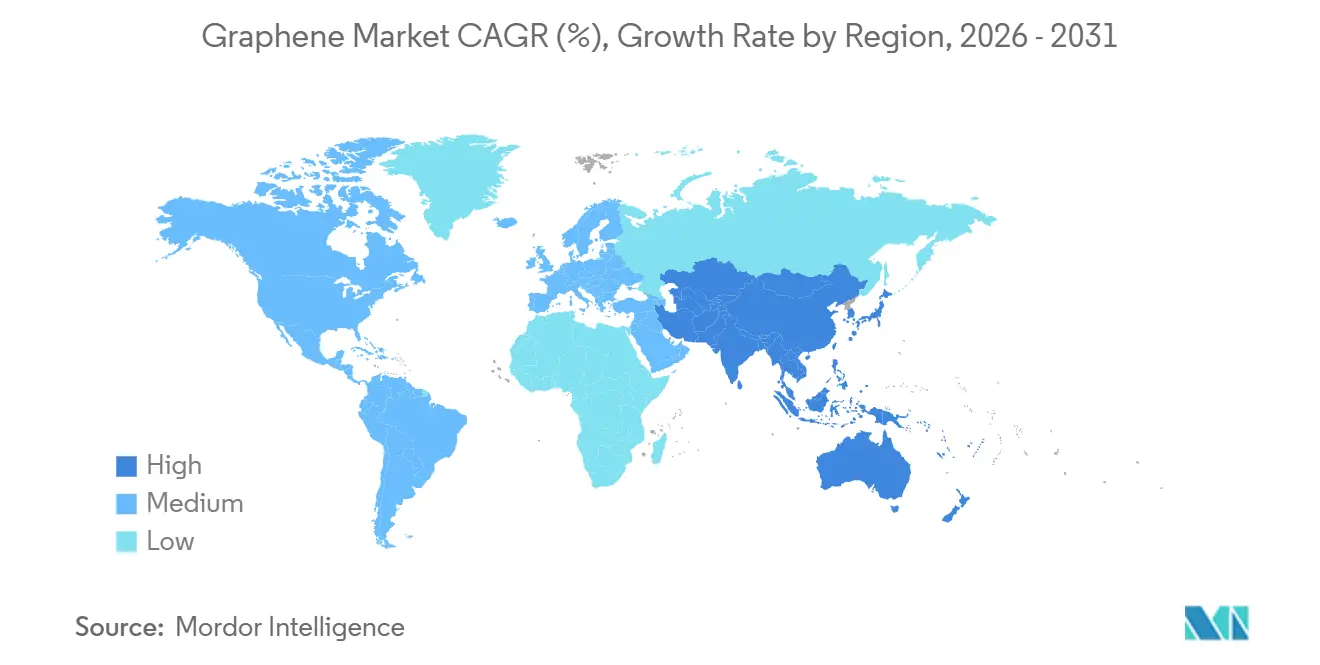
| Fastest Growing Market | Asia Pacific |
| Largest Market | Asia Pacific |
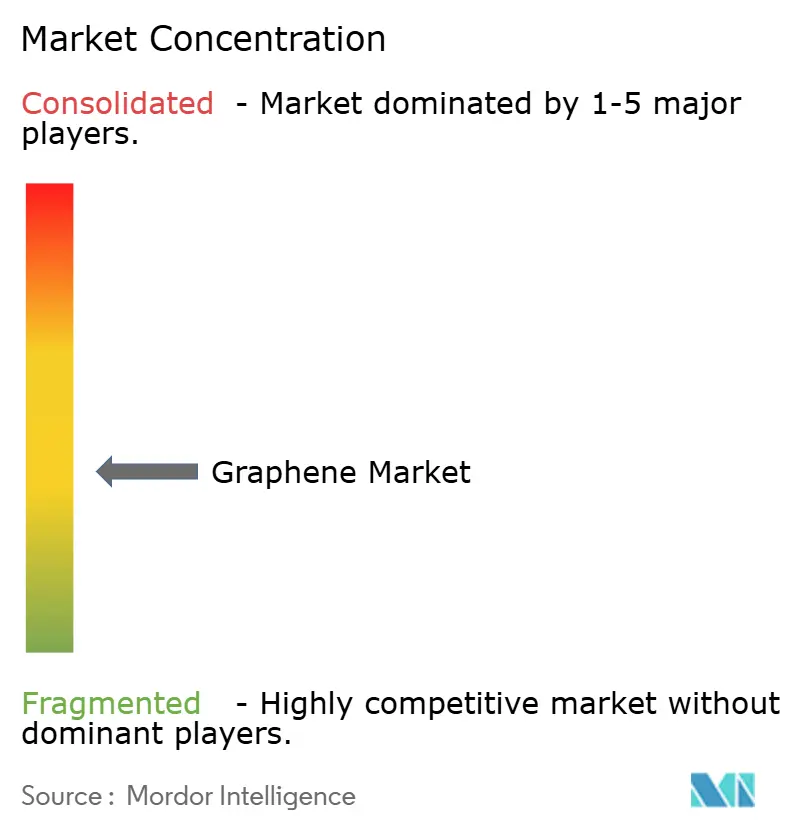
| Market Concentration | Medium |
Major Players *Disclaimer: Major Players sorted in no particular order Image © Mordor Intelligence. Reuse requires attribution under CC BY 4.0. | |
Graphene Market Analysis by Mordor Intelligence
The Graphene Market size was valued at USD 2.09 billion in 2025 and is estimated to grow from USD 2.91 billion in 2026 to reach USD 15.20 billion by 2031, at a CAGR of 39.18% during the forecast period (2026-2031). Demand momentum is strongest where weight, thermal, or electrochemical limits constrain incumbent materials, particularly in aerospace composites, grid-scale batteries, and sub-3 nm semiconductors. Sovereign funding amplifies this pull: the United States earmarked USD 140 million in 2025 for graphene-enhanced anode manufacturing, while the European Commission continues to subsidize pilot lines that compress scale-up risk for small and mid-sized producers. Cost parity against carbon nanotubes remains distant, yet China’s vertically integrated clusters narrow the gap by 40% against Western equivalents, accelerating commoditization in polymer masterbatches and anti-corrosion coatings. Patent filings rose 34% year-over-year in 2025, concentrated in 5G electromagnetic-interference foams and flexible electronics, signaling that intellectual-property intensity rather than raw tonnage will differentiate winners through 2031.
Key Report Takeaways
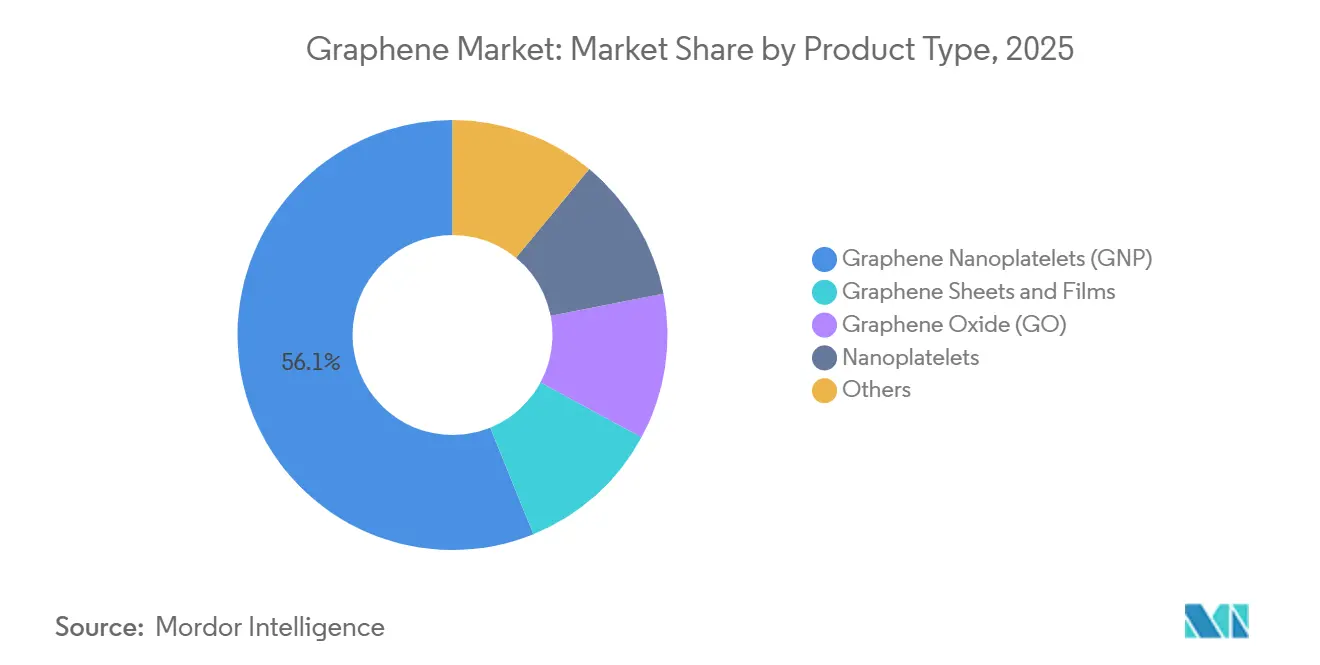
- By product type, graphene nanoplatelets held 56.14% of the graphene market share in 2025; graphene nanoplatelets are projected to expand at a 44.63% CAGR through 2031.
- By application, energy storage and harvesting are forecast to post a 46.20% CAGR to 2031, while composites led with 35.14% of the graphene market size in 2025.
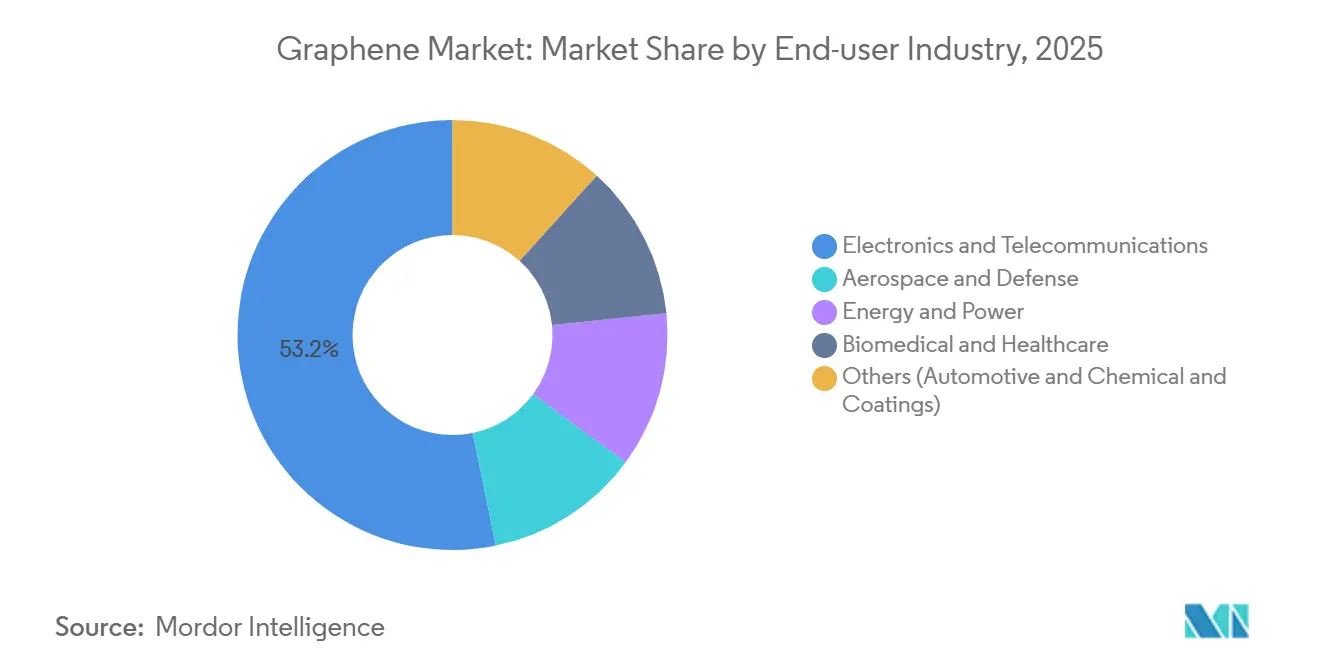
- By end-user industry, electronics and telecommunications commanded 53.21% revenue in 2025; biomedical and healthcare are advancing at a 46.07% CAGR through 2031.
- By geography, Asia-Pacific generated 45.23% of 2025 revenue and is expected to grow at a 45.69% CAGR to 2031, sustaining the largest regional graphene market share.
Note: Market size and forecast figures in this report are generated using Mordor Intelligence’s proprietary estimation framework, updated with the latest available data and insights as of January 2026.
Global Graphene Market Trends and Insights
Driver Impact Analysis*
| Driver | (~) % Impact on CAGR Forecast | Geographic Relevance | Impact Timeline |
|---|---|---|---|
| Aerospace adoption of graphene composites | +6.2% | North America & Europe, emerging in APAC | Medium term (2-4 years) |
| Graphene anti-corrosion coatings in desalination | +4.8% | Middle East, North Africa, APAC coastal regions | Long term (≥ 4 years) |
| Energy-storage retrofits using graphene anodes | +9.1% | Global, highest in APAC and North America | Short term (≤ 2 years) |
| Electronics and semiconductor integration | +10.3% | Taiwan, South Korea, China; spill-over to North America | Short term (≤ 2 years) |
| EMI-shielding foams for 5G infrastructure | +5.4% | China, South Korea, United States | Medium term (2-4 years) |
| Source: Mordor Intelligence | |||


Increasing Usage of Graphene in the Aerospace Industry
Aircraft OEMs embed graphene nanoplatelets into carbon-fiber prepregs to secure 15-20% structural weight reductions, a threshold needed to reach 25% fuel-burn improvements over legacy wide-body fleets[1]Boeing, “777X Material Specifications,” boeing.com. Boeing’s 2025 supplier documents mandate graphene composites in the 777X secondary structures, citing lightning-strike dissipation that exceeds aluminum honeycomb by 40%. Airbus is piloting graphene oxide surface coatings on A350 control panels to curb galvanic corrosion in humid coastal climates, a persistent maintenance driver for long-haul operators. Defense contracts reinforce the trend: the US Air Force Research Laboratory awarded USD 18 million in 2025 to develop radar-absorbing graphene laminates that lower X-band signatures on sixth-generation fighter prototypes. Qualification cycles, however, average 18-24 months under AS9100 protocols, delaying revenue recognition for smaller suppliers and sustaining premium pricing.
Expansion of Energy-Storage Applications Utilizing Graphene
Utilities are retrofitting lithium-ion arrays installed between 2018 and 2022 with graphene-enhanced anodes that raise charge acceptance by 35%, enabling lucrative frequency-regulation services in deregulated power pools. A USD 42 million supply deal inked by NanoXplore in March 2025 covers 500 MWh of such upgrades across five US states, the largest commercial deployment to date. Smartphone vendors pursue parallel gains: graphene supercapacitors paired with 100-watt chargers eliminate thermal-runaway risks at room temperature, a feature Samsung plans to commercialize in 2026 flagships. Longer-term research from the DOE’s Battery500 Consortium targets 500 Wh/kg cells, double present benchmarks, positioning graphene as a vital bridge to post-lithium chemistries.
Growing Demand in Electronics and Semiconductors
Semiconductor road maps below 3 nm rely on graphene interconnects and heat spreaders to offset resistivity and thermal bottlenecks that copper and polymer interfaces can no longer manage. TSMC’s 2025 test chips logged an 18% signal-delay cut and 12°C junction-temperature drop using graphene lines, extending device reliability while preserving clock headroom. Intel is validating graphene thermal materials for chiplet packaging, where polymer pads induce hotspots that throttle compute density. In displays, LG Display committed USD 200 million to scale graphene transparent conductors for foldable OLEDs, projecting 30% cost savings versus indium tin oxide by 2027. As heterogeneous integration and 3D stacking mature, graphene’s single-atom profile offers an electromigration-free pathway that aligns with Moore’s-Law-plus ambitions.
Commercialisation of Graphene EMI-Shielding Foams for 5G Infrastructure
Millimeter-wave 5G base stations (24-39 GHz) demand light yet effective shielding; graphene foams deliver 60-80 dB attenuation at a tenth the weight of aluminum enclosures. Ericsson embedded such foams in 2025 Massive-MIMO arrays, cutting tower loads by 25% and reducing site-prep costs. China Mobile deployed over 100,000 graphene-shielded small cells in Shanghai and Shenzhen in 2025, the largest urban densification worldwide. IEC-61000-4-3 compliance requires no extra testing, accelerating time-to-market, but accelerated aging studies show 15% shielding fade after 5,000 hours of simulated sunlight, raising warranty concerns over 10-year service lifetimes.
Restraints Impact Analysis*
| Restraint | (~) % Impact on CAGR Forecast | Geographic Relevance | Impact Timeline |
|---|---|---|---|
| High production cost | -8.7% | Global, most acute in North America & Europe | Short term (≤ 2 years) |
| Availability of substitutes | -3.2% | Global, material preference varies regionally | Medium term (2-4 years) |
| Nanotoxicology and regulatory uncertainty | -5.1% | North America & Europe, emerging in APAC | Long term (≥ 4 years) |
| Source: Mordor Intelligence | |||
High Production Cost
Chemical-vapor-deposition sheets command USD 200-500 /kg, compared with USD 10-20 for carbon nanotubes and USD 2-5 for carbon black, keeping many high-volume uses financially out of reach[2]Nature Materials, “Economic Assessment of Graphene Production Routes,” nature.com. Liquid-phase exfoliation, the workhorse process for nanoplatelets, consumes 40-60 kWh/kg in solvent recovery alone, adding USD 80-120 in energy overheads at industrial tariffs. First Graphene’s 2025 results revealed average 38% gross margins versus 55-65% for specialty chemicals, constraining reinvestment in capacity. Scaling offers partial relief—doubling throughput shaves merely 12-15% off cost per kilogram—far below learning-curve precedents set by lithium-ion or photovoltaics. Equipment suppliers, facing uncertain demand visibility, maintain 18-24 month lead times on reactors exceeding 500 tpa, delaying supply-side elasticity.
Availability of Substitutes
Advanced polymers, carbon nanotubes, and boron nitride nanosheets satisfy many conductivity and mechanical benchmarks at lower price points, diluting graphene’s immediate appeal in commodity segments. Automotive tire producers, for example, continue to lean on silica-silane coupling agents to curb rolling resistance, limiting graphene uptake until co-developed carbon-black hybrids prove scalable. In thermal interfaces, graphite foils still dominate electric-vehicle power electronics due to mature supply chains, despite inferior long-term cycling stability. As long as price gaps endure, end users will weigh graphene’s incremental performance against well-known processing costs.
*Our forecasts treat driver/restraint impacts as directional, not additive. The impact forecasts reflect baseline growth, mix effects, and variable interactions.
Segment Analysis
By Product Type: Graphene Nanoplatelets (GNP) Dominate on Processing Compatibility
Graphene Nanoplatelets (GNP) captured 56.14% of 2025 revenue, reflecting their seamless integration into twin-screw extruders and three-roll mills long familiar to polymer compounders. This dominance anchors the graphene market size at the product level, with forecast penetration expanding at a 44.63% CAGR to 2031 as unit pricing slides below USD 80/kg in China. Nanoplatelets dispersed at 1-3 wt% lift tensile modulus by up to 300%, enabling automakers to shave 12-15% off underbody shield mass while meeting 2027 crash standards. Sixth Element (Changzhou) booked USD 85 million in nanoplatelet sales in 2025, up 62% year-over-year, underscoring China’s cost leverage in the graphene market. Functionalized derivatives extend utility: carboxylated variants launched by Perpetuus strengthen epoxies by 35%, reducing delamination in aerospace honeycomb cores.
Films and sheets remain a premium niche, priced at USD 800-1,200/m², yet their optical clarity (98%) and conductivity (more than 10^6 S/m) attract foldable display OEMs. LG Display expects to convert 100,000 m² per year by 2027, adequate for 50 million 7-inch screens, positioning transparent conductors as a 10-figure sub-segment of the graphene market. Oxide flakes, though holding a smaller slice, anchor biomedical innovations where covalent bonding with antibodies underpins femtomolar biosensor sensitivity. Quantum dots and aerogels linger in R&D, but grant funding focuses on photocatalytic hydrogen production and gigahertz-wave absorption, hedging against future value-pool shifts.


By Application: Energy Storage Surges as Grid Retrofits Accelerate
Composites generated 35.14% of application revenue in 2025, reflecting mature adoption in sporting goods, automotive interiors, and aerospace skins. Yet energy storage and harvesting are the fastest-growing verticals, advancing at a 46.20% CAGR that will elevate their graphene market share by 2031. Graphene-enhanced anodes increase charge acceptance by 30-40%, enabling 15-minute fast charging without dendritic failure, an imperative for electric-vehicle architectures aiming at 1,000 km range. Tesla’s 2025 supplier forum showcased 4680 cells projected to survive 2,000 cycles when dosed with graphene additives, up from 1,500 for baseline chemistries. Supercapacitors employing graphene aerogels deliver 150 Wh/kg at sub-second discharge, bridging the power-energy gap for regenerative braking and grid frequency response.
Printed and flexible electronics expansion is being propelled by graphene inks that replace silver in RFID antennas at one-third cost while doubling 12-meter read ranges. Biomedical deployments, although smaller, draw premium valuations: Graphenea’s USD 25 million Series C in August 2025 funds point-of-care cancer-biomarker sensors that detect femtomolar DNA concentrations. Coatings and paints, led by desalination anti-corrosion layers, leverage graphene’s chloride impermeability; Ras Al-Khair pilot lines reported 70% corrosion-rate drops after 24 months, persuading Saudi authorities to retrofit four more plants.
By End-user Industry: Biomedical Outpaces Electronics in Growth Rate
Electronics and telecommunications accounted for 53.21% of 2025 revenue, anchored by semiconductor heat spreaders and 5G EMI foams. Adoption will persist as 2 nm nodes reach volume production, but biomedical and healthcare will post the highest CAGR at 46.07%, reflecting regulatory tailwinds for non-invasive diagnostics. Graphene oxide biosensors reach detection thresholds unachievable with conventional electrochemical platforms, enabling earlier cancer intervention and chronic-disease monitoring. Siemens Healthineers pilots graphene glucose monitors, eschewing finger-prick calibration, targeting a global diabetic population exceeding 537 million adults.
Aerospace and defense, while smaller, command the highest average selling price at USD 1,800/kg for AS9100-certified nanoplatelets, thanks to 18-24 month qualification hurdles that entrench supplier niches. Energy and power accelerate on the back of grid battery retrofits and EV battery life-extension contracts, such as NanoXplore’s North American deal covering 500 MWh across 12 sites. Automotive composites and catalytic substrates round out the segment mix, advancing at 37% CAGR as OEMs pursue simultaneous mass reduction and emissions compliance under 2027 regulations.
Geography Analysis
Asia-Pacific anchored 45.23% of 2025 revenue and is on track for a 45.69% CAGR through 2031, ensuring it remains the largest regional node of the graphene market. China’s cradle-to-gate integration, from natural-graphite mining in Heilongjiang to 3,000 tpa nanoplatelet dispersion in Changzhou, cuts delivered cost to USD 60-80/kg, half European averages, catalyzing commoditization in polymer compounding and battery additives. Taiwan’s TSMC validated graphene interconnects that lower signal delay by 18% in 2 nm test wafers, demonstrating semiconductor pull that anchors regional investment. India earmarked INR 500 crore (USD 60 million) in 2025 for a National Graphene Mission focused on water purification membranes, illustrating policy alignment with climate-adaptation infrastructure.
North America’s revenue is buoyed by DOE-funded anode lines and aerospace composite demand. The Bipartisan Infrastructure Law assigns USD 140 million to graphene-enhanced lithium-ion manufacturing, creating a protected corridor for domestic cell makers. NanoXplore’s Montreal expansion to 4,000 tpa in Q3 2025 lowers logistics costs within a 500-mile EV-battery supply radius, while Canada’s Strategic Innovation Fund injected CAD 30 million (USD 22 million) into Grafoid’s biomedical-graphene oxide pilot, signaling Ottawa’s tilt toward high-margin healthcare niches. Mexico gains traction as a printed-electronics hub, hosting Vorbeck’s 2 million m² ink plant that services cross-border automotive customers.
Europe’s revenue in 2025 was retained with momentum in aerospace composites and desalination coatings supported by the Graphene Flagship’s EUR 1 billion funding envelope. Versarien’s UK pilot lines, backed by EUR 8 million of Flagship funds, target Airbus A350 control-surface resins to tame galvanic corrosion. Germany’s Fraunhofer Institute co-develops graphene thermal interfaces that promise 20% inverter-junction-temperature cuts in battery electric vehicles, chasing extended drivetrain durability. REACH pre-registration triggered a mid-tier shakeout, prompting 15 exits or consolidations and nudging the regional graphene market size toward higher concentration. South America and the Middle East trail yet signal application-specific interest: Saudi Arabia’s desalination plants logged 70% corrosion reductions using graphene coatings, and Brazil’s Minas Gerais institute pilots graphene-reinforced tailings dams to mitigate collapse risk in mining regions.

Competitive Landscape
The Graphene market is fragmented. Late-stage funding gravitates to capacity expansion that marries cost reduction with functional differentiation. Talga’s EUR 150 million EIB loan finances a 19,500 tpa Swedish anode plant feeding Northvolt, illustrating ESG-aligned capital’s pull toward battery supply chains. First Graphene’s 60% capacity bump in Australia, coupled with automated dispersion that trims labor by 25%, pursues parity with Chinese cost curves. HydroGraph’s Texas detonation-synthesis plant, enabled by a North American industrial-gas partnership, exemplifies feedstock-security plays in an era of onshoring. Collectively, these moves sketch a sector that is simultaneously racing to tonnage and jockeying for IP-driven pricing moats.
Graphene Industry Leaders
First Graphene Ltd
Haydale Graphene Industries plc
NanoXplore Inc.
The Sixth Element (Changzhou) Materials Technology Co.,Ltd
Global Graphene Group
- *Disclaimer: Major Players sorted in no particular order

Recent Industry Developments
- April 2026: CamGraPhIC, an Italian deep-tech company, secured a EUR 211 million (approximately USD 249 million) state aid grant to advance the development and industrialization of graphene-based photonic chips. This funding, approved by the European Commission, is intended to address the "data bottleneck" in AI by utilizing light rather than electrons for data transmission.
- April 2026: Barcelona-based INBRAIN Neuroelectronics completed patient enrollment for the first-in-human study of its graphene-based neural interface, representing a significant milestone in brain-computer interface (BCI) technology. Conducted during neurosurgical procedures for brain tumor resection, the study demonstrated that ultra-thin, flexible graphene electrodes safely captured high-resolution brain signals with significantly higher fidelity compared to traditional metal-based interfaces.


Research Methodology Framework and Report Scope
Market Definitions and Key Coverage
Our study defines the graphene market as the annual revenue generated from the sale of pristine or functionalized single- to few-layer carbon sheets supplied in powder, film, dispersion, or masterbatch form for commercial use across all end-user sectors. Conductive inks, battery anodes, polymer composites, and thermal spreaders made with graphene additives are counted at their material value; downstream device revenues are excluded.
Scope exclusion: Research-grade samples sold in gram quantities for academic labs are outside the baseline.
Segmentation Overview
- By Product Type
- Graphene Sheets and Films
- Graphene Nanoplatelets (GNP)
- Graphene Oxide (GO)
- Nanoplatelets
- Others
- By Application
- Composites
- Energy Storage and Harvesting
- Printed and Flexible Electronics
- Biomedical and Healthcare
- Coatings and Paints
- Others
- By End-user Industry
- Electronics and Telecommunications
- Aerospace and Defense
- Energy and Power
- Biomedical and Healthcare
- Others(automotive, Chemical and Coatings)
- By Geography
- Asia-Pacific
- China
- Japan
- South Korea
- India
- ASEAN Countries
- Rest of Asia-Pacific
- North America
- United States
- Canada
- Mexico
- Europe
- Germany
- United Kingdom
- France
- Italy
- Spain
- NORDIC Countries
- Rest of Europe
- South America
- Brazil
- Argentina
- Colombia
- Rest of South America
- Middle-East and Africa
- Saudi Arabia
- United Arab Emirates
- South Africa
- Egypt
- Rest of Middle-East and Africa
- Asia-Pacific
Detailed Research Methodology and Data Validation
Primary Research
Mordor analysts interview graphene producers, compounders, battery engineers, printed-electronics OEMs, and regional trade groups across Asia-Pacific, North America, and Europe. Dialogues uncover true average selling prices, capacity utilization, nanoflake quality grades, and adoption hurdles that are rarely documented, enabling us to cross-check secondary ratios and refine penetration curves.
Desk Research
We first map the supply pool through open datasets such as UN Comtrade trade codes for HS 382499 and HS 280300, patent families indexed in Questel, production statistics from the World Steel Association (for graphite feedstock clues), and policy trackers from agencies like the US DOE and the EU Graphene Flagship. Cost and capacity signals are verified through company 10-Ks, investor decks, and customs filings, while demand markers come from bodies such as IEA (battery metals outlook) and ACEA (EV build rates). Factiva screens help us trace new line start-ups in Asia. These sources, alongside D&B Hoovers and a few other paid databases, give us the foundational volumes and price corridors; many additional public references complement but are not exhaustively listed here.
Market-Sizing & Forecasting
A top-down construct starts with global graphite output and trade, which is then adjusted for graphene conversion yields and verified against shipment volumes shared confidentially by major producers. Bottom-up spot checks sampled ASP × volume for energy-storage foil, conductive ink, and nanocomposite pellets tighten totals. Key variables include flake thickness distribution, kilogram-per-MWh loading in Li-ion cells, composite resin mix ratios, and quarterly graphene price indices. A multivariate regression on EV battery gigawatt-hour growth, flexible display area additions, and graphene price elasticity produces the 2025-2030 trajectory; scenario analysis layers in technology breakthroughs or cost setbacks. Data gaps in niche uses are bridged by proxy ratios from closest substitute materials.
Data Validation & Update Cycle
Outputs undergo three-step peer review, anomaly checks against independent price trackers and variance thresholds, before senior sign-off. Reports refresh each year, with interim updates triggered by >10% cost moves, capacity announcements, or regulatory shifts; a fresh analyst pass precedes client delivery.
Why Mordor's Graphene Baseline Earns Decision-Maker Trust
Published values often diverge because firms choose different functional forms, price bases, or update cadences.
Key gap drivers include: some publishers rolling up downstream device value, others using static ASPs that ignore the 18% price slide seen in 2024, or applying uniform uptake rates despite regional EV battery gigawatt-hour disparities. Mordor's scope focuses strictly on material revenue, applies dynamic quarterly pricing, and benefits from annual refreshes.
Benchmark comparison
| Market Size | Anonymized source | Primary gap driver |
|---|---|---|
| USD 1.66 B (2025) | Mordor Intelligence | - |
| USD 0.94 B (2025) | Global Consultancy A | Narrow product mix; excludes oxide films |
| USD 1.00 B (2024) | Industry Association B | Uses fixed 2022 prices; no regional weighting |
| USD 0.26 B (2024) | Trade Journal C | Counts only bulk powders; omits dispersion sales |
These comparisons show that when scope, dynamic pricing, and regional demand differences are aligned, Mordor's balanced baseline sits at the midpoint of plausible outcomes, providing a dependable starting point for strategic choices.


Key Questions Answered in the Report
How fast will Asia-Pacific demand for graphene grow to 2031?
How fast will Asia-Pacific demand for graphene grow to 2031?
What is the main bottleneck preventing lower graphene prices?
High energy consumption in liquid-phase exfoliation and limited economies of scale keep production costs USD 200-500/kg for CVD sheets and USD 60-120/kg for nanoplatelets.
Which graphene application shows the highest growth through 2031?
Energy storage and harvesting, propelled by battery retrofits and fast-charge EV cells, is forecast to grow at a 46.20% CAGR.
Why do aerospace customers pay premium prices for graphene?
AS9100 certification cycles span up to two years, restricting qualified supply and enabling prices near USD 1,800/kg for flight-critical nanoplatelets.
What share of capacity do the five largest graphene producers hold?
The combined capacity of the top five producers is below 25%, signaling a fragmented supply base with room for consolidation.
Page last updated on:


