Sugar Confectionery Market Size and Share
Market Overview
| Study Period | 2021 - 2031 |
|---|---|
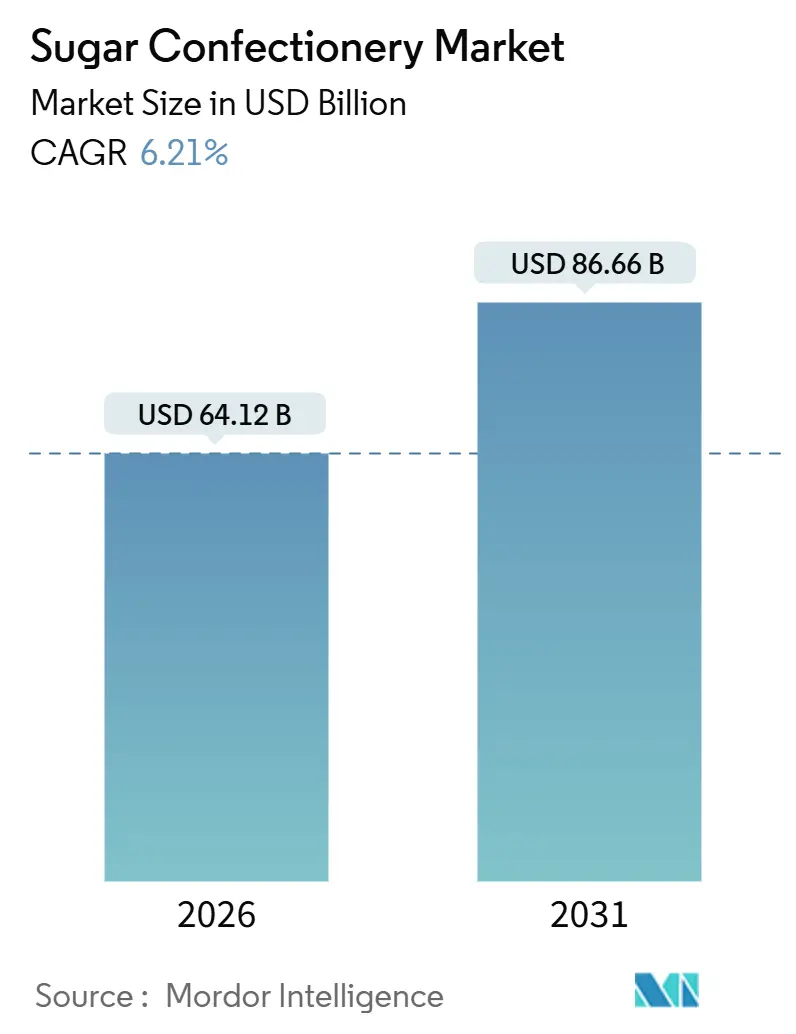
| Market Size (2026) | USD 64.12 Billion |
| Market Size (2031) | USD 86.66 Billion |
| Growth Rate (2026 - 2031) | 6.21% CAGR |
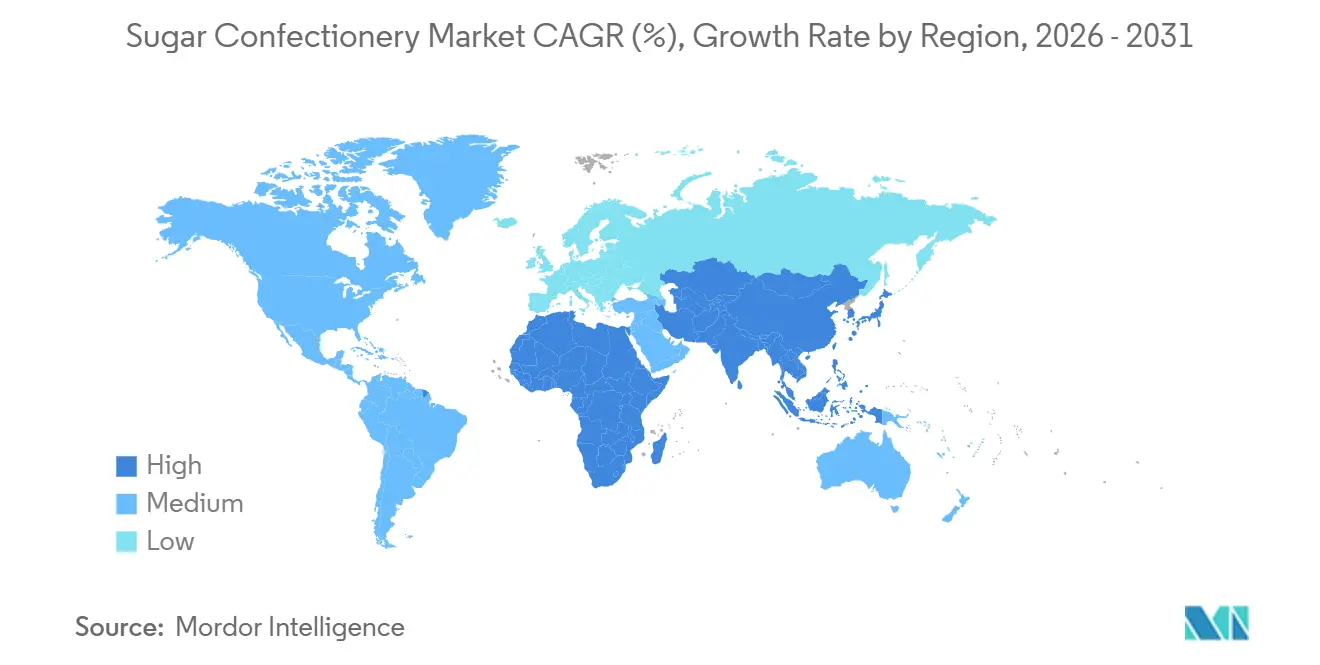
| Fastest Growing Market | Middle East and Africa |
| Largest Market | Asia Pacific |
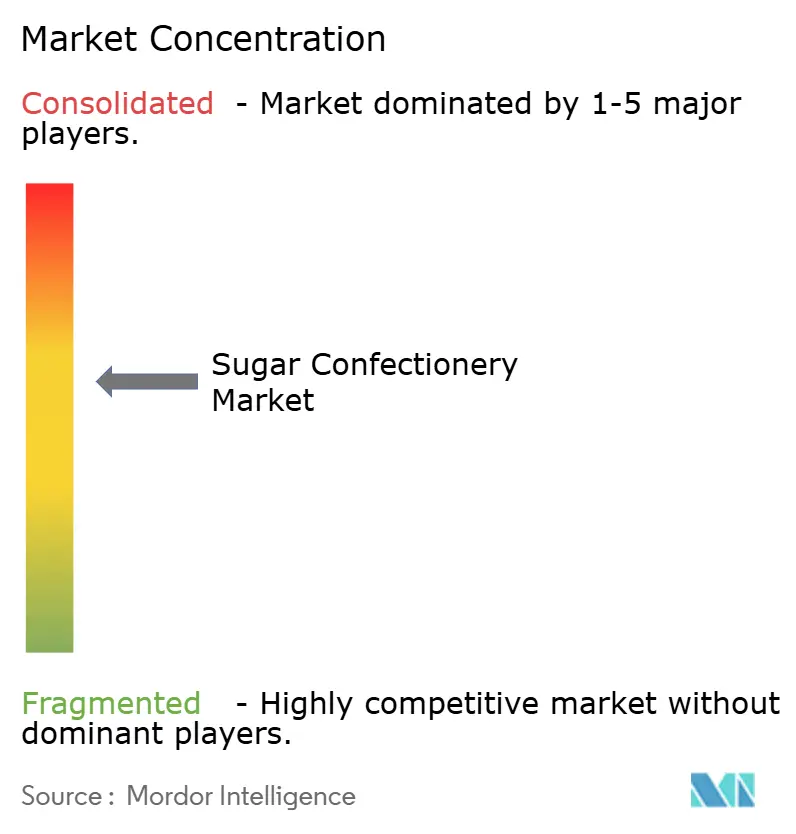
| Market Concentration | Medium |
Major Players
*Disclaimer: Major Players sorted in no particular order Image © Mordor Intelligence. Reuse requires attribution under CC BY 4.0. |
|
Sugar Confectionery Market Analysis by Mordor Intelligence
The sugar confectionery market is projected to reach USD 64.12 billion by 2026 and is expected to grow to USD 86.66 billion by 2031, registering a CAGR of 6.21%. This growth reflects consistent demand for affordable indulgence products that are integral to everyday snacking and celebration-driven consumption. The market is primarily driven by the strong emotional connection consumers have with confectionery products, which provide immediate enjoyment, mood enhancement, and nostalgia, encouraging frequent repeat purchases. Additionally, evolving lifestyles are increasing consumption occasions, including short breaks, commuting, post-meal refreshment, and social sharing. Seasonal demand peaks and gifting traditions further boost market growth, with higher volumes observed during festivals and holidays. Themed and limited-time offerings also play a significant role in maintaining consumer interest throughout the year.
Key Report Takeaways
- By type, pastilles, gummies, and jellies led with a 39.06% sugar confectionery market share in 2025; mints are forecast to expand at a 6.55% CAGR through 2031, outpacing every other segment.
- By functional benefit, novelty products accounted for 51.23% of the sugar confectionery market size in 2025, while fortified confectionery is projected to post the fastest 6.89% CAGR over 2026-2031.
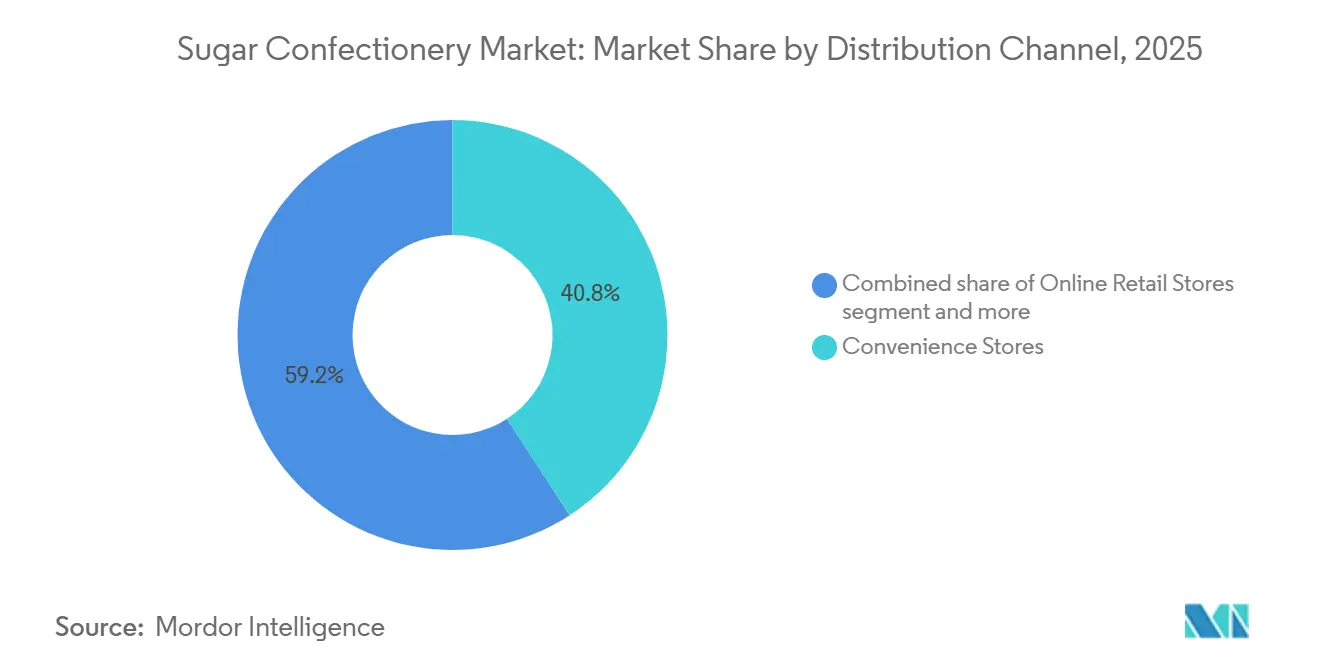
- By distribution channel, convenience stores held 40.81% revenue share of the sugar confectionery market in 2025; online retail is set to rise at an 8.06% CAGR through 2031.
- By geography, Asia-Pacific captured 40.16% of the sugar confectionery market share in 2025, whereas the Middle East and Africa are advancing at a leading 7.11% CAGR to 2031.
Note: Market size and forecast figures in this report are generated using Mordor Intelligence’s proprietary estimation framework, updated with the latest available data and insights as of January 2026.
Global Sugar Confectionery Market Trends and Insights
Drivers Impact Analysis*
| Driver | (~) % Impact on CAGR Forecast | Geographic Relevance | Impact Timeline |
|---|---|---|---|
| Poduct innovation and flavor diversification | +1.2% | Global, with concentration in North America, Europe, and Asia-Pacific urban centers | Medium term (2-4 years) |
| Growing urbanization and on-the-go consumption | +1.4% | Asia-Pacific core, Middle East and Africa emerging markets, South America secondary cities | Long term (≥ 4 years) |
| Expanding gifting culture and seasonal consumption occasions | +0.8% | Global, peak impact in Asia-Pacific (Lunar New Year, Diwali), Europe and North America (Christmas, Valentine's) | Short term (≤ 2 years) |
| Shift toward sustainable and eco-friendly packaging | +0.7% | Europe and North America regulatory-driven, spreading to Asia-Pacific tier-1 cities | Medium term (2-4 years) |
| Strong brand and social media influence | +0.9% | Global, highest engagement in North America Gen Z cohort, Asia-Pacific millennials | Short term (≤ 2 years) |
| Rising demand for premium and artisanal products | +0.6% | North America, Western Europe, Asia-Pacific affluent urban segments | Medium term (2-4 years) |
| Source: Mordor Intelligence | |||
Product innovation and flavor diversification
Product innovation and flavor diversification are significant drivers of the global sugar confectionery market. Brands are increasingly focusing on introducing new taste experiences, unique formats, and novelty-driven launches to sustain consumer engagement and encourage repeat purchases. Confectionery consumption is heavily influenced by impulse buying and emotional indulgence, making frequent innovation essential for maintaining visibility on crowded shelves, refreshing brand relevance, and attracting younger consumers who seek bold flavors and experiential candy formats. Flavor diversification also supports premiumization by making products appear more unique and suitable for gifting, while enabling manufacturers to expand consumption occasions beyond traditional snacking. For example, in July 2025, Neuro Gum launched a Strawberry Cake-flavored mint, showcasing how brands are incorporating indulgent dessert-style flavor concepts with benefit-oriented positioning to stand out in the market. Each mint contains 20 mg of natural caffeine, L-theanine to reduce jitters, and essential B vitamins, illustrating how innovation now extends beyond taste to combine sensory appeal with functional benefits.
Growing urbanization and on-the-go consumption
Urbanization and on-the-go consumption are significant drivers of the sugar confectionery market. Urban lifestyles increasingly prioritize portable, convenient, and instantly consumable products that align with fast-paced routines. In densely populated cities, factors such as frequent commuting, extended working hours, and a greater reliance on convenience-driven shopping contribute to the growing demand for sugar confectionery. These products serve as quick snacks, mood enhancers, or impulse purchases. Additionally, urban retail environments provide greater access to high-traffic purchase points, including convenience stores, transit outlets, and checkout counters, where sugar confectionery benefits from low decision-making time and affordability. For example, data from the National Bureau of Statistics of China indicates that approximately 67.9% of China’s population was urban in 2025, underscoring the impact of urbanization on consumption patterns [1]Source: National Bureau of Statistics of China, "Degree of urbanization in China", stats.gov.cn. As urbanization intensifies, there is a rising demand for confectionery products that are easy to carry, consume discreetly, and purchase quickly during short shopping trips.
Expanding gifting culture and seasonal consumption occasions
The expanding gifting culture and seasonal consumption occasions are driving the sugar confectionery market. Sugar confectionery remains closely associated with celebrations, social sharing, and festive traditions in both developed and emerging regions. Seasonal events such as Christmas, New Year, Easter, Halloween, Valentine’s Day, and local festivals consistently boost sales through increased household stocking, impulse gifting, party consumption, and themed purchases. These occasions prompt consumers to purchase larger pack sizes, assorted bundles, and visually appealing products suitable for sharing or gifting, thereby supporting volume growth and premiumization. For example, in November 2025, Mars introduced a new range of seasonal confectionery for the 2025 holidays. This launch included Life Savers Gummies Holiday Shapes, featuring gummies in seasonal designs such as stockings, snowmen, and Santa hats, demonstrating how themed formats enhance emotional appeal and encourage impulse purchases during gifting seasons.
Shift toward sustainable and eco-friendly packaging
The shift toward sustainable and eco-friendly packaging is a significant driver for the sugar confectionery market, as consumers and retailers increasingly prioritize products that minimize plastic waste and align with environmentally responsible purchasing preferences. Eco-friendly packaging strategies enable confectionery brands to enhance differentiation in a competitive market, improve their premium image, and ensure compliance with evolving global sustainability standards. This trend also fosters innovation in packaging design, promoting lightweighting, improved recyclability, and the use of alternative materials that maintain product protection while reducing environmental impact. For example, in June 2024, Nassau Candy introduced a compostable candy bag made from bio-based material that is 100% home compostable. Such initiatives contribute to market growth by enhancing brand acceptance, strengthening retail partnerships, and advancing the adoption of eco-conscious confectionery products that appeal to environmentally aware consumers.
Restraints Impact Analysis*
| Restraint | (~) % Impact on CAGR Forecast | Geographic Relevance | Impact Timeline |
|---|---|---|---|
| Rising health concerns over high sugar consumption | -1.3% | Global, most acute in Europe (sugar taxes), North America (obesity awareness), spreading to Asia-Pacific | Medium term (2-4 years) |
| Volatility in raw material prices | -0.8% | Global, with acute impact in import-dependent markets (sugar, cocoa, gelatin price swings) | Short term (≤ 2 years) |
| Competition from healthier alternatives and substitutes | -0.7% | North America, Europe, Asia-Pacific urban affluent segments | Long term (≥ 4 years) |
| Strong competitive intensity and brand saturation | -0.5% | Global, most intense in North America and Europe mature markets | Medium term (2-4 years) |
| Source: Mordor Intelligence | |||
Rising health concerns over high sugar consumption
Health concerns related to high sugar consumption continue to be a significant restraint for the sugar confectionery market. Consumers are increasingly aware of the link between excessive sugar intake and health issues such as weight gain, diabetes, and metabolic disorders. This heightened health consciousness is leading to a decline in discretionary candy consumption, particularly among adults who are actively reducing sugar in their daily diets. Furthermore, sugar confectionery is facing growing scrutiny from parents, who are more inclined to limit candy purchases for children and opt for healthier snack alternatives. The shift in consumer preferences is also driven by the rising availability of better-for-you options, which are perceived as healthier and more suitable for regular consumption. As a result, traditional sugar-rich products are experiencing demand challenges in regular consumption scenarios, prompting brands to focus on portion-controlled formats, product reformulation, and functional positioning to remain relevant in the market.
Volatility in raw material prices
Fluctuations in raw material prices pose a significant challenge for the global sugar confectionery market. Manufacturers are particularly exposed to changes in the costs of key inputs such as sugar, glucose-based sweeteners, flavoring systems, and packaging materials. Sudden increases in these costs can severely compress profit margins, especially in a market where products are often priced for impulse purchases and frequent consumption. This restricts the ability of brands to pass on higher costs without risking a decline in sales volume. Price volatility further complicates production planning and procurement strategies, making cost forecasting highly uncertain and reducing flexibility for promotional activities. Over time, prolonged raw material price instability may lead to pack-size reductions, price increases, or reformulation efforts, potentially impacting consumer perception and weakening demand consistency in mass-market confectionery segments.
*Our forecasts treat driver/restraint impacts as directional, not additive. The impact forecasts reflect baseline growth, mix effects, and variable interactions.
Segment Analysis
By Product Type: Texture Hybrids Drive Mints Acceleration
Pastilles, gummies, and jellies accounted for a 39.06% share of the sugar confectionery market in 2025, driven by their alignment with key consumption behaviors such as repeat snacking, sensory-driven choices, and impulse-led purchases. Gummies and jellies provide an engaging consumption experience through their soft texture, chew satisfaction, and playful formats, making them appealing to a broad demographic, particularly children, teens, and young adults. Their market dominance is further supported by the segment's ability to offer a wide variety of options within the same product type, including fruit-based flavors, sour variants, dual-texture formats, filled centers, and novelty shapes, which encourage frequent trials and repeat purchases.
The mint segment is projected to grow at a 6.55% CAGR from 2026 to 2031, as mints are increasingly positioned as a functional, everyday-use confectionery rather than an occasional indulgence. This positioning enhances their repeat purchase potential compared to traditional sugar candies. Mints are closely associated with breath freshness, confidence, and personal hygiene routines, making them relevant to a diverse consumer base, including working professionals, travelers, students, and socially active individuals. This perception of daily utility supports frequent consumption across various occasions, such as after meals, during commutes, between meetings, and after beverages. As a result, the mint segment benefits from high consumption frequency and strong basket add-on behavior.


By Functional Benefit: Fortified Segment Captures Health-Conscious Premiums
Novelty products accounted for 51.23% of the market share in 2025, sustaining sugar confectionery consumption through active and repeat-driven purchases. These products emphasize fun, surprise, and experience-led snacking rather than focusing solely on taste satisfaction. Novelty candies are designed to offer more than sweetness, incorporating interactive formats, unique shapes, multi-sensory effects, and playful consumption rituals. These features appeal strongly to children, teens, and young adults, while also attracting adults seeking lighthearted or nostalgic treats. This segment dominates the market by consistently converting consumer curiosity into purchases. Shoppers are more likely to make impulse buys when products promise an engaging experience, such as intense sensory effects, color-changing features, or unexpected textures.
Fortified confectionery is projected to grow at a compound annual growth rate (CAGR) of 6.89% during 2026–2031. This growth is driven by the segment's ability to transform sugar confectionery from a purely indulgent purchase into a benefit-oriented, everyday-use product. Fortified confectionery supports market expansion by appealing to consumers seeking treats that align with modern wellness routines, enabling more frequent consumption beyond traditional impulse snacking. Its positioning enhances relevance among adults, working professionals, and routine-based shoppers, allowing sugar confectionery to participate in permissible indulgence behaviors where enjoyment is paired with functional value. As consumer expectations shift toward products offering benefits beyond taste and sweetness, fortified confectionery strengthens category resilience by encouraging repeat purchases and reducing reliance on occasional cravings.
By Distribution Channel: Online Retail Gains Share Through Subscription Models
Convenience stores accounted for a 40.81% market share in 2025, underscoring their significant role as the leading sales channel for sugar confectionery globally. This channel drives the market through high-frequency foot traffic, instant purchase behavior, and strong product visibility. These factors make convenience stores particularly well-suited for sugar confectionery, which is among the most impulse-driven categories in food retail. The portability of sugar confectionery, ease of selection, and minimal decision-making time contribute to higher conversion rates compared to categories requiring planned purchases. Additionally, checkout placements and front-counter merchandising further enhance sales, as shoppers frequently add confectionery items to their baskets as a low-commitment treat while purchasing beverages, ready-to-eat foods, or fuel-related essentials.
Online retail channels are projected to grow at a CAGR of 8.06% from 2026 to 2031, emerging as a key growth driver for the global sugar confectionery market. This growth is fueled by expanded digital accessibility, convenience-driven purchasing, and broader product discovery. E-commerce platforms facilitate consumer purchases through quick reorders, bundled deals, and curated assortments, catering to both everyday snacking and gifting occasions. Online channels also support market expansion by offering a wider range of brands compared to traditional stores, enabling consumers to access international novelty candies, limited editions, and premium formats that may not be available locally. For example, according to the International Telecommunication Union (ITU), 6 billion people used the Internet in 2025, up from 5.8 billion in 2024 [2]Source: International Telecommunication Union (ITU), "Global number of Internet users increases", itu.int. This increase in internet users expands the potential customer base for online sugar confectionery purchases, driving adoption across both developed and emerging markets.
Geography Analysis
In 2025, Asia-Pacific accounted for 40.16% of the sugar confectionery market share, making it the largest regional contributor. This dominance is supported by a rapidly evolving consumer base and strong everyday consumption habits. The region's growth is primarily driven by China and India, where urban lifestyles and expanding modern retail ecosystems are increasing the frequency of on-the-go snacking and impulse purchases. Urbanization is influencing shopping behavior through greater exposure to convenience stores, supermarkets, and quick-commerce platforms. This trend is boosting demand for portable formats such as gummies, jellies, and novelty candies that cater to busy routines and family consumption occasions. Additionally, rising youth-driven demand for bold flavors, interactive formats, and seasonal novelty packs is reinforcing the region's leadership, driving product rotation and supporting both volume growth and new product adoption in metropolitan and semi-urban markets.
The Middle East and Africa are projected to grow at a 7.11% CAGR during 2026–2031, supported by strong cultural consumption patterns and the region's gifting traditions, where confectionery plays a central role in hospitality and celebrations. Rising tourism activity is further boosting sugar confectionery demand, particularly through travel hubs, convenience retail, and souvenir-driven purchases, with a focus on premium and gift-friendly formats. For example, according to UN Tourism, the Middle East recorded 3% growth in 2025, which increased footfall and retail activity, lifting confectionery sales across airports, entertainment zones, and urban shopping centers [3]Source: UN Tourism, "International Tourist Arrivals Up 4% In 2025", untourism.int. With gifting-led demand, expanding modern trade, and tourism-linked impulse buying, the region is positioned as one of the fastest-growing markets for sugar confectionery.
Europe and North America represent mature markets where volume growth has largely plateaued. As a result, growth strategies in these regions are centered on premiumization, innovation, and portfolio diversification to sustain revenue. Manufacturers are focusing on differentiated novelty formats, sugar-reduced options, and premium giftable assortments to maintain consumer interest. Seasonal demand peaks and brand-led experiences are also being leveraged to drive value growth in these markets. South America exhibits heterogeneous growth, influenced by uneven retail development and varying consumer preferences across countries. Traditional sugar confectionery remains resilient in some markets, while modern formats and premium products are experiencing faster growth in urban centers. This diversity in consumer behavior and retail infrastructure shapes the region's growth trajectory.

Competitive Landscape
The global sugar confectionery market demonstrates moderate consolidation, driven by the strong presence of multinational brand owners alongside a broad base of regional manufacturers and private-label competitors. Key players in the market include Mars, Incorporated, Mondelēz International, Inc., Nestlé S.A., Ferrero International SpA, and The Hershey Company. These companies leverage advantages in brand equity, global distribution networks, and impactful marketing strategies across core confectionery categories. Competition remains intense in impulse-driven segments such as gummies, jellies, mints, and novelty candy, where factors like shelf visibility, product innovation, and seasonal promotions significantly influence market share. While global leaders dominate premium, gifting, and mass-volume segments, regional players maintain relevance by offering localized taste profiles, culturally tailored formats, and quicker responses to country-specific preferences.
Technology adoption is becoming a critical differentiator in the sugar confectionery market. Leading companies are utilizing AI-driven demand forecasting, dynamic pricing algorithms, and machine learning-powered recipe optimization to accelerate innovation cycles and minimize operational inefficiencies. These technologies enhance production planning, reduce inventory waste, and enable brands to respond more effectively to changes in flavor trends, packaging preferences, and channel-specific demand patterns. This is particularly important in convenience retail and e-commerce, where purchasing behavior is rapid and unpredictable. Additionally, digital capabilities are bolstering competitive advantage through data-driven product launches, targeted promotions, and improved personalization on online retail platforms.
Significant growth opportunities exist in next-generation confectionery formats, particularly in functional fortified products, digestive-positioned candies, and plant-based gummies developed using vegan-friendly formulations. Sustainable packaging innovations are also gaining importance as brands face increasing scrutiny over single-use wrappers and non-recyclable materials. This has prompted manufacturers to focus on improving recyclability, reducing material usage, and introducing premium packaging options for gifting occasions. Moving forward, companies that successfully integrate strong branding with rapid innovation, health-focused product positioning, and sustainability initiatives will be well-positioned to capture incremental growth, especially in high-growth regions and digitally driven purchasing environments.
Sugar Confectionery Industry Leaders
-
Mars, Incorporated
-
Mondelēz International, Inc.
-
Nestlé S.A.
-
Ferrero International SpA
-
The Hershey Company
- *Disclaimer: Major Players sorted in no particular order

Recent Industry Developments
- November 2025: Haribo launched limited-edition heart-shaped gummies by partnering with Korean pop star Jennie. The limited-edition line of sweet-and-sour strawberry heart-shaped gummies was available in 8 oz bags.
- June 2025: Perfetti Van Melle India had launched Alpenliebe Eclairs Pop, marketed as India’s first lollipop featuring a liquid chocolate filling. This product combined a caramel outer layer with a liquid chocolate center.
- May 2025: Mars Wrigley India had launched Boomer Lollipop, a flavor-filled confectionery that was available in three vibrant variants: Strawberry, Orange, and Watermelon.
- May 2025: Tic Tac further strengthened its product portfolio in the Israeli market by introducing Raspberry & Lemon and Spearmint Fresh & Mild variants, which showcased a larger, sugar-free mint.


Global Sugar Confectionery Market Report Scope
Sugar confectionery is any food ready for consumption without further preparation. Containing carbohydrate-sweetening matter as a distinguishing ingredient, confectionery includes sweetened licorice and chewing gum but excludes cocoa products. The sugar confectionery market is segmented by product type, functional benefit, distribution channel, and geography. Based on product type, the market is segmented into hard candy, mints, pastilles, gummies, and jellies, toffes and nougats, lollipops, and others. Based on functional benefit, the market is segmented into novelty, fortified, digestive/botanicals, and others. Based on distribution channel, the market is segmented into supermarkets/hypermarkets, online retail stores, convenience stores, and other distribution channels. Based on geography, the market is segmented into North America, Europe, Asia-Pacific, South America, and the Middle East and Africa. The report provides market size and forecasts in both value (USD) and volume (tons) for all the mentioned segments.
| Hard Candy | |
| Mints | Power Mints |
| Standard Mints | |
| Pastilles, Gummies, and Jellies | |
| Toffees and Nougats | |
| Lollipops | |
| Others |
| Novelty |
| Fortified |
| Digestive / Botanicals |
| Others |
| Supermarkets/Hypermarkets |
| Online Retail Stores |
| Convenience Stores |
| Other Distribution Channels |
| North America | United States |
| Canada | |
| Mexico | |
| Rest of North America | |
| Europe | Germany |
| United Kingdom | |
| Italy | |
| France | |
| Spain | |
| Netherlands | |
| Poland | |
| Belgium | |
| Sweden | |
| Rest of Europe | |
| Asia-Pacific | China |
| India | |
| Japan | |
| Australia | |
| Indonesia | |
| South Korea | |
| Thailand | |
| Singapore | |
| Rest of Asia-Pacific | |
| South America | Brazil |
| Argentina | |
| Colombia | |
| Chile | |
| Peru | |
| Rest of South America | |
| Middle East and Africa | South Africa |
| Saudi Arabia | |
| United Arab Emirates | |
| Nigeria | |
| Egypt | |
| Morocco | |
| Turkey | |
| Rest of Middle East and Africa |
| By Product Type | Hard Candy | |
| Mints | Power Mints | |
| Standard Mints | ||
| Pastilles, Gummies, and Jellies | ||
| Toffees and Nougats | ||
| Lollipops | ||
| Others | ||
| By Functional Benefit | Novelty | |
| Fortified | ||
| Digestive / Botanicals | ||
| Others | ||
| By Distribution Channel | Supermarkets/Hypermarkets | |
| Online Retail Stores | ||
| Convenience Stores | ||
| Other Distribution Channels | ||
| By Geography | North America | United States |
| Canada | ||
| Mexico | ||
| Rest of North America | ||
| Europe | Germany | |
| United Kingdom | ||
| Italy | ||
| France | ||
| Spain | ||
| Netherlands | ||
| Poland | ||
| Belgium | ||
| Sweden | ||
| Rest of Europe | ||
| Asia-Pacific | China | |
| India | ||
| Japan | ||
| Australia | ||
| Indonesia | ||
| South Korea | ||
| Thailand | ||
| Singapore | ||
| Rest of Asia-Pacific | ||
| South America | Brazil | |
| Argentina | ||
| Colombia | ||
| Chile | ||
| Peru | ||
| Rest of South America | ||
| Middle East and Africa | South Africa | |
| Saudi Arabia | ||
| United Arab Emirates | ||
| Nigeria | ||
| Egypt | ||
| Morocco | ||
| Turkey | ||
| Rest of Middle East and Africa | ||


Market Definition
- Milk and White Chocolate - Milk chocolates is a solid chocolate made with milk (in the form of either milk powder, liquid milk, or condensed milk) and cocoa solids. White chocolate is made from cocoa butter and milk and contains no cocoa solids whatsoever. The scope includes regular chocolates, low-sugar, and sugar-free variants
- Toffees & Nougats - Toffees include hard, chewy, and small or one-bite candies marketed with labels as toffee or toffee-like confectionery. Nougat is a chewy confection with almond, sugar, and egg white as a basic ingredient; and it originated in Europe and Middle East countries.
- Cereals Bars - A snack composed of breakfast cereal that has been compressed into a bar shape and is held together with a form of edible adhesive. The scope includes snack bars made with cereals such as rice, oats, corn, etc. mixed with a binding syrup. These also include products labeled as cereal bars, cereal treat bars, or grain bars.
- Chewing Gum - This is a preparation for chewing, usually made of flavored and sweetened chicle or such substitutes as polyvinyl acetate. The types of chewing gums included in the scope are sugar-chewing gums and sugar-free chewing gums
| Keyword | Definition |
|---|---|
| Dark Chocolate | Dark chocolate is a form of chocolate containing cocoa solids and cocoa butter without the milk. |
| White Chocolate | White chocolate is the type of chocolate containing the highest percentage of milk solids, typically around or over 30 percent. |
| Milk Chocolate | Milk chocolate is made from dark chocolate that has a low cocoa solid content and higher sugar content, plus a milk product. |
| Hard Candy | A candy made of sugar and corn syrup boiled without crystallizing. |
| Toffees | A hard, chewy, often brown sweet that is made from sugar boiled with butter. |
| Nougats | A chewy or brittle candy containing almonds or other nuts and sometimes fruit. |
| Cereal bar | A cereal bar is a bar-shaped food product, made by pressing cereals and usually dried fruit or berries, which are in most cases held together by glucose syrup. |
| Protein bar | Protein bars are nutrition bars that contain a high proportion of protein to carbohydrates/fats. |
| Fruit & Nut bar | These are often based on dates with other dried fruit and nut additions and, in some cases, flavorings. |
| NCA | The National Confectioners Association is an American trade organization that promotes chocolate, candy, gum and mints, and the companies that make these treats. |
| CGMP | Current good manufacturing practices are those conforming to the guidelines recommended by relevant agencies. |
| Unstandardized foods | Unstandardized foods are those that do not have a standard of identity or that deviate from a prescribed standard in any manner. |
| GI | The glycemic index (GI) is a way of ranking carbohydrate-containing foods based on how slowly or quickly they are digested and increase blood glucose levels over a period of time |
| Skimmed milk powder | Skimmed milk powder is obtained by removing water from pasteurized skim milk by spray-drying. |
| Flavanols | Flavanols are a group of compounds found in cocoa, tea, apples, and many other plant-based foods and beverages. |
| WPC | Whey protein concentrate- the substance obtained by the removal of sufficient nonprotein constituents from pasteurized whey so that the finished dry product contains greater than 25% protein. |
| LDL | Low density Lipoprotein- the bad cholesterol |
| HDL | High density Lipoprotein- the good cholesterol |
| BHT | butylated Hydroxytoluene is a lab-made chemical that is added to foods as a preservative. |
| Carrageenan | Carrageenan is an additive used to thicken, emulsify, and preserve foods and drinks. |
| Free form | Not containing certain ingredients, such as gluten, dairy, or sugar. |
| Cocoa butter | It is a fatty substance obtained from cocoa beans, used in the manufacture of confectionery. |
| Pastellies | A type of of Brazilian candy made from sugar, eggs, and milk. |
| Draggees | Small, round candies that are coated with a hard sugar shell |
| CHOPRABISCO | Royal Belgian Association of the chocolate, pralines, biscuit, and confectionery industry- A trade association that represents the Belgian chocolate industry. |
| European Directive 2000/13 | A European Union directive that regulates the labeling of food products |
| Kakao-Verordnung | The German chocolate ordinance, a set of regulations that define what can be labeled as "chocolate" in Germany. |
| FASFC | Federal Agency for the Safety of the Food Chain |
| Pectin | A natural substance that is derived from fruits and vegetables. It is used in confectionery to create a gel-like texture. |
| Invert sugars | A type of sugar that is made up of glucose and fructose. |
| Emulsifier | A substance that helps to mix to liquids that does not mix together. |
| Anthocyanins | A type of flavonoid that is responsible for the red, purple, and blue colors of confectionery. |
| Functional Foods | Foods that have been modified to provide additional health benefits beyond basic nutrition. |
| Kosher certificate | This certification verifies that the ingredients, production process including all machinery, and/or food-service process complies with the standards of Jewish dietary law |
| Chicory root extract | A natural extract from the chicory root that is a good source of fiber, calcium, phosphorous, and folate |
| RDD | Recommended daily dose |
| Gummies | A chewy gelatin-based candy that is often flavored with fruit. |
| Nutraceuticals | Food or dietary supplements that are claimed to have health benefits. |
| Energy bars | Snack bars that are high in carbohydrates and calories are designed to provide energy on the go. |
| BFSO | Belgian Food Safety Organization for the food chain. |


Research Methodology
Mordor Intelligence follows a four-step methodology in all our reports.
- Step-1: Identify Key Variables: In order to build a robust forecasting methodology, the variables and factors identified in Step 1 are tested against available historical market numbers. Through an iterative process, the variables required for market forecast are set, and the model is built on the basis of these variables.
- Step-2: Build a Market Model: Market-size estimations for the forecast years are in nominal terms. Inflation is not a part of the pricing, and the average selling price (ASP) is kept constant throughout the forecast period for each country.
- Step-3: Validate and Finalize: In this important step, all market numbers, variables, and analyst calls are validated through an extensive network of primary research experts from the market studied. The respondents are selected across levels and functions to generate a holistic picture of the market studied.
- Step-4: Research Outputs: Syndicated Reports, Custom Consulting Assignments, Databases & Subscription Platforms


