United Kingdom Confectionery Market Size and Share
Market Overview
| Study Period | 2021 - 2031 |
|---|---|
| Forecast Data Period | 2026 - 2031 |
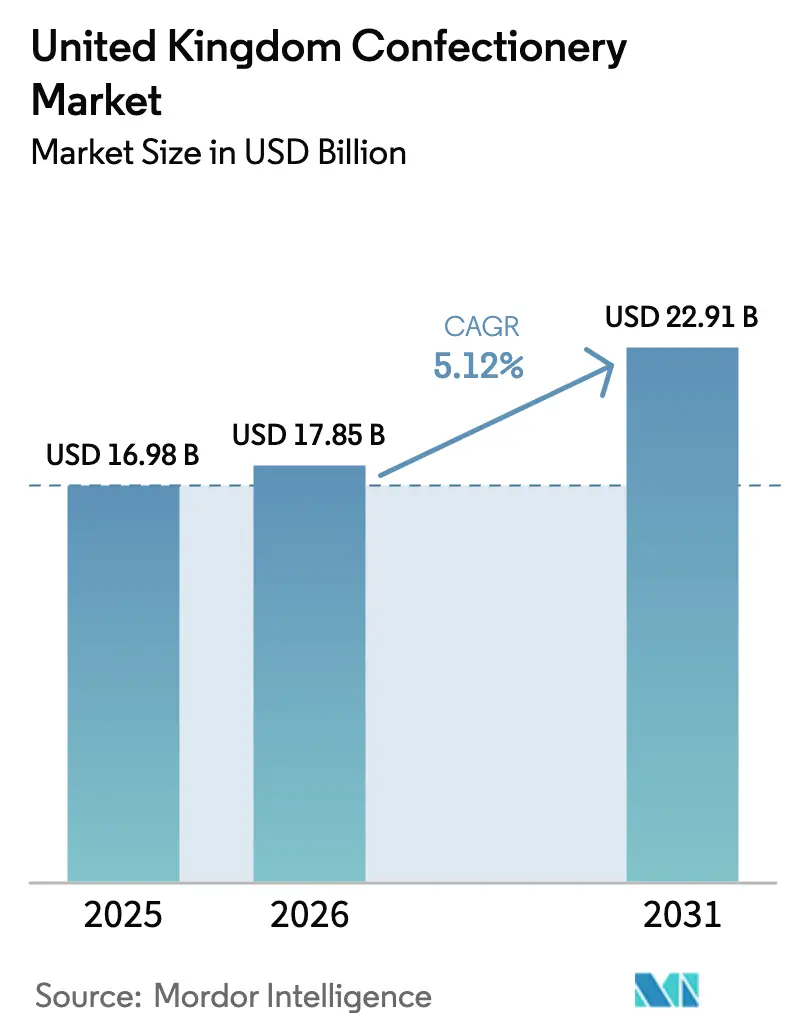
| Base Year Market Size (2025) | USD 16.98 Billion |
| Market Size (2026) | USD 17.85 Billion |
| Market Size (2031) | USD 22.91 Billion |
| Growth Rate (2026 - 2031) | 5.12% CAGR |
| Market Concentration | Medium |
Major Players*Disclaimer: Major Players sorted in no particular order Image © Mordor Intelligence. Reuse requires attribution under CC BY 4.0. | |
United Kingdom Confectionery Market Analysis by Mordor Intelligence
The United Kingdom confectionery market size was valued at USD 16.98 billion in 2025 and estimated to grow from USD 17.85 billion in 2026 to reach USD 22.91 billion by 2031, at a CAGR of 5.12% during the forecast period (2026-2031). This growth is supported by increasing demand for premium products, a shift toward healthier product formulations, and consistent interest in seasonal gifting, despite challenges like rising raw material costs and stricter High in Fat, Salt, or Sugar (HFSS) regulations. The sharp 80% rise in cocoa prices in 2024 impacted profit margins, but manufacturers adapted by reformulating recipes, diversifying supply chains, and carefully managing price increases. Functional sugar confectionery, such as vitamin-enriched or collagen gummies, is becoming popular among health-conscious consumers, driving additional impulse purchases. Online retail, particularly through direct-to-consumer models, is expanding faster than traditional channels, while supermarkets stay competitive by offering click-and-collect services and adjusting aisles to meet HFSS compliance. Competition remains strong, with large multinational companies leveraging their scale and omnichannel strategies, while smaller, agile players focus on opportunities in plant-based, ethical, and personalized products.
Key Report Takeaways
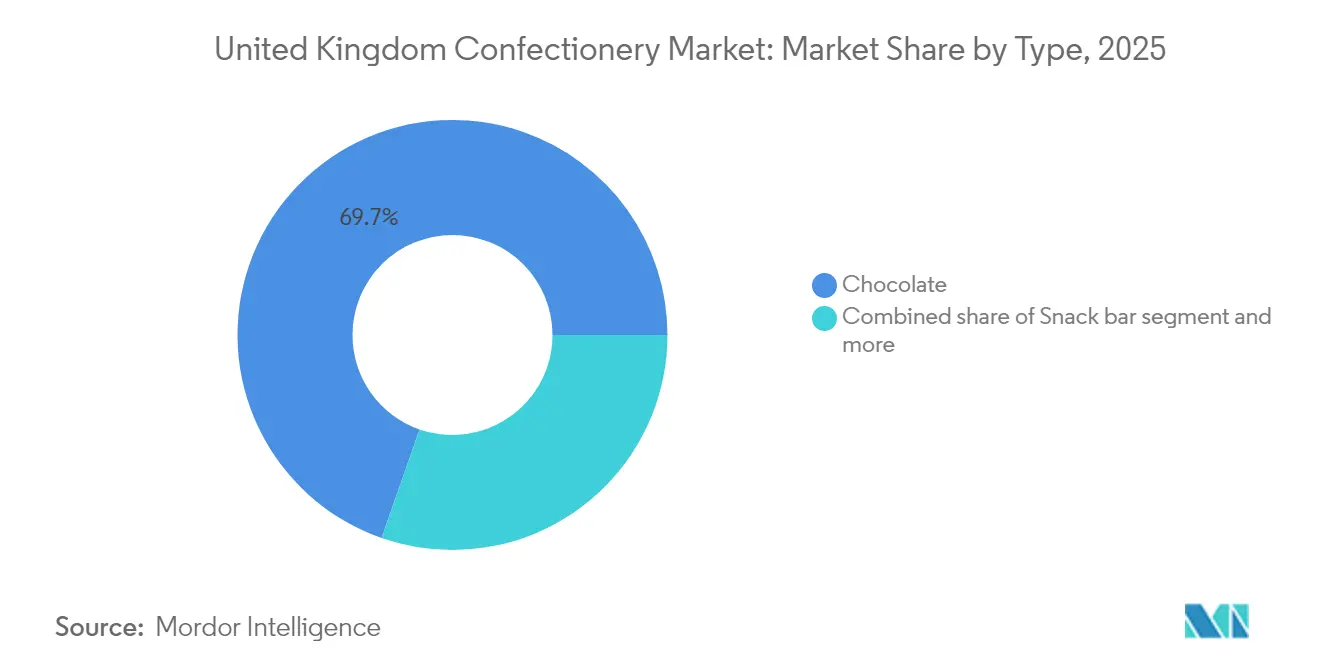
- By type, chocolate led with 69.65% revenue share in 2025 while sugar confectionery is forecast to advance at a 5.62% CAGR to 2031.
- By packaging, single-serve held 67.98% of the United Kingdom confectionery market share in 2025, whereas multipacks record the highest projected CAGR at 5.41% through 2031.
- By price tier, premium products commanded 31.15% share of the United Kingdom confectionery market size in 2025 and are expected to climb at a 5.95% CAGR until 2031.
- By distribution channel, supermarkets/hypermarket retained 44.21% share in 2025, and online retail stores are set to grow 6.08% annually during the forecast period.
Note: Market size and forecast figures in this report are generated using Mordor Intelligence’s proprietary estimation framework, updated with the latest available data and insights as of 2026.
United Kingdom Confectionery Market Trends and Insights
Drivers Impact Analysis*
| Driver | (~)% Impact on CAGR Forecast | Geographic Relevance | Impact Timeline |
|---|---|---|---|
| Premiumization and demand for luxury chocolates and artisanal sweets | +1.2% | National, with concentration in London, Southeast | Medium term (2-4 years) |
| Health-conscious consumer trends | +0.8% | National | Long term (≥ 4 years) |
| Plant-based and vegan options gaining traction | +0.7% | National, urban centers leading | Medium term (2-4 years) |
| Personalized and bespoke confectionery | +0.4% | National, e-commerce driven | Medium term (2-4 years) |
| Gifting culture and holiday promotional campaigns | +0.9% | National | Short term (≤ 2 years) |
| Expansion of e-commerce and online retail platforms | +1.1% | National, accelerating in urban areas | Short term (≤ 2 years) |
| Source: Mordor Intelligence | |||


Premiumization and demand for luxury chocolates and artisanal sweets
Luxury chocolate and artisanal confectionery are gaining a notable share of additional consumer spending, with premium-tier products expected to grow at 6.21% through 2030, compared to 4.93% for mass-market options. This growth reflects consumers' tendency to cut back on everyday grocery expenses while prioritizing indulgent purchases, such as traceable, single-origin cocoa and craft production methods that highlight ethical practices. For instance, Lindt's Excellence range and Hotel Chocolat's experiential retail model, which includes in-store tastings and subscription-based offerings, help build strong customer loyalty and shield pricing from fluctuations in commodity costs. The trend of premiumization is also visible in sugar confectionery, where artisanal gummy brands use functional ingredients like collagen and adaptogens, enabling them to charge 30-50% higher prices than mass-produced alternatives. Retailers are responding by expanding premium product sections and scaling back promotional efforts on luxury stock-keeping units (SKUs) to maintain profit margins.
Health-Conscious Reformulation Accelerates
Reduced-sugar and portion-controlled formats are becoming mainstream, driven by the dual pressures of High Fat, Sugar, and Salt (HFSS) regulations and the increasing global prevalence of obesity. To meet these evolving consumer and regulatory requirements, manufacturers are utilizing alternative sweeteners such as stevia, erythritol, and allulose to reduce sugar content by 20-30% while maintaining desired sweetness levels. However, replicating the taste profile of traditional products remains challenging, particularly in dark chocolate applications. In response to these trends, Nestlé's KitKat range introduced a 30% reduced-sugar variant in 2024, targeting health-conscious millennials. This demographic, representing 40% of confectionery buyers, is increasingly shifting from traditional brands to functional and healthier alternatives. Furthermore, protein-enriched snack bars are leveraging this shift in consumer preferences. In the United Kingdom, the nutritional bar segment, led by brands such as Grenade and Oatein, successfully combines indulgent confectionery flavors with fitness-oriented positioning to meet the growing demand for healthier snacking options. It is estimated that approximately 1 in 4 adults and 1 in 5 children aged 10 to 11 in the United Kingdom are living with obesity [1]Source: National Health Service, “Obesity,” nhs.uk.
Plant-Based Variants Gain Mainstream Traction
The vegan confectionery market has transitioned from a niche segment to a mainstream category, with leading brands launching dairy-free versions of their key products to retain market share amidst rising competition. For example, in March 2024, Cadbury introduced its plant-based Dairy Milk, using almond paste to mimic the creamy texture of traditional milk chocolate. This product targets the 10% of United Kingdom consumers identifying as vegan or flexitarian, highlighting the increasing demand for plant-based alternatives. Similarly, Galaxy and KitKat have released their own vegan options, collectively driving growth in this category. Ferrero's launch of a vegan Kinder product in 2024 further emphasizes the category's growth, marking the shift of plant-based confectionery from a premium niche to a mass-market essential. This trend is influenced not only by ethical considerations but also by regulatory benefits. Plant-based products often fall below High Fat, Sugar, and Salt (HFSS) thresholds due to their reduced saturated fat content, allowing brands greater flexibility in promoting these items. This development is particularly relevant among younger consumers, who prioritize sustainability and environmental responsibility in their purchasing choices. In 2024, United Kingdom consumers purchased an average of 9.1 million plant-based products per week from major supermarkets [2]Source: Good Food Institute, “Plant-based meat and milk are now mainstream choices for British consumers,” gfieurope.org.
Personalization Unlocks Direct-to-Consumer Economics
Bespoke confectionery, which includes custom messages, flavor profiles, and packaging, utilizes digital printing and modular production to achieve premiums of 20-40% over standard stock-keeping units (SKUs). This approach allows brands like Tony's Chocolonely and smaller craft producers to connect directly with their customers, bypassing traditional retail channels. By offering personalized products, these companies not only enhance customer engagement but also gather valuable data that informs product development and reduces reliance on third-party distributors. Corporate gifting has emerged as a particularly lucrative segment within this market, with businesses frequently ordering branded chocolate boxes to strengthen client relationships and recognize employees, especially during the year-end holiday season. Furthermore, the rise of subscription boxes, which deliver curated selections on a monthly basis, has embedded personalization into recurring revenue models. However, challenges such as the complexity of logistics and high customer acquisition costs continue to limit scalability. As digital printing technology becomes more affordable and fulfillment networks become more efficient, personalized confectionery is well-positioned to evolve from a niche offering to a mainstream product category. This trend is especially appealing to millennial and Generation Z consumers, who increasingly value unique and tailored experiences over mass-produced, uniform products.
Restraints Impact Analysis*
| Restraint | (~)% Impact on CAGR Forecast | Geographic Relevance | Impact Timeline |
|---|---|---|---|
| Growing health concerns about sugar, obesity, and dental issues | -0.9% | National | Long term (≥ 4 years) |
| Rising raw material costs | -1.2% | National, global supply chain dependencies | Short term (≤ 2 years) |
| Complexity of regulatory compliance | -0.5% | National, HFSS and labeling frameworks | Medium term (2-4 years) |
| Climate change effects on supply of raw materials | -0.8% | Global, concentrated in West Africa cocoa regions | Long term (≥ 4 years) |
| Source: Mordor Intelligence | |||
Health Concerns Compress Volume Growth
The obesity epidemic in the United Kingdom has led to the implementation of extensive public health initiatives aimed at curbing sugar consumption. Dental health organizations, such as the British Dental Association (BDA), have been particularly vocal in advocating for a reduction in sugary treat consumption, especially among children. This growing awareness is influencing various aspects of daily life: parents are becoming more deliberate in their purchasing decisions, schools are adopting stricter policies to regulate vending machine offerings, and workplaces are introducing wellness programs designed to discourage the consumption of sugary snacks. These combined efforts are fostering a noticeable decline in sugar consumption, particularly among younger age groups. Dental associations have consistently emphasized the strong correlation between frequent sugary treat consumption and the rising prevalence of dental caries, urging for stricter advertising regulations and the inclusion of point-of-sale warnings, similar to those implemented for tobacco products. In response to these pressures, manufacturers are adapting by offering portion-controlled packaging and sugar-free alternatives. However, these reformulated products often face challenges in maintaining the desired taste and texture, which can impact consumer loyalty and repeat purchases. As the market evolves, confectionery products are increasingly competing with healthier snack options, such as nuts, fruit bars, and yogurt. This shift is especially evident among health-conscious millennials and Generation Z (Gen Z) consumers, who are progressively prioritizing functional nutrition and health benefits over indulgent choices.
Raw Material Inflation Squeezes Margins
In 2024, cocoa prices experienced a significant surge, reaching unprecedented levels due to supply disruptions in West Africa and speculative trading activities. This sharp increase in cocoa prices has placed manufacturers in a challenging position, forcing them to either absorb the rising costs or transfer the burden to consumers. Ghana, a major contributor to the global cocoa market, saw its cocoa harvest decline drastically during the 2023-24 season. This drop was driven by a combination of factors, including the spread of swollen shoot disease, the impact of illegal mining activities, and the aging of cocoa trees, which have become less productive over time. At the same time, sugar prices have risen sharply, influenced by unfavorable weather conditions in key producing regions such as Brazil and India. This volatility in sugar prices has further complicated the cost structures for manufacturers of sugar-based confectioneries and gums. Similarly, essential ingredients like milk powder and nuts, which are critical for producing premium chocolates and snack bars, are also facing inflationary pressures. These challenges have collectively led to a noticeable decline in profit margins across the industry. Smaller companies, which often lack the sophisticated hedging mechanisms and diversified supplier networks of larger multinational corporations, are particularly vulnerable. In contrast, industry leaders such as Mondelez, Mars, and Nestlé are better positioned to navigate these challenges. They capitalize on their ability to secure forward contracts and reformulate product recipes, enabling them to optimize costs and maintain a competitive edge.
*Our forecasts treat driver/restraint impacts as directional, not additive. The impact forecasts reflect baseline growth, mix effects, and variable interactions.
Segment Analysis
By Type: Chocolate Dominance Meets Functional Innovation
The sugar confectionery market is projected to grow at a compound annual growth rate (CAGR) of 5.62% through 2031, surpassing the growth of the chocolate market, which is anticipated to hold a significant 69.65% market share in 2025. This growth is largely driven by the increasing demand for functional gummy formats, including collagen-infused, vitamin-enriched, and probiotic variants. These innovative products effectively combine the appeal of confectionery with the benefits of wellness supplements, catering to consumers who are looking for indulgent yet health-conscious options. Additionally, hard candy and mints are gaining traction due to their portion-controlled servings and convenience for on-the-go consumption. Meanwhile, pastilles, gummies, and jellies are leveraging nostalgic flavors and unique textures to create new opportunities for consumption and engagement.
In the chocolate segment, dark chocolate is steadily increasing its market share, supported by exemptions from High Fat, Sugar, and Salt (HFSS) regulations and its perceived health benefits, particularly its antioxidant content. Despite this shift, milk and white chocolate continue to dominate the mass market due to their widespread appeal and familiarity among consumers. Furthermore, snack bars, which are categorized into cereal, energy, protein, and fruit-and-nut variants, are playing a pivotal role in shaping the evolving landscape of the confectionery market by addressing diverse consumer preferences and nutritional needs.


By Packaging Type: Multipacks Gain Share Through Value Perception
Single-serve packaging accounted for 67.98% of 2025 revenue, reflecting its continued dominance in the market. However, multipacks are projected to grow at a rate of 5.41%, as retailers increasingly focus on basket-size economics to drive sales, and consumers prioritize value in response to rising inflation. Multipacks provide a cost advantage, reducing per-unit costs by 15-25% compared to single-serve options. This makes them particularly attractive to families and budget-conscious shoppers who prefer to stock their pantries rather than make frequent impulse purchases. Despite this growth potential, regulations related to High Fat, Sugar, and Salt (HFSS) content restrict volume-based promotions on qualifying products. These restrictions have limited the expansion of multipacks in mass-tier chocolate and sugar confectionery categories, while premium and exempt product categories continue to benefit.
Sustainability considerations are also playing a significant role in reshaping packaging formats. Companies are increasingly adopting innovative solutions to reduce environmental impact. For example, Mondelez's Crunchie multipack trial with Tesco demonstrated a successful approach to sustainable packaging. By eliminating outer plastic wrappers and using recyclable cardboard sleeves, the initiative achieved a 60% reduction in plastic usage. This effort resulted in the deployment of 1.8 million units in 2024, highlighting the growing importance of environmentally friendly practices in meeting consumer expectations and regulatory demands.
By Price Tier: Premium Segment Outpaces Mass Market
Premium confectionery is expected to grow at a rate of 5.95% through 2031, outpacing the mass segment's growth rate of 4.61%, even though it is projected to account for only 31.15% of 2025 revenue. This growth reflects consumers' willingness to spend more on products with traceable cocoa, artisanal production methods, and ethical sourcing practices that align with sustainability values. Brands like Lindt with its Excellence range, Hotel Chocolat with its experiential retail model, and Tony's Chocolonely with its focus on slave-free chocolate exemplify strategies that help maintain pricing stability despite fluctuations in commodity costs and regulatory challenges. Additionally, dark chocolate with cocoa content of 50% or higher benefits from exemptions under High Fat, Sugar, and Salt (HFSS) regulations, allowing unrestricted promotional placement and reinforcing its premium image associated with health and sophistication.
On the other hand, mass-tier products are facing pressure from rising raw material costs, which reduce profit margins, and HFSS restrictions, which limit promotional opportunities and impulse purchases that have traditionally driven sales. To address these challenges, companies like Mondelez and Mars are expanding their mid-tier offerings. These "premium-light" products include features such as single-origin cocoa or reduced sugar content, offering an enhanced experience without the full price tag of ultra-premium brands. This approach aims to attract consumers looking to upgrade from mass-market products while remaining affordable for those unwilling to pay 50-100% more for high-end premium options.

By Distribution Channel: Online Retail Disrupts Traditional Hierarchies
Supermarkets and hypermarkets accounted for 44.21% of sales in 2025. In contrast, online retail stores are projected to grow at a rate of 6.08%, the highest among all distribution channels. This growth is driven by subscription-based models, direct-to-consumer (DTC) brands, and the increasing adoption of online grocery shopping. E-commerce facilitates access to niche products, such as unique flavors, customized packaging, and premium imports, which are often unavailable in physical stores. It also enables dynamic pricing strategies and targeted promotions to enhance customer conversion rates. Platforms like Amazon and Ocado play a crucial role for new and emerging brands by providing fulfillment infrastructure that lowers upfront costs and accelerates market entry. Online retail sales in the United Kingdom increased by 2.0% month-on-month and 3.7% year-on-year in July 2025, accounting for 27.8% of total retail sales during that period .
Convenience stores benefit from their accessibility and ability to cater to impulse purchases and on-the-go consumption needs. However, their product range is often limited due to restricted shelf space and higher logistics costs per unit. Other distribution channels, such as specialty retailers, vending machines, and foodservice outlets, collectively account for approximately 10-15% of sales. These channels thrive on niche offerings and experiential retail formats. For example, Hotel Chocolat's cafes combine product sales with immersive brand experiences, creating a unique value proposition for customers.
Geography Analysis
The United Kingdom confectionery market shows distinct regional differences in consumer preferences. London and the Southeast contribute significantly to premium and plant-based confectionery sales, driven by higher disposable incomes and greater awareness of health and wellness trends. On the other hand, Scotland and Northern Ireland lean towards traditional chocolate and sugar confectionery, supported by heritage brands and seasonal gifting occasions that emphasize nostalgia and family-oriented consumption.
Urban areas are at the forefront of e-commerce growth, with online retail accounting for approximately 12-15% of confectionery sales in metropolitan regions, compared to 7-8% in rural areas. This difference reflects variations in delivery infrastructure and the adoption of digital platforms. Seasonal consumption patterns further highlight these regional distinctions: Christmas represents 25-30% of annual confectionery sales, with boxed chocolates and sharing tins being popular for gifting. Easter focuses on novelty eggs and seasonal shapes that appeal to children. Valentine's Day and Mother's Day drive demand for premium boxed chocolates and personalized products, with London and other urban centers reporting higher per-capita spending during these occasions.
Regional tastes also influence the product mix. Scotland shows a preference for tablet (a crumbly fudge), while Northern Ireland favors Tayto chocolate bars, reflecting the strong presence of localized heritage brands that resist national standardization. Additionally, the United Kingdom's multicultural population is increasing demand for halal-certified (permissible under Islamic law) and culturally specific confectionery, such as Turkish delight and Indian sweets. These products cater to diaspora communities and broaden the appeal of the category beyond traditional chocolate and sugar confectionery.
Competitive Landscape
The United Kingdom confectionery market shows moderate consolidation, with Mondelez, Mars, Nestlé, and Ferrero together accounting for approximately 55-60% of revenue. However, these companies face ongoing competition from regional specialists and emerging brands that are tapping into opportunities in ethical sourcing, plant-based products, and direct-to-consumer (DTC) channels. Established players rely on their scale advantages—such as global procurement, diverse brand portfolios, and strong retailer relationships—to manage raw material price fluctuations and invest in sustainability and product reformulation. Despite these strengths, their focus on the mass market makes them susceptible to high fat, sugar, and salt (HFSS) regulations and changing consumer preferences that increasingly favor premium and functional alternatives.
Smaller competitors, such as Tony's Chocolonely and Hotel Chocolat, stand out by emphasizing strategies like promoting slave-free cocoa and offering experiential retail experiences. These approaches allow them to charge price premiums of 20-40% and maintain margins despite fluctuations in commodity prices. However, their limited distribution networks pose challenges to scaling volume growth. The competitive environment is increasingly driven by omnichannel integration, with established players acquiring or partnering with e-commerce specialists to safeguard market share, while digital-native brands leverage data analytics to improve targeting and reduce customer acquisition costs.
Regulatory compliance is becoming a key challenge in the market. HFSS nutrient profiling and extended producer responsibility (EPR) schemes introduce fixed costs that favor larger players with economies of scale. At the same time, these regulations open doors for reformulation specialists and packaging innovators who can develop compliant solutions. The market outlook suggests that mid-sized brands lacking scale or differentiation are likely to face margin pressures. In contrast, premium and mass-market leaders are expected to strengthen their positions through mergers and acquisitions, innovation, and effective omnichannel strategies.
United Kingdom Confectionery Industry Leaders
Chocoladefabriken Lindt & Sprüngli AG
Ferrero International SA
Mars Incorporated
Mondelēz International Inc.
Nestlé SA
- *Disclaimer: Major Players sorted in no particular order


Recent Industry Developments
- September 2025: Walkers Chocolates launched a recyclable paper wrapper co-created with UPM Specialty Papers (United Paper Mills) and EvoPak, supporting sustainable packaging goals and reducing plastic usage across major UK retailers and international markets.
- February 2025: Nestlé has launched KitKat tablets in Europe, Canada, and South Africa, offering double chocolate, hazelnut, and salted caramel flavors. The innovation targets growing demand for indulgent, shareable chocolate formats, with production centered in Sofia, Bulgaria.
- October 2024: Nestlé launched a trial of paper-based packaging for its Quality Street sharing tub at Tesco, deploying over 200,000 units during the Christmas season to test consumer acceptance of sustainable materials that eliminate plastic while maintaining product freshness and shelf appeal.


United Kingdom Confectionery Market Report Scope
Chocolate, Gums, Snack Bar, Sugar Confectionery are covered as segments by Confections. Convenience Store, Online Retail Store, Supermarket/Hypermarket, Others are covered as segments by Distribution Channel.| Chocolate | Dark Chocolate | |
| Milk and White Chocolate | ||
| Sugar Confectionery | Hard Candy | |
| Mints | ||
| Pastilles, Gummies, and Jellies | ||
| Toffees and Nougats | ||
| Lollipops | ||
| Other | ||
| Snack Bar | Cereal Bar | |
| Energy Bar | ||
| Protein Bar | ||
| Fruit and Nut Bar | ||
| Gums | Chewing Gum | Sugar Chewing Gum |
| Sugar-free Chewing Gum | ||
| Bubble Gum | ||
| Single-serve |
| Multipacks |
| Mass |
| Premium |
| Supermarket/Hypermarket |
| Online Retail Store |
| Convenience Store |
| Other Distribution Channels |
| By Type | Chocolate | Dark Chocolate | |
| Milk and White Chocolate | |||
| Sugar Confectionery | Hard Candy | ||
| Mints | |||
| Pastilles, Gummies, and Jellies | |||
| Toffees and Nougats | |||
| Lollipops | |||
| Other | |||
| Snack Bar | Cereal Bar | ||
| Energy Bar | |||
| Protein Bar | |||
| Fruit and Nut Bar | |||
| Gums | Chewing Gum | Sugar Chewing Gum | |
| Sugar-free Chewing Gum | |||
| Bubble Gum | |||
| By Packaging Type | Single-serve | ||
| Multipacks | |||
| By Price Tier | Mass | ||
| Premium | |||
| By Distribution Channel | Supermarket/Hypermarket | ||
| Online Retail Store | |||
| Convenience Store | |||
| Other Distribution Channels | |||


Market Definition
- Milk and White Chocolate - Milk chocolates is a solid chocolate made with milk (in the form of either milk powder, liquid milk, or condensed milk) and cocoa solids. White chocolate is made from cocoa butter and milk and contains no cocoa solids whatsoever. The scope includes regular chocolates, low-sugar, and sugar-free variants
- Toffees & Nougats - Toffees include hard, chewy, and small or one-bite candies marketed with labels as toffee or toffee-like confectionery. Nougat is a chewy confection with almond, sugar, and egg white as a basic ingredient; and it originated in Europe and Middle East countries.
- Cereals Bars - A snack composed of breakfast cereal that has been compressed into a bar shape and is held together with a form of edible adhesive. The scope includes snack bars made with cereals such as rice, oats, corn, etc. mixed with a binding syrup. These also include products labeled as cereal bars, cereal treat bars, or grain bars.
- Chewing Gum - This is a preparation for chewing, usually made of flavored and sweetened chicle or such substitutes as polyvinyl acetate. The types of chewing gums included in the scope are sugar-chewing gums and sugar-free chewing gums
| Keyword | Definition |
|---|---|
| Dark Chocolate | Dark chocolate is a form of chocolate containing cocoa solids and cocoa butter without the milk. |
| White Chocolate | White chocolate is the type of chocolate containing the highest percentage of milk solids, typically around or over 30 percent. |
| Milk Chocolate | Milk chocolate is made from dark chocolate that has a low cocoa solid content and higher sugar content, plus a milk product. |
| Hard Candy | A candy made of sugar and corn syrup boiled without crystallizing. |
| Toffees | A hard, chewy, often brown sweet that is made from sugar boiled with butter. |
| Nougats | A chewy or brittle candy containing almonds or other nuts and sometimes fruit. |
| Cereal bar | A cereal bar is a bar-shaped food product, made by pressing cereals and usually dried fruit or berries, which are in most cases held together by glucose syrup. |
| Protein bar | Protein bars are nutrition bars that contain a high proportion of protein to carbohydrates/fats. |
| Fruit & Nut bar | These are often based on dates with other dried fruit and nut additions and, in some cases, flavorings. |
| NCA | The National Confectioners Association is an American trade organization that promotes chocolate, candy, gum and mints, and the companies that make these treats. |
| CGMP | Current good manufacturing practices are those conforming to the guidelines recommended by relevant agencies. |
| Unstandardized foods | Unstandardized foods are those that do not have a standard of identity or that deviate from a prescribed standard in any manner. |
| GI | The glycemic index (GI) is a way of ranking carbohydrate-containing foods based on how slowly or quickly they are digested and increase blood glucose levels over a period of time |
| Skimmed milk powder | Skimmed milk powder is obtained by removing water from pasteurized skim milk by spray-drying. |
| Flavanols | Flavanols are a group of compounds found in cocoa, tea, apples, and many other plant-based foods and beverages. |
| WPC | Whey protein concentrate- the substance obtained by the removal of sufficient nonprotein constituents from pasteurized whey so that the finished dry product contains greater than 25% protein. |
| LDL | Low density Lipoprotein- the bad cholesterol |
| HDL | High density Lipoprotein- the good cholesterol |
| BHT | butylated Hydroxytoluene is a lab-made chemical that is added to foods as a preservative. |
| Carrageenan | Carrageenan is an additive used to thicken, emulsify, and preserve foods and drinks. |
| Free form | Not containing certain ingredients, such as gluten, dairy, or sugar. |
| Cocoa butter | It is a fatty substance obtained from cocoa beans, used in the manufacture of confectionery. |
| Pastellies | A type of of Brazilian candy made from sugar, eggs, and milk. |
| Draggees | Small, round candies that are coated with a hard sugar shell |
| CHOPRABISCO | Royal Belgian Association of the chocolate, pralines, biscuit, and confectionery industry- A trade association that represents the Belgian chocolate industry. |
| European Directive 2000/13 | A European Union directive that regulates the labeling of food products |
| Kakao-Verordnung | The German chocolate ordinance, a set of regulations that define what can be labeled as "chocolate" in Germany. |
| FASFC | Federal Agency for the Safety of the Food Chain |
| Pectin | A natural substance that is derived from fruits and vegetables. It is used in confectionery to create a gel-like texture. |
| Invert sugars | A type of sugar that is made up of glucose and fructose. |
| Emulsifier | A substance that helps to mix to liquids that does not mix together. |
| Anthocyanins | A type of flavonoid that is responsible for the red, purple, and blue colors of confectionery. |
| Functional Foods | Foods that have been modified to provide additional health benefits beyond basic nutrition. |
| Kosher certificate | This certification verifies that the ingredients, production process including all machinery, and/or food-service process complies with the standards of Jewish dietary law |
| Chicory root extract | A natural extract from the chicory root that is a good source of fiber, calcium, phosphorous, and folate |
| RDD | Recommended daily dose |
| Gummies | A chewy gelatin-based candy that is often flavored with fruit. |
| Nutraceuticals | Food or dietary supplements that are claimed to have health benefits. |
| Energy bars | Snack bars that are high in carbohydrates and calories are designed to provide energy on the go. |
| BFSO | Belgian Food Safety Organization for the food chain. |


Research Methodology
Mordor Intelligence follows a four-step methodology in all our reports.
- Step-1: Identify Key Variables: In order to build a robust forecasting methodology, the variables and factors identified in Step 1 are tested against available historical market numbers. Through an iterative process, the variables required for market forecast are set, and the model is built on the basis of these variables.
- Step-2: Build a Market Model: Market-size estimations for the forecast years are in nominal terms. Inflation is not a part of the pricing, and the average selling price (ASP) is kept constant throughout the forecast period for each country.
- Step-3: Validate and Finalize: In this important step, all market numbers, variables, and analyst calls are validated through an extensive network of primary research experts from the market studied. The respondents are selected across levels and functions to generate a holistic picture of the market studied.
- Step-4: Research Outputs: Syndicated Reports, Custom Consulting Assignments, Databases & Subscription Platforms


