Market Overview
| Study Period | 2021 - 2031 |
|---|---|
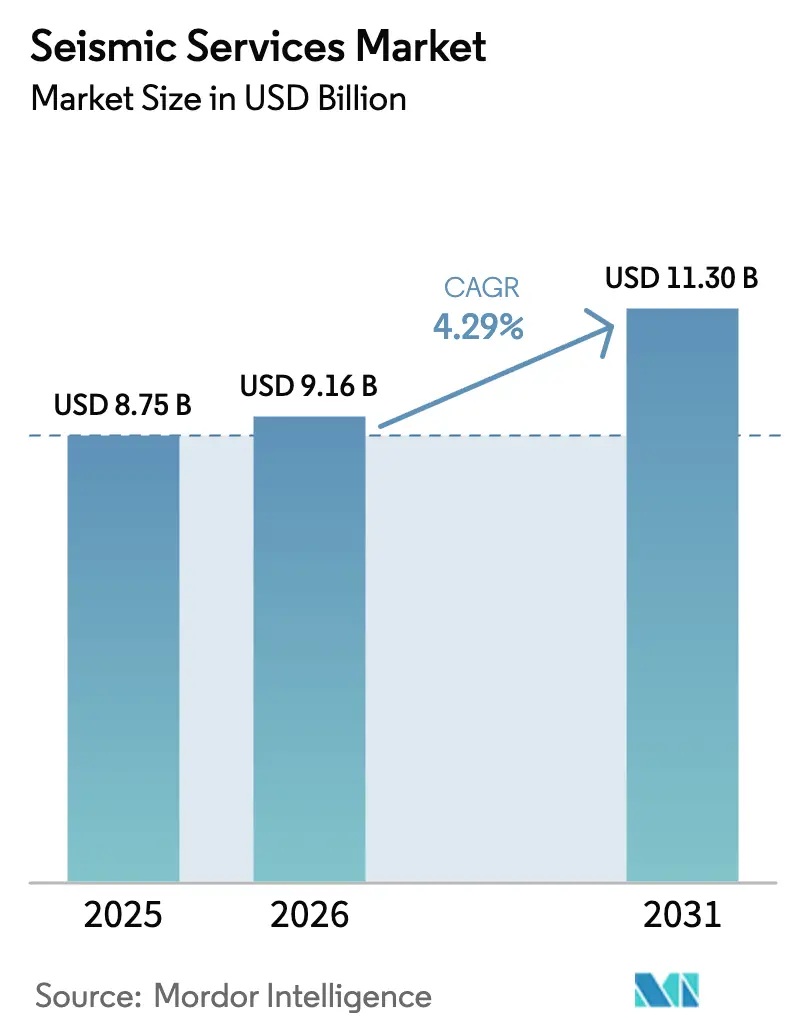
| Market Size (2026) | USD 9.16 Billion |
| Market Size (2031) | USD 11.30 Billion |
| Growth Rate (2026 - 2031) | 4.29% CAGR |
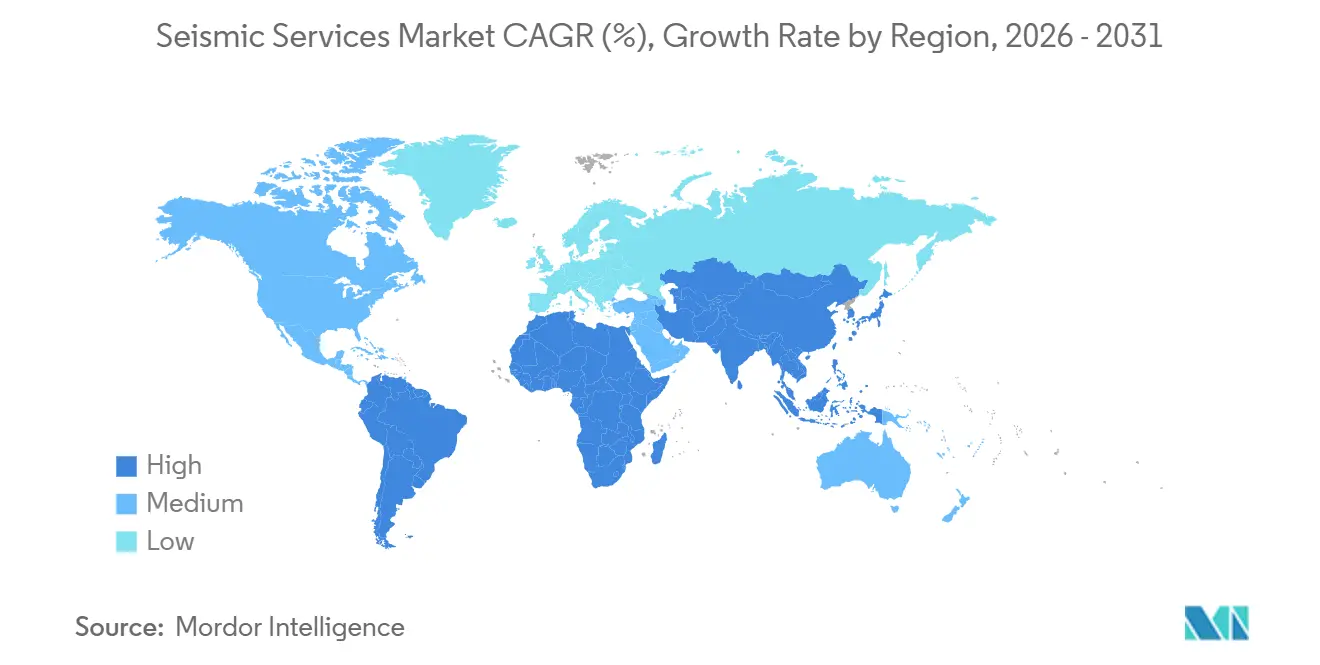
| Fastest Growing Market | Asia Pacific |
| Largest Market | North America |
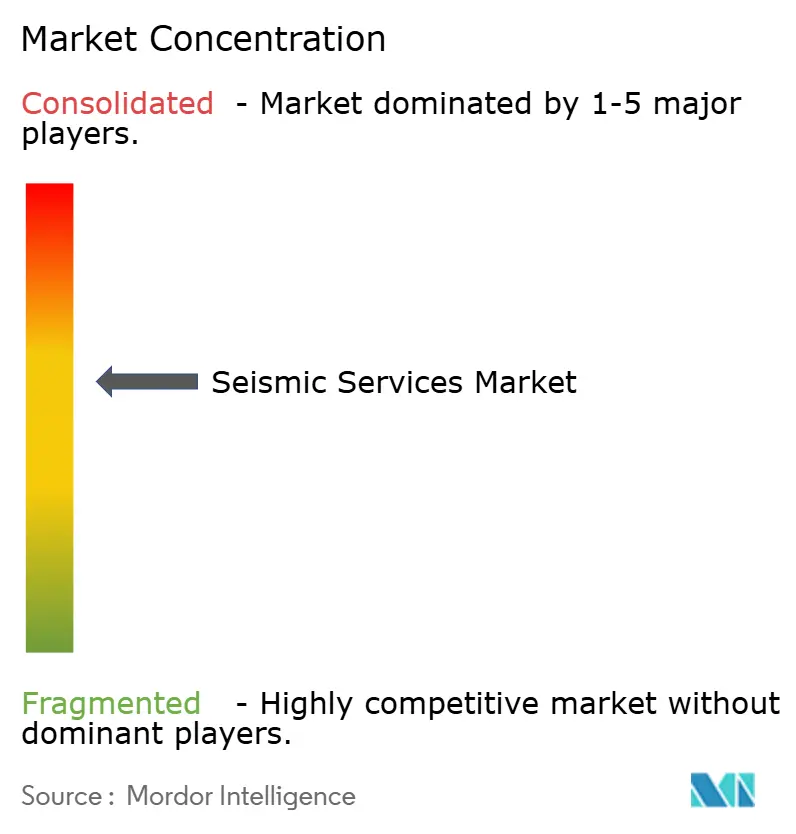
| Market Concentration | Medium |
Major Players *Disclaimer: Major Players sorted in no particular order Image © Mordor Intelligence. Reuse requires attribution under CC BY 4.0. | |
Seismic Services Market Analysis by Mordor Intelligence
The Seismic Services Market size is expected to increase from USD 8.75 billion in 2025 to USD 9.16 billion in 2026 and reach USD 11.30 billion by 2031, growing at a CAGR of 4.29% over 2026-2031.
A selective revival in offshore exploration spending, especially in deepwater plays, is raising demand for large-scale 3D and 4D surveys even while global upstream oil investment contracted 6% in the same year, indicating disciplined capital allocation to high-return assets.[1]International Energy Agency, “World Energy Investment 2025,” IEA.ORG Operators are directing budgets toward Brazil’s pre-salt, Guyana’s Stabroek block, and Middle East gas megaprojects, which sustain utilization rates for vessels equipped with ocean-bottom node (OBN) and long-offset streamer technology. Conversely, North American shale activity fell, compressing multi-client pre-funding and amplifying margin pressure for vessel owners burdened with debt from the 2014–2020 downturn. Service providers that integrate cloud-native processing and machine-learning interpretation are capturing new revenue pools as clients seek faster turnaround, lower unit costs, and greater insight from legacy data libraries.
Key Report Takeaways
- By service, the Data Acquisition segment held 65.8% of the seismic services market share in 2025, whereas Data Processing and Interpretation is forecast to expand at a 5.3% CAGR through 2031.
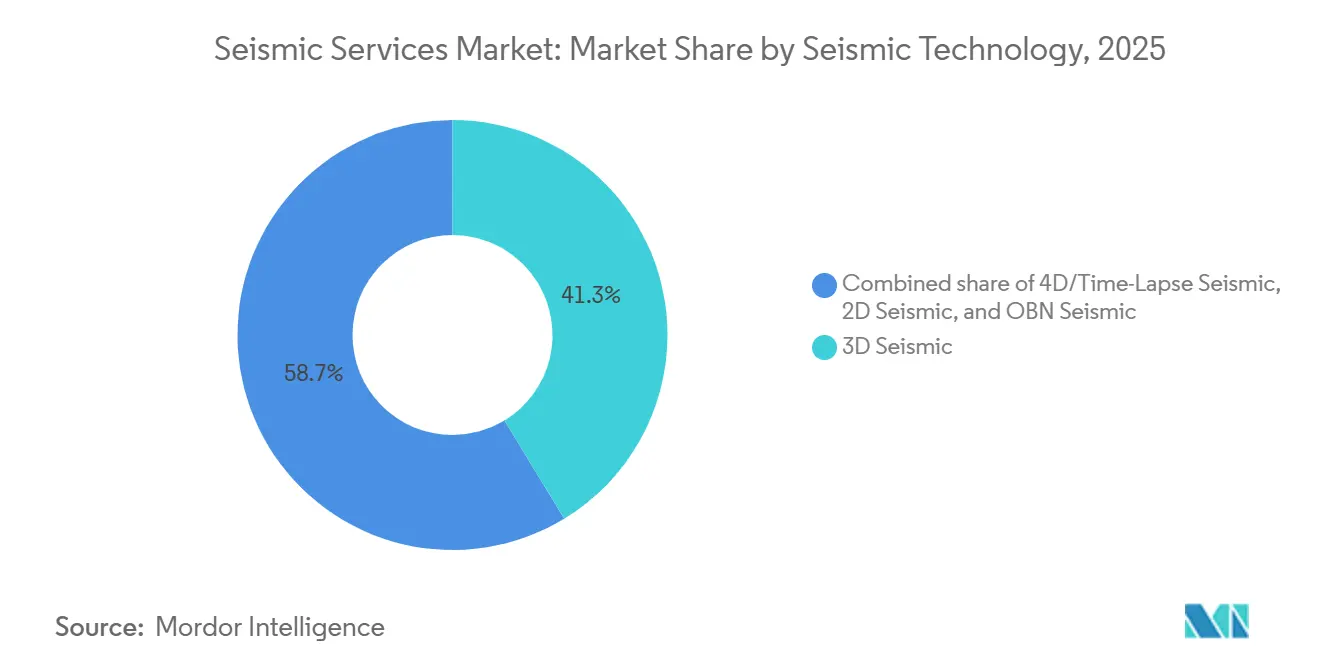
- By seismic technology, 3D Seismic led with 41.3% revenue share in 2025, while 4D/Time-Lapse Seismic is projected to record a 7.1% CAGR to 2031.
- By deployment location, onshore commanded 70.5% of the seismic services market size in 2025, and offshore is expected to accelerate at an 7.3% CAGR between 2026 and 2031.
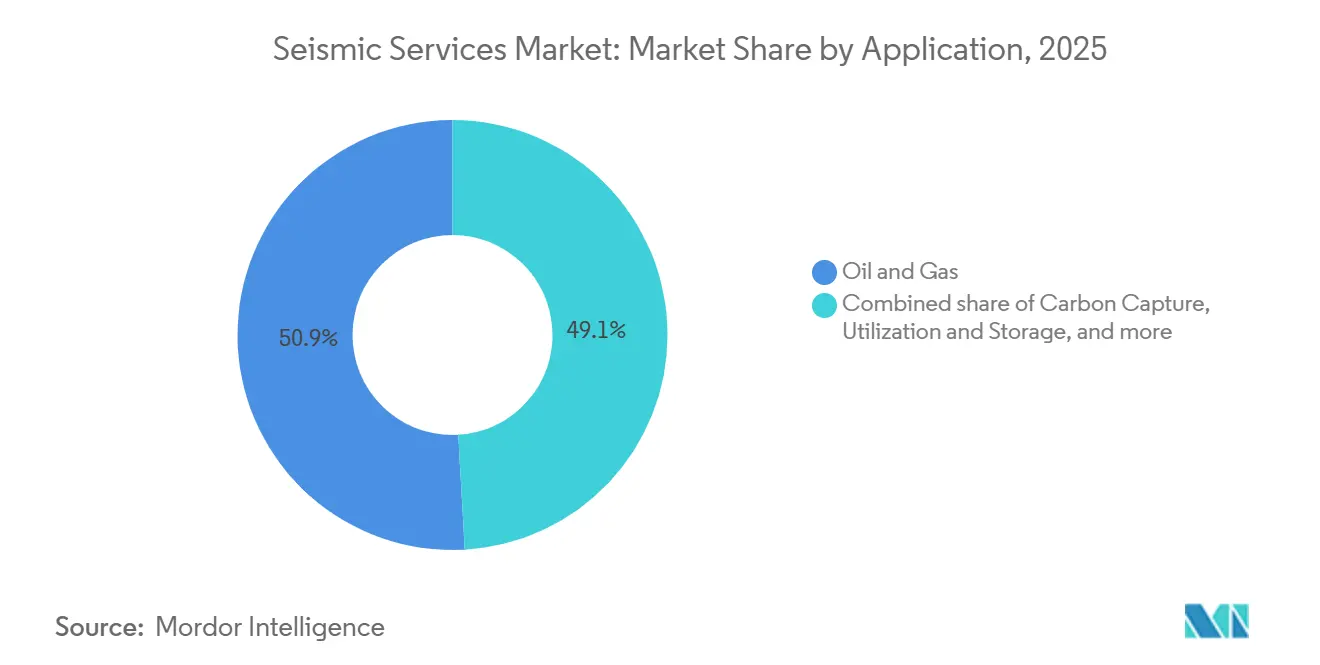
- By application, oil and gas contributed 50.9% of 2025 revenue, whereas carbon capture, utilization and storage (CCUS) is anticipated to surge at a 16.5% CAGR through 2031.
- By geography, North America captured 36.7% revenue share in 2025, while Asia-Pacific is forecast to achieve the fastest regional CAGR at 9.9% during the outlook period.
Note: Market size and forecast figures in this report are generated using Mordor Intelligence’s proprietary estimation framework, updated with the latest available data and insights as of January 2026.
Global Seismic Services Market Trends and Insights
Drivers Impact Analysis*
| Driver | (~) % Impact on CAGR Forecast | Geographic Relevance | Impact Timeline |
|---|---|---|---|
| Rebound in offshore E&P spending | +1.2% | Global focus on the Middle East, Asia-Pacific, South America | Medium term (2-4 years) |
| Deployment of 4D time-lapse seismic | +0.8% | North America, Europe, Middle East | Long term (≥ 4 years) |
| NOC expansion into deepwater frontiers | +1.0% | Asia-Pacific, Middle East, Africa | Long term (≥ 4 years) |
| Offshore wind site assessment demand | +0.5% | Europe, North America, Asia-Pacific | Medium term (2-4 years) |
| Fiber-optic DAS for permanent monitoring | +0.4% | North America, Middle East | Long term (≥ 4 years) |
| CCS project surveillance requirements | +0.6% | Europe, North America, Asia-Pacific | Long term (≥ 4 years) |
| Source: Mordor Intelligence | |||
Rebound in Offshore E&P Spending
Global upstream outlays touched roughly USD 570 billion in 2025, yet the 6% reduction in overall oil spending confirms that only the highest-margin deepwater prospects received incremental capital.[2]International Energy Agency, “World Energy Investment 2025,” IEA.ORG Saudi Aramco’s 17,000 square-kilometer 3D program over the Jafurah unconventional gas field and ADNOC’s salt-structure imaging campaigns typify the pivot toward complex, high-value reservoirs. Because many vessels remain tethered to the Gulf of Mexico and North Sea, service companies must increasingly redeploy fleets into the Middle East and Asia-Pacific, raising repositioning costs and execution risk. This geographic concentration intensifies competition for crews capable of acquiring wide-azimuth, long-offset data in logistically challenging waters. The outcome is a bifurcated seismic services market where premium assets earn strong day rates while older vessels stay cold-stacked.
Deployment of 4D Time-Lapse Seismic
The International Association of Oil & Gas Producers released new repeatability guidelines in December 2024 that reduced acquisition uncertainty and catalyzed wider adoption of permanent monitoring arrays.[3]International Association of Oil & Gas Producers, “4D Seismic Acquisition Guidelines,” IOGP.ORG BP’s Thunder Horse OBN installation and regulator-mandated monitoring at North Sea CCS sites demonstrate that 4D imaging is now routine for both hydrocarbon optimization and carbon storage assurance. TGS and Shearwater GeoServices secured multi-year frame agreements in 2025 to execute baseline and monitor surveys, ensuring recurring revenue streams that are less cyclical than exploration campaigns. Incremental recovery of just 2% across a 1 billion-barrel field can finance node arrays costing USD 100 million, yet adoption remains limited in frontier provinces where appraisal drilling competes for funds. As more CCS hubs enter the operational phase, mandatory annual 3D or biennial 4D surveys are set to lock in long-term contracts, smoothing the revenue profile for data owners.
NOC Expansion into Deepwater Frontiers
State-owned enterprises now shoulder a disproportionate share of exploration risk. CNOOC initiated a 10,000 square-kilometer 3D sweep across the Pearl River Mouth Basin in 2025 to chase sub-salt gas, and ONGC commissioned high-resolution imaging of Paleogene targets in the Krishna-Godavari basin. While these programs ensure baseline demand, they expose seismic contractors to project delay risk when rigs, permits, or subsidies falter, as witnessed when Nigeria suspended deepwater surveys pending fiscal reform. Nevertheless, deepwater forays by Saudi Aramco and ADNOC underpin a multiyear pipeline of OBN and wide-azimuth streamer work in the Red Sea and Arabian Gulf. The strategic thrust of NOCs into ultra-deepwater domains enlarges the addressable seismic services market, yet operators prefer turnkey contracts that combine acquisition with fast-track processing, favoring vertically integrated suppliers.
Offshore Wind Site Assessment Demand
Global offshore wind capacity additions surpassed 15 GW in 2025, igniting fresh demand for geophysical site surveys as coastal nations fast-track lease rounds. European developers in the North Sea and Baltic Sea, United States leaseholders along the Atlantic seaboard, and Asian sponsors off Taiwan and Japan all require shallow-water seismic to map paleo-channels, boulder zones, and fault networks. Because timelines from lease award to financial close are compressed, clients stipulate a rapid turnaround of 2D ultra-high-resolution datasets followed by targeted 3D grids. Traditional oil-focused contractors face competition from marine engineering specialists that leverage compact vessels suited to near-shore environments. As turbine sizes rise, foundation depths increase, pushing demand for deeper penetration seismic that converges with oil-grade equipment standards, thereby expanding the seismic services market to non-oil applications.
Restraints Impact Analysis*
| Restraint | (~) % Impact on CAGR Forecast | Geographic Relevance | Impact Timeline |
|---|---|---|---|
| Capex reallocation to renewables | -0.9% | Europe, North America, global oil majors | Medium term (2-4 years) |
| Strict marine noise regulations | -0.5% | Europe, North America, Asia-Pacific | Short term (≤ 2 years) |
| Shrinking multi-client funding pool | -0.4% | North America, Europe, mature basins | Medium term (2-4 years) |
| High debt load of vessel owners | -0.3% | Europe, Asia-Pacific | Long term (≥ 4 years) |
| Source: Mordor Intelligence | |||
Capex Reallocation to Renewables
Shell, BP, and TotalEnergies each shifted more than 20% of their 2025 upstream budgets toward renewable assets, a move that directly reduced seismic line items across European portfolios. Equinor spent USD 2.3 billion on offshore wind in the North Sea and U.S. Atlantic, diverting funds that traditionally financed North Sea 4D programs. Investor activism and regulatory decarbonization mandates are amplifying this migration of capital, and even some national oil companies are evaluating hydrogen investments. The consequence is a smaller pool of discretionary exploration spending, lowering the potential size of new multi-client programs and increasing reliance on pre-funding. Asian and Middle Eastern NOCs partially offset the reduction, yet the geographic rebalancing raises currency risk and lengthens sales cycles for data library owners.
Strict Marine Noise Regulations
The International Maritime Organization’s MEPC.1/Circ.906 guideline and the EU Marine Strategy Framework Directive demand lower acoustic footprints, compelling contractors to adopt bubble curtains, reduced line speeds, and seasonal exclusions that extend project timelines. NOAA’s 2025 update to acoustic thresholds in the Gulf of Mexico introduced larger exclusion zones for marine mammals, forcing survey vessels to idle during peak biological activity. Australia tightened permitting in the North West Shelf, delaying several 3D campaigns and adding cost overruns for operators. Shearwater GeoServices disclosed a 12% increase in 2025 survey costs attributable to regulation-driven downtime. The cumulative effect of these rules lowers vessel utilization and margins, particularly for older fleets unable to retrofit quieter source arrays.
*Our forecasts treat driver/restraint impacts as directional, not additive. The impact forecasts reflect baseline growth, mix effects, and variable interactions.
Segment Analysis
By Service: Data Acquisition Dominates, Processing Gains Traction
Data Acquisition accounted for 65.8% of 2025 revenue within the seismic services market, illustrating the capital intensity of streamer spreads, land crews, and OBN fleets. Multi-year acquisition projects in Brazil, China, and Saudi Arabia keep vessel utilization above 80% for modern crews, supporting a stable backlog. Yet Data Processing and Interpretation is forecast to grow at a 5.3% CAGR through 2031, propelled by cloud platforms such as CGG’s GeoSoftware and SLB’s Delfi that shorten delivery cycles and embed AI-driven attribute extraction.[4]CGG, “GeoSoftware AI Suite,” CGG.COM Operators increasingly award integrated contracts that bundle acquisition with analytics, favoring providers capable of delivering end-to-end workflows. Small-scale processing houses without cloud capabilities risk marginalization as clients insist on real-time project dashboards, automated quality control, and machine-learning tomography. The continuous expansion of legacy data libraries further enlarges the seismic services market size for reprocessing, reservoir characterization, and carbon storage feasibility studies.
Providers emphasize elastic compute, containerized algorithms, and subscription licenses to shift revenue models from project billing toward recurring software services. Data residency laws in Europe and the Middle East require regional data centers, prompting alliances with hyperscale cloud firms. As machine-learning inversion, facies classification, and automated fault picking mature, value capture migrates up the stack, compressing acquisition margins but elevating software gross profit. The combined effect is a gradual but irreversible redistribution of the seismic services market toward digital services.
By Seismic Technology: 3D Remains Core, 4D/Time-Lapse Accelerates
3D Seismic held 41.3% of the seismic services market share in 2025, remaining indispensable for deepwater imaging beneath salt, basalt, and complex overburden. Wide-azimuth configurations and longer offsets dominate new programs in Brazil’s Santos Basin and Guyana’s Stabroek block. Meanwhile, 4D/Time-Lapse Seismic exhibits the fastest expansion, at a projected 7.1% CAGR to 2031, underpinned by mandatory surveillance of CO₂ plume migration at North Sea and Gulf Coast storage sites. Ocean-bottom nodes with battery lives surpassing 180 days support both 3D baseline and 4D monitor acquisitions, effectively creating a single technology ecosystem that serves production optimization and emission mitigation. The convergence heightens capital efficiency for contractors owning adaptable OBN inventories, further enlarging addressable revenue.
2D Seismic retains relevance for reconnaissance in frontier provinces such as the Arctic Barents Sea, where Geoex completed a regional grid in 2025, but its share of overall spend continues to shrink. Regulators now expect higher-resolution submissions in licensing applications, accelerating the shift from 2D to 3D or sparse OBN designs. The combination of rising regulation, deepwater complexity, and CCS oversight reshapes the technology mix in favor of high-density arrays, securing long-term growth for the seismic services market.


By Deployment Location: Onshore Holds Lead, Offshore Surges
Onshore still generated 70.5% of revenue in 2025 thanks to large-scale land seismic in China’s western basins, India’s Assam shelf, and Saudi Arabia’s Empty Quarter. High-channel digital sensors and lightweight nodes enable rapid crew moves across arid terrains, sustaining volume. However, offshore spending is climbing at an 7.3% CAGR, fueled by deepwater frontier campaigns and increasingly by offshore wind site assessments. National oil companies in Asia-Pacific, the Middle East, and South America favor proprietary wide-azimuth streamer and node configurations, which command premium pricing and raise capital barriers to entry, thereby reinforcing mid-term consolidation of the seismic services market.
Shallow-water CCS storage projects and fixed foundation wind farms extend the offshore addressable base, requiring ultra-high-resolution boomer, chirp, and sub-bottom profiling systems. Contractors with dual-use vessels capable of switching between deepwater OBN and shallow-water UHRS can maximize calendar utilization. Transition-zone projects, such as mangrove-lined deltas and tidal flats, increasingly demand hybrid land-marine solutions, rewarding companies that have modular equipment portfolios and local partnerships.
By Application: Oil & Gas Stays Dominant, CCUS Booms
Oil and gas applications represented 50.9% of 2025 spending, confirming that exploration, appraisal, and recovery optimization still anchor the seismic services market. Deepwater pre-salt developments in Brazil and growth drilling in Guyana tie seismic programs directly to sanction decisions, underpinning backlog predictability. Carbon capture, utilization and storage (CCUS), however, is the fastest-expanding use case, forecast to grow 16.5% a year through 2031. Northern Lights, Porthos, and Track-1 clusters have codified seismic monitoring as a compliance obligation, cementing an enduring service line that now captures long-dated, inflation-indexed contracts. Offshore wind, geothermal exploration, mining, and civil-infrastructure imaging round out a diversified demand profile that tempers cyclicality.
Clients pursuing CCS, geothermal, or wind emphasize environmental stewardship, imposing stricter data transparency and ESG reporting. Seismic contractors able to certify lower emissions, employ biofuels, or adopt electric source vessels gain tender advantages. These factors, coupled with cross-industry technology transfer, advance the structural growth of the seismic services market.
Geography Analysis
North America held 36.7% of the seismic services market revenue in 2025, propelled by Gulf of Mexico deepwater developments and Canadian Atlantic prospects, despite a drop in U.S. shale permitting. The U.S. Inflation Reduction Act incentivized new CCS surveys along the Gulf Coast, while Canada’s Clean Fuel Standard attracted seismic programs targeting saline aquifers in Alberta. NOAA’s stricter acoustic criteria elevated compliance costs, yet the abundance of existing infrastructure and advanced processing hubs keeps the region attractive for integrated contractors. Cloud connectivity and data residency requirements have encouraged partnerships between seismic firms and hyperscale cloud providers, bolstering digital processing share within the seismic services market.
Asia-Pacific is projected to log a 9.9% CAGR to 2031, the fastest globally. CNOOC’s Bohai Bay initiatives, ONGC’s Krishna-Godavari campaigns, and Woodside’s Scarborough gas project ensure continuous demand for long-offset imaging. Southeast Asian governments are reviving acreage offerings with gas-to-power ambitions, producing a pipeline of 2D reconnaissance and 3D appraisal work. Regulatory regimes remain less prescriptive than in Europe, but local content and environmental requirements are tightening, making joint ventures with domestic crews advantageous. A young fleet of Chinese-owned vessels increases regional competition yet broadens overall capacity, fostering competitive day rates that nevertheless sustain the expansion of the seismic services market.
Europe maintains a mature yet technologically advanced landscape: Norway and the UK drive 4D and OBN uptake for legacy fields and CCS clusters, while Denmark and Germany mobilize shallow-water seismic for offshore wind. EU noise directives and CO₂ monitoring regulations extend the operational runway for high-end geophysics. South America benefits from Petrobras’s sustained pre-salt investment and ExxonMobil’s ongoing Guyana program, both reliant on high-density node surveys. Fiscal instability occasionally stalls licensing rounds, but multiyear commitments from IOCs and NOCs maintain baseline demand. The Middle East and Africa, powered by Saudi Aramco, ADNOC, and emerging Namibia discoveries, deliver large, multi-season acquisition campaigns. Government mandates for domestic processing capacity and data sovereignty encourage joint ventures, expanding the seismic services market through localized value chains.

Competitive Landscape
The competitive arena remains moderately consolidated around Schlumberger (SLB), CGG, TGS, and PGS, whose multi-client libraries and proprietary algorithms concentrate data ownership and processing expertise. These firms leverage scale to capture integrated contracts that span acquisition, processing, and reservoir studies, discouraging smaller rivals from bidding on complex deepwater projects. Shearwater GeoServices, Magseis Fairfield, and PXGEO differentiate through advanced OBN technology, emphasizing autonomous nodes with extended battery life and reduced retrieval risk. Patent filings in 2025 reveal a growing emphasis on machine-learning noise suppression, elastic inversion, and automated fault mapping, positioning digital IP as the new battleground for competitive advantage.
Digitalization has become decisive: SLB’s Delfi and CGG’s GeoSoftware platforms enable real-time collaboration between geoscientists and drilling engineers, compressing decision cycles from weeks to days. Cloud-based subscription models stabilize revenue and deepen customer lock-in, reshaping competitive moats beyond fleet count. Smaller entrants, such as STRYDE with lightweight land nodes and INOVA Geophysical with low-impact vibroseis trucks, exploit niche opportunities in geothermal and mining, pressuring incumbents to diversify. Financial resilience distinguishes leaders; high leverage among certain fleet owners restricts newbuilds and retrofits, enhancing the bargaining power of cash-rich majors. Regulatory requirements for local content and data sovereignty further fragment competition, compelling global players to form alliances with national entities to access permits and subsidies, thereby broadening the seismic services market without diluting intellectual property rights.
Seismic Services Industry Leaders
Halliburton Company
CGG SA
PGS ASA
TGS ASA
Schlumberger NV
- *Disclaimer: Major Players sorted in no particular order

Recent Industry Developments
- September 2025: CNOOC commenced a 10,000 square-kilometer 3D campaign in China’s Pearl River Mouth Basin to delineate deepwater gas.
- June 2025: Fugro secured a USD 50 million contract to perform geophysical and geotechnical surveys for North Sea offshore wind leases.
- November 2024: Abu Dhabi National Oil Company (ADNOC) awarded a USD 490 million contract to BGP, a subsidiary of CNPC, to expand its 3D seismic survey launched in 2018. The project, the largest continuous seismic survey globally, aims to uncover additional oil and gas resources using advanced AI tools for faster seismic data analysis.
- January 2024: Petrobras and Shearwater have signed a technology agreement to advance seismic exploration and field development activities in Brazil.


Global Seismic Services Market Report Scope
Seismic services involve the collecting of seismic data to create a 2D or 3D representation of the Earth's underground layers. Oil and gas businesses use the data to reduce risk in the tedious process.
The seismic services market is segmented by service, seismic technology, location of deployment, application, and geography. By service, the market is segmented into data acquisition and data processing and interpretation. By seismic technology, the market is segmented into 2D seismic, 3D seismic, 4D/time-lapse seismic, and ocean-bottom node (OBN) seismic. By location of deployment, the market is segmented into onshore and offshore. By application, the market is segmented into oil and gas, offshore energy and marine, CCUS, mining and mineral exploration, geothermal energy, civil engineering and infrastructure, and others. The report also covers the market size and forecasts for the seismic services market across major regions. For each segment, the market sizing and forecasts have been done based on revenue (USD).
By Service
| Data Acquisition |
| Data Processing and Interpretation |
By Seismic Technology
| 2D Seismic |
| 3D Seismic |
| 4D/Time-Lapse Seismic |
| Ocean-Bottom Node (OBN) Seismic |
By Deployment Location
| Onshore |
| Offshore |
By Application
| Oil and Gas |
| Offshore Energy and Marine |
| Carbon Capture, Utilization and Storage (CCUS) |
| Mining and Mineral Exploration |
| Geothermal Energy |
| Civil Engineering and Infrastructure |
| Others (Natural Hazard Assessment, Environmental Studies, and Academic & Research) |
By Geography
| North America |
| Europe |
| Asia-Pacific |
| South America |
| Middle East and Africa |
| By Service | Data Acquisition |
| Data Processing and Interpretation | |
| By Seismic Technology | 2D Seismic |
| 3D Seismic | |
| 4D/Time-Lapse Seismic | |
| Ocean-Bottom Node (OBN) Seismic | |
| By Deployment Location | Onshore |
| Offshore | |
| By Application | Oil and Gas |
| Offshore Energy and Marine | |
| Carbon Capture, Utilization and Storage (CCUS) | |
| Mining and Mineral Exploration | |
| Geothermal Energy | |
| Civil Engineering and Infrastructure | |
| Others (Natural Hazard Assessment, Environmental Studies, and Academic & Research) | |
| By Geography | North America |
| Europe | |
| Asia-Pacific | |
| South America | |
| Middle East and Africa |


Key Questions Answered in the Report
What is the current value of the seismic services market and its expected growth rate?
The market stood at USD 9.16 billion in 2026 and is forecast to reach USD 11.30 billion by 2031, reflecting a 4.29% CAGR.
Which service segment is growing the fastest?
Data Processing and Interpretation is projected to expand at a 5.3% CAGR through 2031 as operators embrace AI-enabled analytics.
Why is 4D seismic gaining traction?
Regulators and operators use 4D time-lapse surveys to maximize recovery and monitor CO2 storage integrity, driving a 7.1% projected CAGR for the technology.
Which region will see the highest growth through 2031?
Asia-Pacific is expected to achieve a 9.9% CAGR owing to deepwater campaigns by CNOOC, ONGC, and Woodside.
How are carbon capture projects influencing demand?
CCS initiatives such as Northern Lights and Porthos require baseline and annual monitoring surveys, fueling a 16.5% CAGR in seismic spending for CO2 storage applications.
Who are the leading companies in this market?
Schlumberger, CGG, TGS, and PGS dominate multi-client libraries, while Shearwater GeoServices and Magseis Fairfield lead in ocean-bottom node innovation.
Page last updated on:


