Secondary Battery Market Size and Share
Market Overview
| Study Period | 2021 - 2031 |
|---|---|
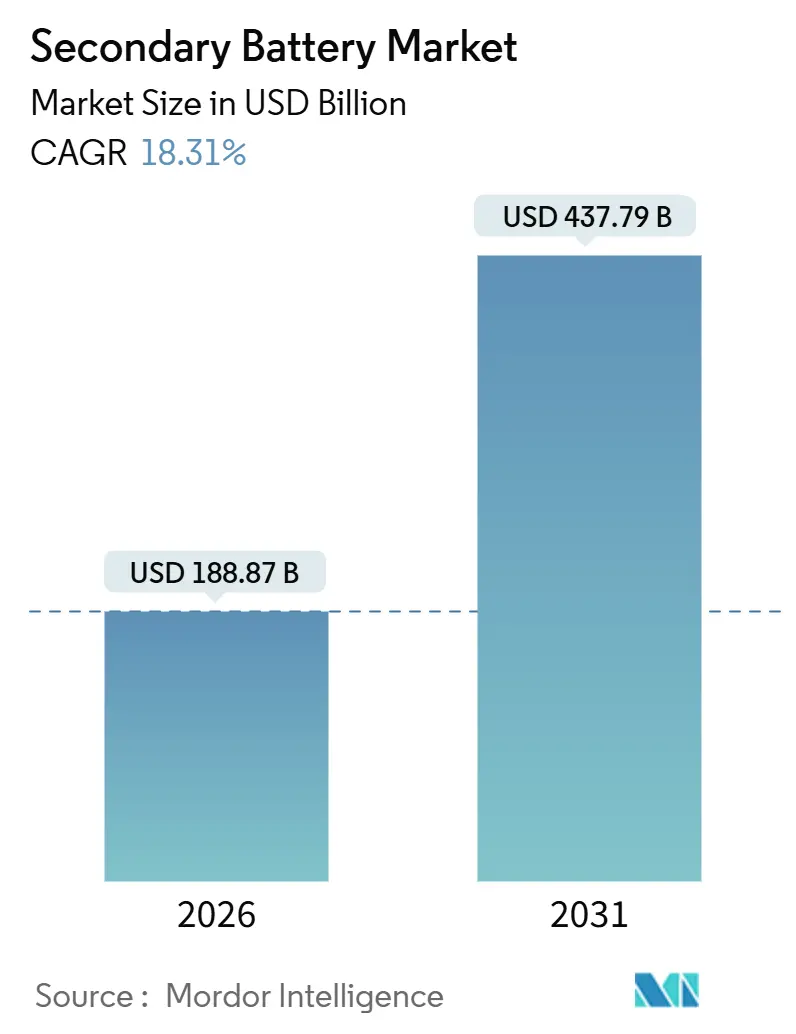
| Market Size (2026) | USD 188.87 Billion |
| Market Size (2031) | USD 437.79 Billion |
| Growth Rate (2026 - 2031) | 18.31% CAGR |
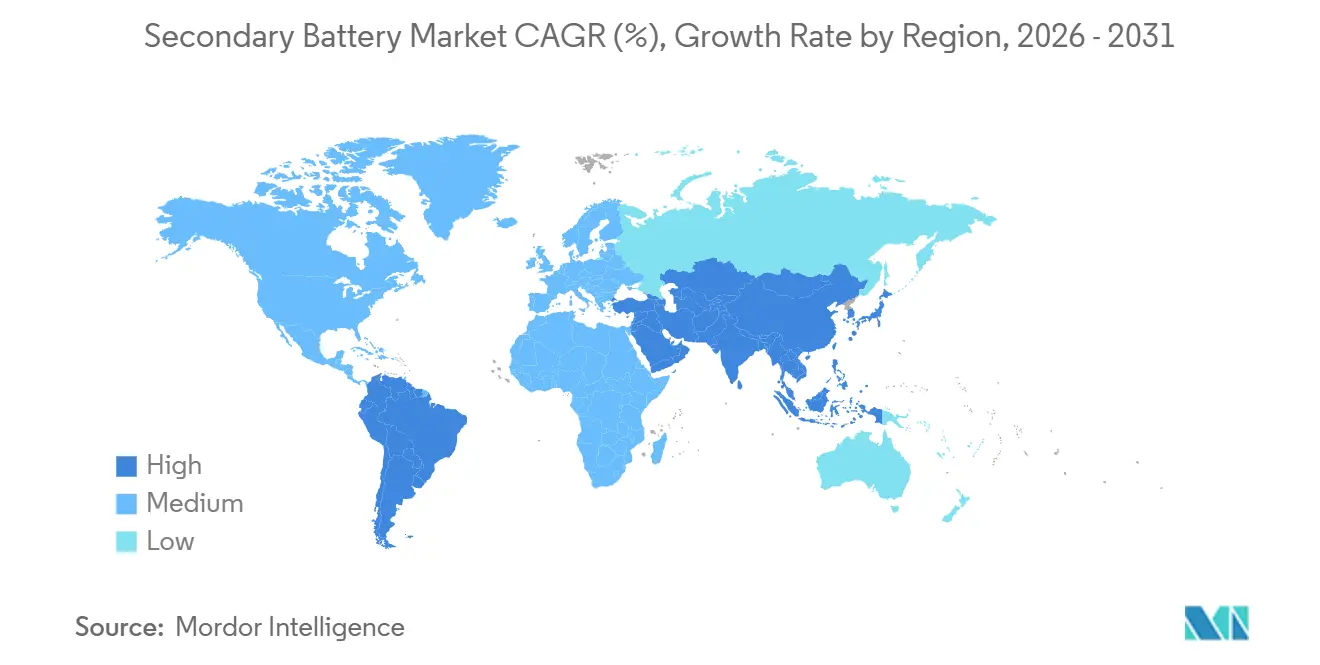
| Fastest Growing Market | Asia Pacific |
| Largest Market | Asia Pacific |
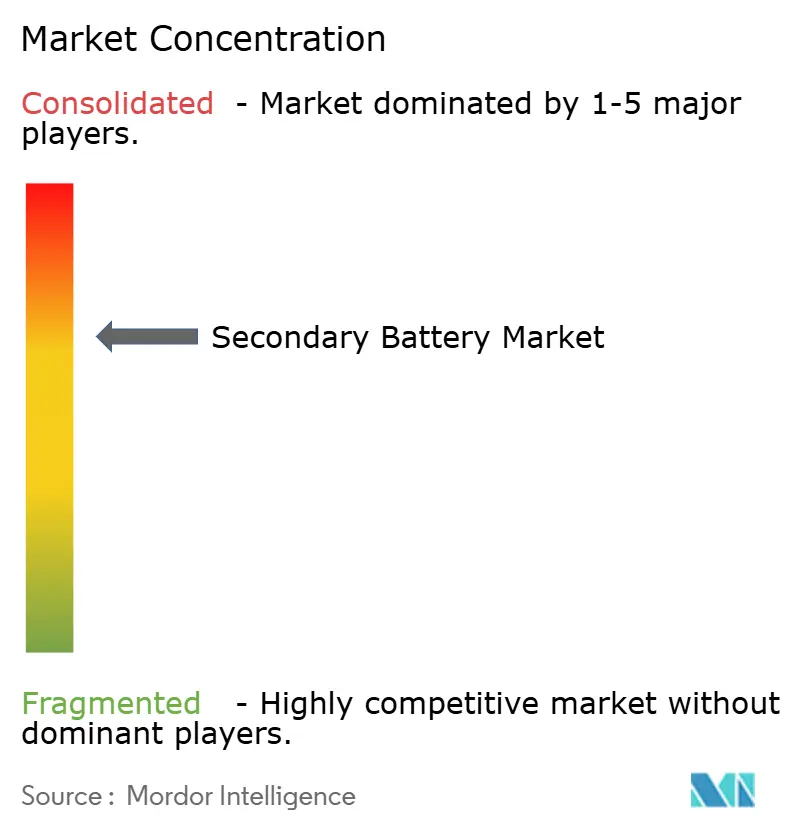
| Market Concentration | Medium |
Major Players
*Disclaimer: Major Players sorted in no particular order Image © Mordor Intelligence. Reuse requires attribution under CC BY 4.0. |
|
Secondary Battery Market Analysis by Mordor Intelligence
The Secondary Battery Market size is estimated at USD 188.87 billion in 2026, and is expected to reach USD 437.79 billion by 2031, at a CAGR of 18.31% during the forecast period (2026-2031).
Cost declines below USD 85 per kWh, the rise of sodium-ion alternatives for entry-level segments, and policy incentives that reward local cell assembly are reshaping competitive boundaries. Solid-state pilots have moved from laboratory scale to limited pre-commercial runs, prompting incumbent lithium-ion suppliers to hedge with ceramic and polymer electrolyte programs. Meanwhile, utilities are treating four-hour lithium-ion systems as dispatchable capacity, a change that is closing the demand gap with passenger EVs. Finally, integrated Asian champions continue to defend share by pairing low-cost lithium iron phosphate (LFP) chemistry with aggressive pricing, even as Western automakers pursue regionalized supply chains.
Key Report Takeaways
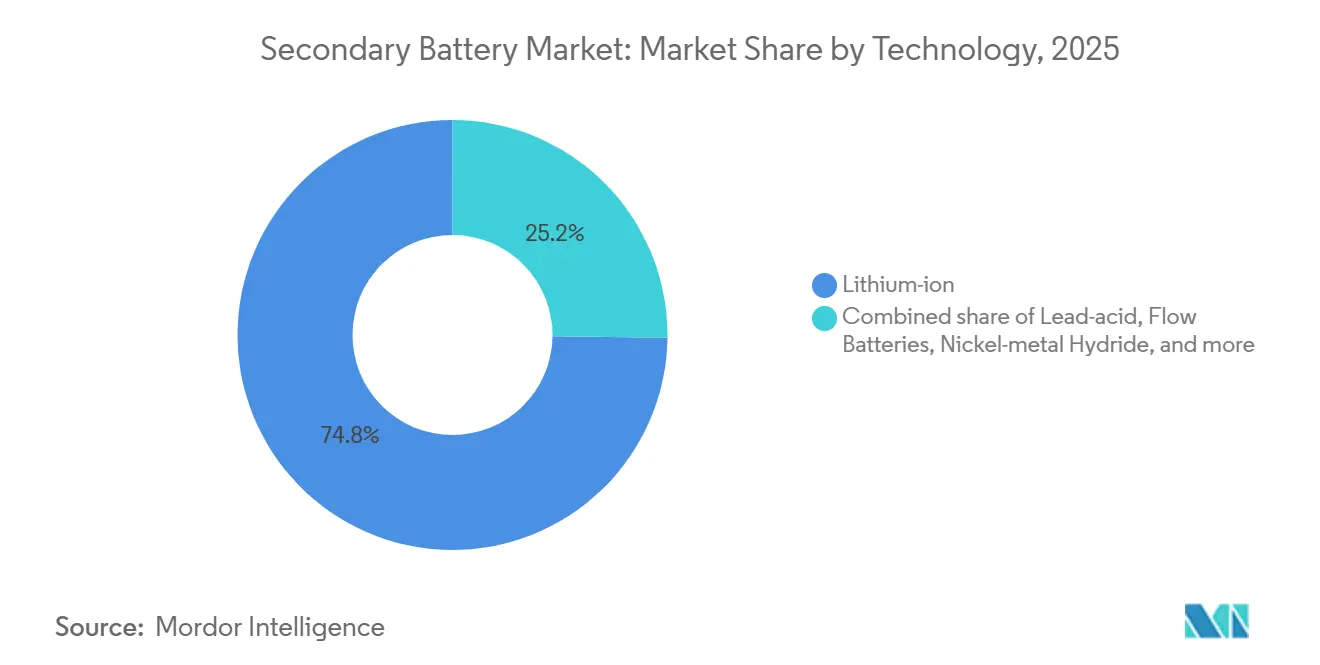
- By technology, lithium-ion captured 74.8% of the secondary battery market share in 2025, while solid-state options are projected to expand at a 24.9% CAGR through 2031.
- By form factor, cylindrical cells led with 53.5% revenue share in 2025; pouch formats are forecast to grow at a 22.2% CAGR to 2031.
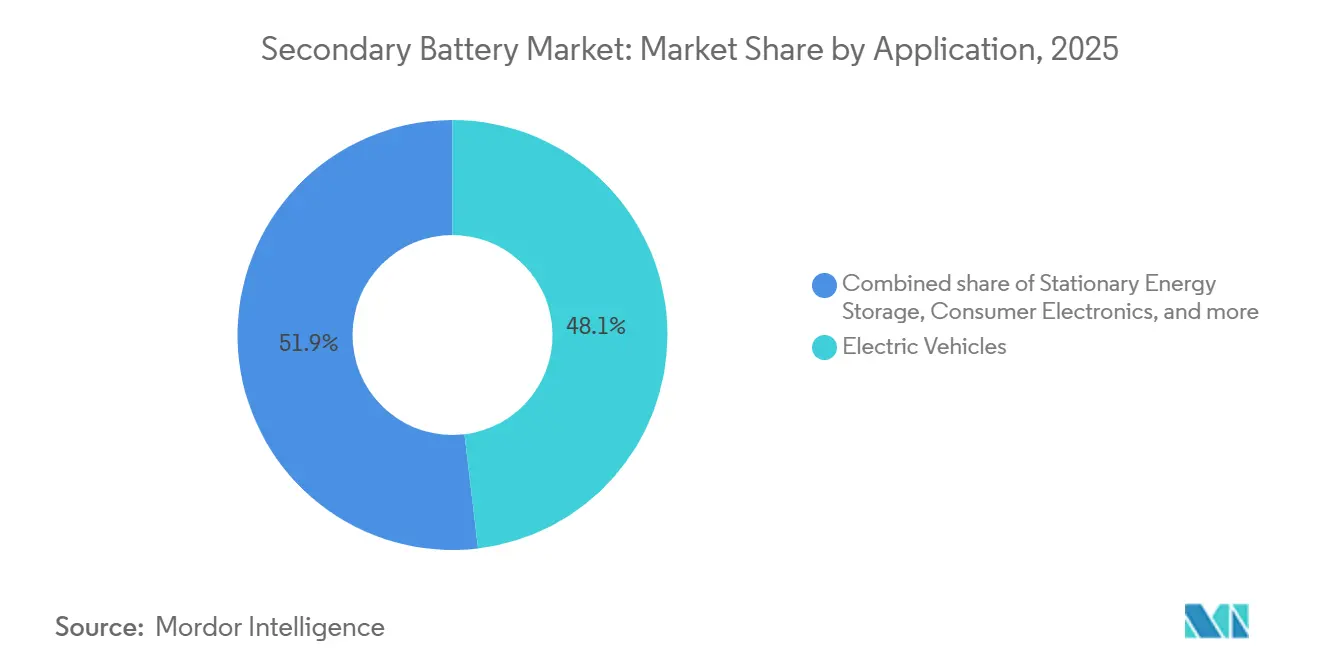
- By application, electric vehicles held 48.1% of the secondary battery market size in 2025, whereas stationary storage is advancing at a 23.5% CAGR through 2031.
- By end-user industry, automotive accounted for 50.6% revenue in 2025, yet utilities are the fastest riser at 22.8% CAGR to 2031.
- By geography, Asia-Pacific commanded 49.7% of the secondary battery market in 2025 and is poised for a 20.1% CAGR over the forecast period.
Note: Market size and forecast figures in this report are generated using Mordor Intelligence’s proprietary estimation framework, updated with the latest available data and insights as of January 2026.
Global Secondary Battery Market Trends and Insights
Drivers Impact Analysis*
| Driver | (~) % Impact on CAGR Forecast | Geographic Relevance | Impact Timeline |
|---|---|---|---|
| Surging EV adoption boosts Li-ion demand | 5.2% | Global, with APAC and Europe leading passenger EV penetration | Medium term (2-4 years) |
| Growth of renewable-integrated storage projects | 4.1% | Global, concentrated in APAC, North America, and Europe | Medium term (2-4 years) |
|
Declining Li-ion cost curve (pack |
3.8% | Global, with fastest cost reductions in China and Southeast Asia | Short term (≤ 2 years) |
| Second-life battery repurposing ecosystems | 1.9% | Europe and North America, early pilots in Japan | Long term (≥ 4 years) |
| Policy-driven localization of gigafactories | 2.7% | North America and Europe, spillover to India and Southeast Asia | Medium term (2-4 years) |
| Rapid LFP uptake for cost & safety advantages | 3.4% | APAC core, expanding to North America and Europe | Short term (≤ 2 years) |
| Source: Mordor Intelligence | |||
Surging EV Adoption Boosts Li-ion Demand
EV sales reached 13.9 million units in 2024, equal to 16% of global passenger car sales, and industry trackers expect the share to exceed 25% by 2026 [1]International Energy Agency, “Renewables 2025,” iea.org. Automakers already have offtake contracts that lock in roughly two-thirds of 2027 cell capacity, tightening supply. China crossed 38% domestic EV penetration in 2024, reinforcing a cost-driven shift toward LFP chemistries for mass-market cars. Platforms adopting 800-volt architectures, such as Hyundai E-GMP, need higher energy density, which is pushing suppliers toward silicon-rich anodes and high-nickel cathodes. Those chemistry changes force cell makers to retool lines mid-cycle, squeezing margins even as volume rises.
Growth of Renewable-Integrated Storage Projects
Utility-scale battery storage installations climbed to 45 GW worldwide in 2024, with forecasts pointing to 120 GW by 2026. California mandates 11.5 GW of storage by 2026, while Texas has a 10 GW pipeline, making four-hour lithium-ion systems a cost-effective alternative to gas peakers. Ancillary service markets pay USD 15-25 per MW-hour for frequency regulation, supporting project returns near 20%. Europe’s REPowerEU funding has accelerated tender volumes, though permitting delays shifted 40% of 2024 bids into later years. Developers with ready-to-build sites are therefore well positioned to capture the backlog.
Declining Li-ion Cost Curve (Pack < USD 85/kWh)
Average lithium-ion pack prices fell to USD 139 per kWh in 2024 and are on track for USD 113 by 2026.[2]BloombergNEF, “Electric Vehicle Outlook 2024,” about.bnef.com Chinese LFP suppliers already breached USD 95 per kWh by vertically integrating lithium refining and cathode synthesis. The USD 85 threshold is considered decisive for parity between electric and internal-combustion vehicles in the compact class. Tesla’s tabless 4680 cell aims for USD 70 per kWh by 2028, but current yields remain below 80%, limiting near-term supply. As module housings disappear through cell-to-pack designs, pack-level material intensity drops another 7-9%, reinforcing the downtrend.
Rapid LFP Uptake for Cost and Safety Gains
LFP batteries served 40% of global EV demand in 2024, up ten percentage points in two years. BYD’s Blade Battery provides 140 Wh/kg at pack level while eliminating cobalt, an ESG flashpoint for NMC chemistries. Ford adopted LFP in its Mustang Mach-E standard-range models, cutting battery costs by roughly one-quarter. CATL’s M3P variant reached 210 Wh/kg in 2024 pilot cells, narrowing the density gap with NMC-811 cells to 15%. As insurance premiums rise for NMC stationary projects, the inherent thermal stability of LFP earns preference among utility buyers.
Restraints Impact Analysis*
| Restraint | (~) % Impact on CAGR Forecast | Geographic Relevance | Impact Timeline |
|---|---|---|---|
| Critical-mineral supply constraints | -2.8% | Global, with acute pressure on lithium, cobalt, and nickel supply chains | Medium term (2-4 years) |
| Safety / thermal-runaway incidents | -1.6% | Global, with heightened scrutiny in North America and Europe | Short term (≤ 2 years) |
| End-of-life compliance cost escalation | -1.3% | Europe and North America, emerging in APAC | Long term (≥ 4 years) |
| Capital diversion to alternative storage tech | -0.9% | North America and Europe, niche deployments in APAC | Long term (≥ 4 years) |
| Source: Mordor Intelligence | |||
Critical-Mineral Supply Constraints
Battery-grade lithium demand hit 620,000 tons LCE in 2024 and could double by 2030, yet new mine approvals lag by almost two years. Cobalt remains concentrated in the Democratic Republic of Congo, where artisanal output adds ESG risk that forces automakers to audit sub-tier suppliers. Nickel sulfate prices spiked to USD 22,000 per ton in early 2024 on Indonesian supply questions and carbon-intensity scrutiny, complicating long-term contract pricing. Recycling may cover just 10-12% of cathode metal demand by 2030 because hydrometallurgical recovery still loses around 10% of lithium.
Safety and Thermal-Runaway Incidents
There were 38 recorded lithium-ion fires in stationary storage sites in 2024, prompting revisions to NFPA 855 that mandate gas detection and aerosol suppression in enclosures larger than 50 kWh.[3]National Fire Protection Association, “NFPA 855 2025 Edition,” nfpa.org Insurance underwriters now require UL 9540A test data, adding up to USD 100,000 to project certification. Thermal runaway typically initiates near 150 °C in NMC cells, but the reaction cascades quickly in tightly packed modules. LFP’s higher onset temperature of 270 °C is driving its adoption for stationary use. Compliance costs and reputational risk together slow deployments until improved battery management systems become standard.
*Our forecasts treat driver/restraint impacts as directional, not additive. The impact forecasts reflect baseline growth, mix effects, and variable interactions.
Segment Analysis
By Technology: Solid-State Pilots Challenge Li-ion Hegemony
Lithium-ion held 74.8% of the secondary battery market share in 2025. However, solid-state variants are forecast to post a 24.9% CAGR to 2031 as Toyota, Samsung SDI, and QuantumScape scale pilot lines. The solid-state architecture replaces liquid electrolytes with ceramic separators, enabling lithium-metal anodes that double energy density to 400-500 Wh/kg. Toyota reported 1,200 cycles at 80% retention for its sulfide-based cell and plans 10,000 units annually by 2027. QuantumScape's oxide separator passed 800 cycles with less than 10% fade, securing Volkswagen's supply for 2028 platforms.
Commercial viability hinges on manufacturing yield and raw-material availability, especially for sulfide powders. Incumbent suppliers hedge risk by licensing solid-state IP while continuing to expand conventional lines. Lead-acid batteries still serve forklifts and telecom sites because of low upfront cost, yet their share slips each year. Flow batteries grow at a 19% CAGR for multi-hour grid storage, though their contribution to the secondary battery market size remains under 1% due to high capital cost.


By Form Factor: Pouch Cells Gain Ground in Premium EVs
Cylindrical formats led the secondary battery market in 2025 with 53.5% share, underpinned by Tesla’s 4680 and ubiquitous 2170 cells. Yet pouch cells are forecast to expand at 22.2% CAGR through 2031 as automakers seek thinner packs that maximize cabin space. General Motors uses LG-made pouch cells in its Ultium platform, stacking layers vertically to deliver 200 kWh per pack. Hyundai’s E-GMP also favors pouch designs, which dissipate heat more evenly under 350 kW fast charging.
Manufacturing dynamics differ by region. Chinese producers lean toward prismatic cells for automation gains, European startups trial large-format pouches for premium EVs, and U.S. players balance cylindrical and pouch output to meet IRA domestic-content thresholds. The form-factor battle, therefore, reflects strategic positioning rather than one-size-fits-all design.
By Application: Stationary Storage Narrows Gap with EVs
Electric vehicles controlled 48.1% of demand in 2025 thanks to strong adoption in China, Europe, and California. Stationary storage, however, is projected to grow at 23.5% CAGR, closing in on mobility volumes by decade-end. California’s 11.5 GW mandate and Texas’s 10 GW pipeline have validated four-hour lithium-ion systems as peaker plant substitutes. The U.S. Energy Information Administration calculates that batteries undercut gas turbines on a cost-per-start basis for projects below 100 MW.
Residential storage adoption climbs at 28% CAGR in markets with high retail electricity prices and time-of-use tariffs, although it still represents under 10% of stationary value. Industrial motive power transitions from lead-acid to lithium-ion because fast charging eliminates downtime. Consumer electronics demand matures at single-digit growth, but power tools and e-mobility devices keep niche volumes steady.
By End-User Industry: Utilities Emerge as Growth Engine
Automotive buyers accounted for 50.6% of the secondary battery market size in 2025, including cars, light trucks, and buses. Most leading OEMs are building or co-owning cell plants to secure supply and capture value from battery management software. Utilities and power producers, though smaller in absolute revenue, will deliver a 22.8% CAGR through 2031. Revised market rules in PJM and ERCOT now pay four-hour batteries the same capacity credits as gas turbines, encouraging multi-gigawatt procurement.
Electronics and IT companies maintain about one-fifth of demand, tied to two-year upgrade cycles. Logistics operators electrify forklifts to improve uptime, illustrated by Amazon’s 15,000 lithium-ion units in North American warehouses. Aerospace, defense, and healthcare remain specialized niches that require extreme temperature tolerance or stringent regulatory compliance.
Geography Analysis
Asia-Pacific dominated the secondary battery market with a 49.7% share in 2025 and is forecast to expand at a 20.1% CAGR. China’s 1,200 GWh of cell capacity delivers up to 20% cost advantages through full vertical integration. South Korean suppliers focus on high-nickel chemistries that command price premiums in premium EV segments. Japan’s Panasonic has seen its share slide to 18% as Chinese rivals undercut on price, yet it retains a strong foothold with Tesla.
North America is undergoing rapid supply-chain reshoring under the Inflation Reduction Act. Manufacturing tax credits of USD 35 per kWh have triggered USD 73 billion in announced investments, lifting planned capacity to 550 GWh by 2030. General Motors, Ford, and Stellantis all co-locate cell plants with vehicle assembly lines to minimize logistics costs. Canada is positioning itself as a raw-material hub, and Mexico is securing cost-sensitive assembly contracts, though labor shortages and permitting delays remain constraints.
Europe held just under one-quarter of global demand in 2025, driven by its 2035 internal-combustion ban and strict carbon-footprint rules. Northvolt’s Swedish facility satisfies premium OEM needs with cells below 60 kg CO2 per kWh. Germany operates a complete ecosystem, from BASF cathode materials to Volkswagen’s PowerCo cell lines.[4]Volkswagen AG, “PowerCo Strategy 2024,” volkswagen-newsroom.com Southern and Eastern Europe attract new gigafactories because of lower labor costs and EU structural funds. South America’s lithium triangle offers long-term resource security, but water scarcity and political risk slow expansion. The Middle East and Africa remain nascent, accounting for only a low single-digit share.

Competitive Landscape
The five largest suppliers, CATL, LG Energy Solution, BYD, Panasonic, and Samsung SDI, controlled 68% of global cell capacity in 2024, giving the secondary battery market a moderately concentrated structure. CATL differentiates through chemistry diversity, offering LFP, NMC, and sodium-ion products. Its Qilin pack integrates cooling plates into cell walls, improving density by 13%. BYD captures value from mine to pack, sustaining gross margins near 20%. LG Energy Solution and Samsung SDI face tighter margins as automakers push for cost reductions, leading both to co-invest in regional plants that qualify for local incentives.
Emerging players target chemistry and format niches. SVOLT’s cobalt-free NMX cathodes cut material cost by as much as USD 20 per kWh while maintaining 240 Wh/kg density. Form Energy is advancing iron-air batteries for 100-hour discharge durations that could undercut gas peakers in high-renewable grids. Patent activity is shifting to solid-state electrolytes, with Toyota holding 28% of sulfide-based filings and Samsung SDI leading in oxide ceramics. Compliance with IEC 62619 and UL 1973 standards now influences procurement decisions, as insurers and grid operators require certified products for systems above 1 MWh.
Gigafactory localization introduces new regional competitors. Reliance Industries and Ola Electric are building 50 GWh of capacity in India under production-linked incentives. Indonesia is integrating nickel refining with cell assembly to leverage its resource base. In the United States, unionized labor negotiations and energy-price volatility influence plant siting, while Europe ties financing to strict carbon-footprint audits that favor renewable-powered facilities.
Secondary Battery Industry Leaders
-
CATL
-
BYD Co. Ltd
-
LG Energy Solution
-
Panasonic Holdings
-
Samsung SDI
- *Disclaimer: Major Players sorted in no particular order

Recent Industry Developments
- January 2026: ASET, a specialist in next-generation secondary battery materials, inked its second technology transfer deal with the Korea Institute of Energy Research. The agreement focuses on core technologies pivotal to lithium metal batteries, marking a significant step for ASET in the evolving landscape of secondary battery innovations.
- January 2026: SK On and SK Innovation revealed their expanded collaboration in the vanadium ion battery (VIB) sector, aiming to pioneer next-generation energy storage systems (ESS) with improved fire safety. They inked a memorandum of understanding (MOU) with Standard Energy, a domestic specialist in VIB-based ESS technologies.
- November 2025: Sumitomo Chemical is restructuring its PERVIO business for lithium-ion secondary battery separators. The company will cease production at its Ohe Works facility in Niihama, Japan, and consolidate manufacturing at SSLM Co., Ltd., its subsidiary in Daegu, South Korea, which offers higher capacity and productivity.
- April 2025: CATL introduced three pioneering EV battery products: The Freevoy Dual-Power Battery, Naxtra - the globe's first mass-produced sodium-ion battery, and the next-gen Shenxing Superfast Charging Battery. Additionally, they showcased an integrated 24V start/stop Naxtra battery tailored for heavy-duty trucks.


Global Secondary Battery Market Report Scope
The secondary battery or storage battery is a cell or combination of cells in which the cell reactions are reversible. This means that the original chemical conditions within the cell can be restored by passing current to flow into it, i.e., by charging from an external source.
The global secondary battery market is segmented by technology, form factor, application, end-user industry, and geography. By technology, the market is segmented into lead-acid, lithium-ion, nickel-metal hydride, nickel-cadmium, flow batteries, and solid-state. By form factor, the market is segmented into cylindrical, prismatic, and pouch. By application, the market is segmented into electric vehicles, stationary energy storage, industrial motive power, consumer electronics, and power tools. By end-user industry, the market is segmented into automotive, utilities and power, electronics and IT, logistics, aerospace, and healthcare. The report also covers the market size and forecasts for the secondary battery market across major regions. For each segment, the market sizing and forecasts have been done based on revenue (USD billion).
| Lead-acid |
| Lithium-ion |
| Nickel-metal Hydride |
| Nickel-cadmium |
| Flow Batteries |
| Solid-state (pre-commercial) |
| Cylindrical |
| Prismatic |
| Pouch |
| Electric Vehicles |
| Stationary Energy Storage |
| Industrial Motive Power |
| Consumer Electronics |
| Power Tools and Others |
| Automotive |
| Utilities and Power |
| Electronics and IT |
| Logistics and Warehousing |
| Aerospace and Defense |
| Healthcare and Others |
| North America | United States |
| Canada | |
| Mexico | |
| Europe | United Kingdom |
| Germany | |
| France | |
| Spain | |
| NORDIC Countries | |
| Russia | |
| Rest of Europe | |
| Asia-Pacific | China |
| India | |
| Japan | |
| South Korea | |
| ASEAN Countries | |
| Australia and New Zealand | |
| Rest of Asia-Pacific | |
| South America | Brazil |
| Argentina | |
| Colombia | |
| Rest of South America | |
| Middle East and Africa | Saudi Arabia |
| United Arab Emirates | |
| South Africa | |
| Egypt | |
| Rest of Middle East and Africa |
| By Technology | Lead-acid | |
| Lithium-ion | ||
| Nickel-metal Hydride | ||
| Nickel-cadmium | ||
| Flow Batteries | ||
| Solid-state (pre-commercial) | ||
| By Form Factor | Cylindrical | |
| Prismatic | ||
| Pouch | ||
| By Application | Electric Vehicles | |
| Stationary Energy Storage | ||
| Industrial Motive Power | ||
| Consumer Electronics | ||
| Power Tools and Others | ||
| By End-user Industry | Automotive | |
| Utilities and Power | ||
| Electronics and IT | ||
| Logistics and Warehousing | ||
| Aerospace and Defense | ||
| Healthcare and Others | ||
| By Geography | North America | United States |
| Canada | ||
| Mexico | ||
| Europe | United Kingdom | |
| Germany | ||
| France | ||
| Spain | ||
| NORDIC Countries | ||
| Russia | ||
| Rest of Europe | ||
| Asia-Pacific | China | |
| India | ||
| Japan | ||
| South Korea | ||
| ASEAN Countries | ||
| Australia and New Zealand | ||
| Rest of Asia-Pacific | ||
| South America | Brazil | |
| Argentina | ||
| Colombia | ||
| Rest of South America | ||
| Middle East and Africa | Saudi Arabia | |
| United Arab Emirates | ||
| South Africa | ||
| Egypt | ||
| Rest of Middle East and Africa | ||


Key Questions Answered in the Report
What is the projected value of the secondary battery market by 2031?
It is forecast to reach USD 437.79 billion, expanding at an 18.31% CAGR based on 2026-2031 projections.
Which technology is expected to grow fastest within secondary batteries?
Solid-state batteries are projected to post a 24.9% CAGR between 2026 and 2031 as pilot lines scale toward commercial output.
Why are pouch cells gaining popularity in electric vehicles?
Pouch formats allow thinner pack designs and superior heat dissipation, helping automakers fit higher capacities within the same chassis volume.
How are policy incentives reshaping battery production in North America?
The Inflation Reduction Act offers USD 35 per kWh manufacturing credits and domestic-content rules, triggering USD 73 billion in announced cell-plant investments.
Which end-user segment shows the fastest growth through 2031?
Utilities and power producers lead with a 22.8% CAGR as grid operators procure four-hour battery systems for capacity and ancillary services.
What chemistry is gaining traction for cost-sensitive EV segments?
Lithium iron phosphate (LFP) is expanding quickly due to its lower cost, robust safety profile, and reduced reliance on cobalt and nickel.
Page last updated on:


