Recreational Vehicle Parks And Campgrounds Market Size and Share
Market Overview
| Study Period | 2021 - 2031 |
|---|---|
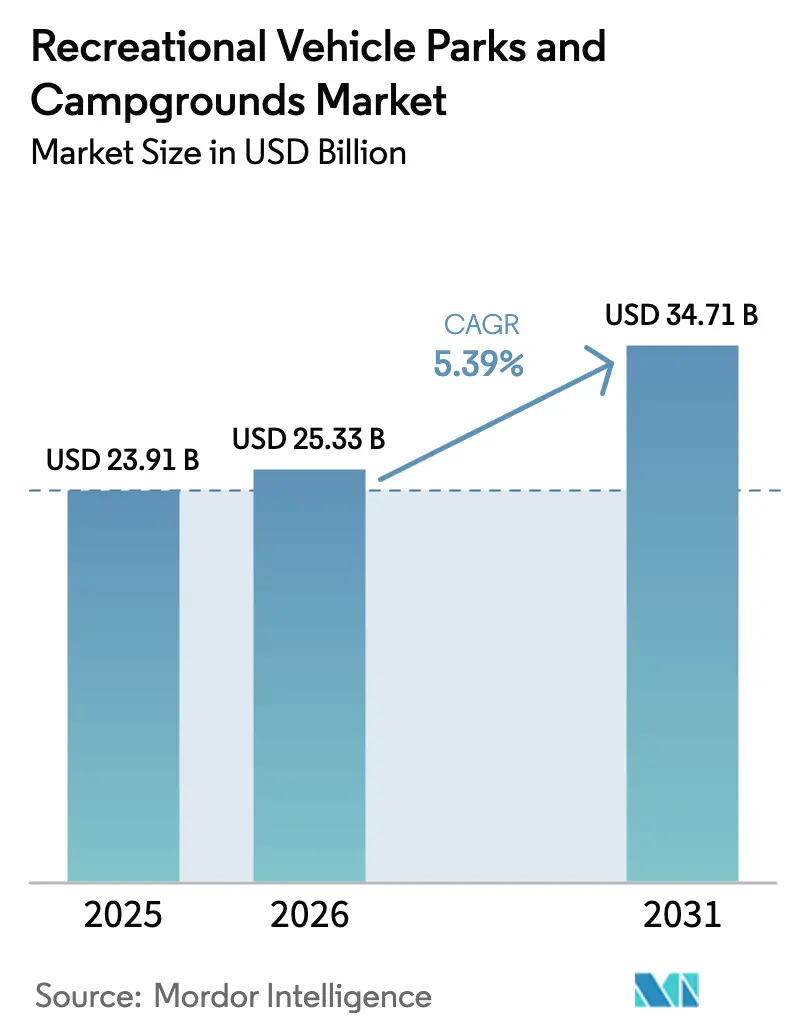
| Market Size (2026) | USD 25.33 Billion |
| Market Size (2031) | USD 34.71 Billion |
| Growth Rate (2025 - 2031) | 5.39% CAGR |
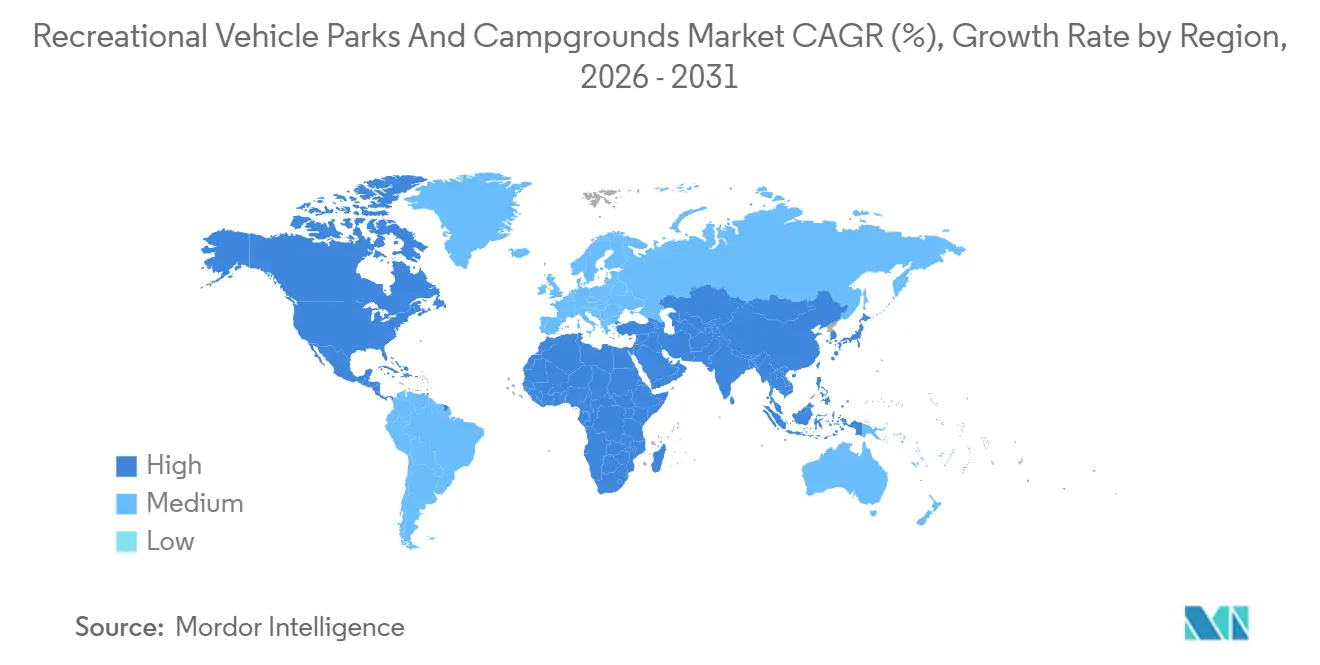
| Fastest Growing Market | Asia-Pacific |
| Largest Market | North America |
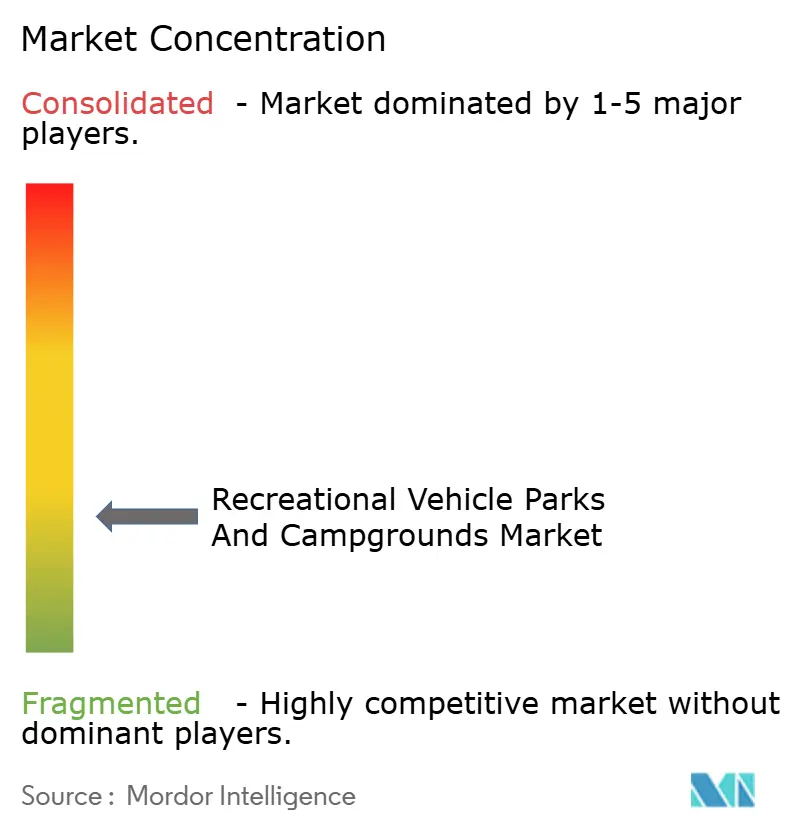
| Market Concentration | Low |
Major Players *Disclaimer: Major Players sorted in no particular order Image © Mordor Intelligence. Reuse requires attribution under CC BY 4.0. | |
Recreational Vehicle Parks And Campgrounds Market Analysis by Mordor Intelligence
The Recreational Vehicle Parks And Campgrounds Market size is expected to grow from USD 23.91 billion in 2025 to USD 25.33 billion in 2026 and is forecast to reach USD 34.71 billion by 2031 at 5.39% CAGR over 2026-2031.
The growth is being driven by shifting consumer preferences, particularly among younger travelers and first-time RV renters, who are demanding enhanced connectivity, electric vehicle (EV) readiness, and flexible accommodation options. These evolving expectations are prompting operators to invest in site upgrades, modern amenities, and digital infrastructure across key regions. The rise of platform-driven RV rentals is further expanding market access, directing additional occupancy toward private parks and increasing overall utilization. Investments in upgraded utilities and fiber-backed broadband are increasingly considered essential infrastructure rather than optional amenities, reflecting the market’s response to changing customer priorities. Additionally, disaster recovery programs are supporting longer stays in affected areas, helping to stabilize occupancy levels and revenue throughout the year, particularly for operators capable of accommodating multi-month residents.
Key Report Takeaways
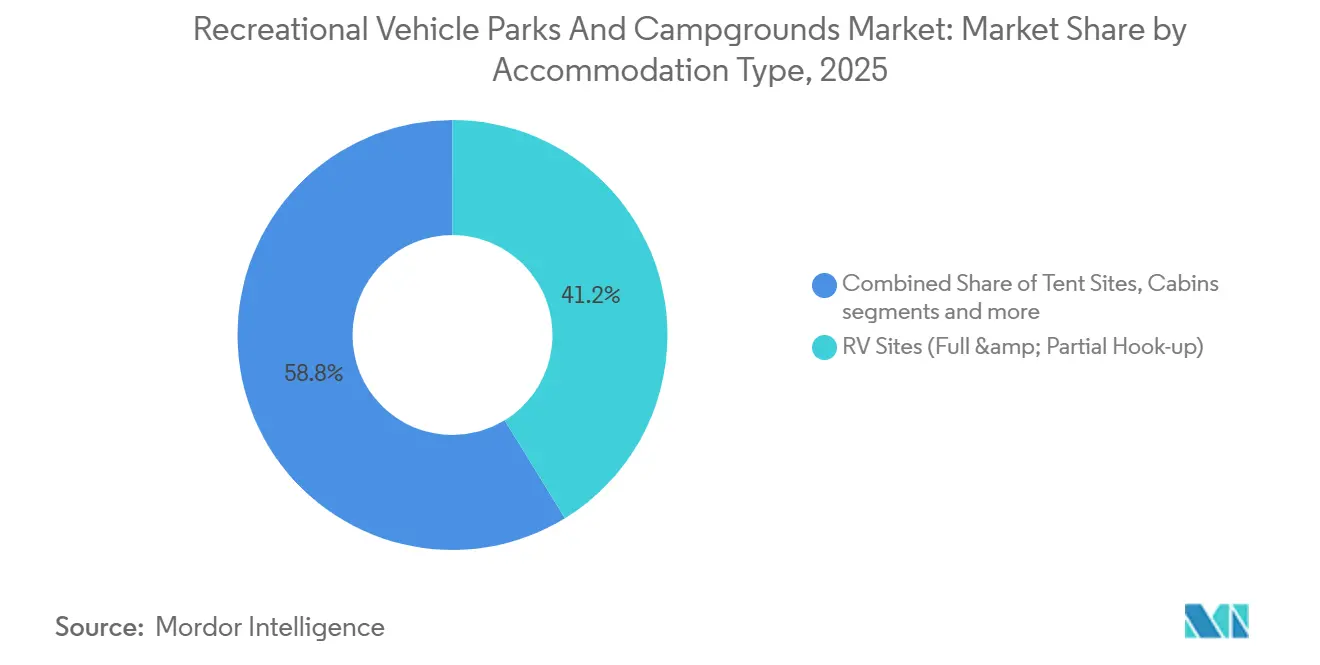
- By accommodation type, RV sites accounted for 41.23% of the recreational vehicle parks and campgrounds market share in 2025, and glamping units are projected to expand at a 7.15% CAGR through 2031.
- By visitor type, couples represented 26.63% of the recreational vehicle parks and campgrounds market share in 2025, while families are projected to grow at a 7.88% CAGR through 2031.
- By payment method, Membership Programs held 38.25% of the recreational vehicle parks and campgrounds market share in 2025, while online booking is forecast to expand at a 6.52% CAGR through 2031.
- By ownership, private parks held 63.31% of the recreational vehicle parks and campgrounds market share in 2025 and are forecast to expand at a 7.01% CAGR through 2031.
- By geography, North America retained 54.46% of the recreational vehicle parks and campgrounds market share in 2025, and Asia-Pacific is projected to grow at an 8.35% CAGR through 2031.
Note: Market size and forecast figures in this report are generated using Mordor Intelligence’s proprietary estimation framework, updated with the latest available data and insights as of January 2026.
Global Recreational Vehicle Parks And Campgrounds Market Trends and Insights
Drivers Impact Analysis*
| Driver | (~) % Impact on CAGR Forecast | Geographic Relevance | Impact Timeline |
|---|---|---|---|
| RV ownership boom among Gen Z & Millennials | +1.2% | Global, with early gains in North America, Western Europe, and urban Asia-Pacific | Medium term (2-4 years) |
| Peer-to-peer RV rentals are enlarging the visitor base | +0.9% | Global, led by North America and Oceania, with spillover in Western Europe and Asia-Pacific | Medium term (2-4 years) |
| 50-amp full-hookup infrastructure upgrades | +0.7% | North America core, Western Europe, and select Asia-Pacific markets | Short term (≤ 2 years) |
| Insurance-funded long-term stays post-disaster | +0.5% | Regional, concentrated in disaster-prone zones | Short term (≤ 2 years) |
| Corporate "outdoor-hospitality" retreats | +0.4% | North America and Western Europe, with pilot activity in the Asia-Pacific | Long term (≥ 4 years) |
| Increasing demand for high-speed broadband and EV charging | +0.6% | Global, with early adoption in North America, Western Europe, and urban Asia-Pacific | Medium term (2-4 years) |
| Source: Mordor Intelligence | |||
RV Ownership Boom Among Gen Z & Millennials
The recreational vehicle (RV) market is undergoing a significant generational shift, with Millennials and Gen Z driving growth in ownership and fueling demand for RV parks and campgrounds worldwide. The RV Industry Association reports that the median age of RV owners has dropped from 53 in 2021 to 49 in 2025, while 22% of owners are aged 18–34 and 36% are first-time buyers, highlighting strong adoption among younger demographics. Owners under 55 now account for 51% of the total market, and nearly 84% of younger owners plan to purchase another RV in the next five years, signaling long-term engagement[1]RV Industry Association, “Industry Profile 2024,” RV Industry Association rvia.org.. This younger, digitally connected cohort prioritizes flexible, experience-driven travel and increasingly integrates remote work into RV lifestyles, creating higher expectations for reliable high-speed internet (≥25 Mbps) and robust shore power infrastructure (30A or 50A). Digital-first discovery and planning are standard, with rentals and peer-to-peer platforms driving trial and repeat visits. In response, RV parks and campgrounds are upgrading fiber-backed WiFi, EV-ready pedestals, and offering “digital nomad” packages to extend stays and improve weekday occupancy. Collectively, these trends are expanding the addressable market, driving capital investment in amenities, and positioning RV parks and campgrounds to benefit from sustained growth in younger RV ownership globally.
Peer-to-peer RV rentals are enlarging the visitor base
Platform growth is broadening access and redirecting incremental nights to parks in the recreational vehicle parks and campgrounds market. By September 2024, Outdoorsy surpassed USD 3 billion in lifetime bookings and projects growth to USD 8 billion by 2029, reflecting strong and sustained demand for owner-supplied RVs and delivery-enabled rentals that reduce towing barriers. Operating across 11 countries and 4,800 cities, the company is expanding into Europe while investing in its insurance and rental marketplace and broader outdoor travel services[2]Outdoorsy Group, “Outdoorsy Exceeds $3B in Sales, Plans European Expansion,” PR Newswire, www.prnewswire.com. The surge in peer-to-peer rentals is introducing RV travel to a wider demographic, including first-time users and younger consumers, who may not yet own vehicles but seek flexible, short-term experiences. This trend is driving higher utilization of private parks and campgrounds, especially during off-peak periods, smoothing seasonal occupancy and boosting revenue for operators. Additionally, technology-driven platforms provide transparent booking, insurance coverage, and user reviews, increasing confidence among renters and encouraging repeat usage. The growing integration of delivery services, mobile apps, and dynamic pricing models further lowers barriers to entry, making RV travel more convenient and accessible globally.
Insurance-Funded Long-Term Stays Post-Disaster: FEMA TTHUs and Private Adjusters Stabilize Off-Season Occupancy
Climate events are converting select parks into temporary housing nodes that support longer stays and predictable payment streams in the recreational vehicle parks and campgrounds market. FEMA approved 536 households for placement in commercial RV parks in late 2024 through its Temporary Transportable Housing Units program, with caps that cover defined assistance categories and enable multi-month occupancy[3]Federal Emergency Management Agency, “Individual Assistance Programs,” Federal Emergency Management Agency, fema.gov.. Private carriers manage pre-approved park networks for policyholder placement, which can yield 90–180-day bookings at negotiated monthly rates for families displaced by fires, floods, or hurricanes. California’s January 2025 wildfires created a surge of temporary housing placements near urban parks and extended the duration of stays due to rebuild timelines and insurance processes. Operators benefit from direct-billed structures, reduced vacancy during shoulder seasons, and ancillary revenue from extended-stay services such as laundry, propane, and package handling. The outcome is more stable occupancy patterns for parks positioned to serve emergency housing flows within the recreational vehicle parks and campgrounds market.
Corporate "Outdoor-Hospitality" Retreats: Fortune 500s Shift Team-Building Budgets to Experiential Venues
Companies are shifting a portion of team-building budgets to outdoor venues that combine WiFi-enabled meeting pavilions with curated activities, which opens a premium group-use channel for the recreational vehicle parks and campgrounds market. Retreat programs that deliver multi-day agendas with on-site catering and guided recreation address 2025 priorities to rebuild an in-person culture after remote work adoption. The cost profile compares favorably to coastal hotels, which supports off-peak utilization and mid-week bookings for destination parks with cabins and flexible group sites[4]Society for Human Resource Management (SHRM), “SHRM Website,” SHRM, www.shrm.org. Operators are also piloting “workation” residencies where remote teams occupy adjacent cabins or RV sites for month-long periods, blending productivity and wellness under a consistent service model. While corporate nights remain a small share of total stays, early pipelines show long lead times that improve forward visibility in the recreational vehicle parks and campgrounds market.
Restraints Impact Analysis*
| Restraint | (~) % Impact on CAGR Forecast | Geographic Relevance | Impact Timeline |
|---|---|---|---|
| Zoning & land-use hurdles for new parks | -0.8% | National, with acute friction in North America, Western Europe, and urbanizing Asia-Pacific fringes | Medium term (2-4 years) |
| High cap-ex for utility/broadband upgrades | -0.6% | Global, with pressure points in rural North America, parts of Europe, and remote Asia-Pacific | Medium term (2-4 years) |
| Grid-demand fees for EV chargers | -0.3% | Regional, concentrated in deregulated electricity markets across North America, Western Europe, and pilot Asia-Pacific | Long term (≥ 4 years) |
| Seasonal demand volatility | -0.5% | Global, particularly in temperate regions of North America, Europe, and parts of the Asia-Pacific | Medium term (2-4 years) |
| Source: Mordor Intelligence | |||
Zoning & Land-Use Hurdles: Rezoning Timelines and Environmental Compliance Add Multiple Years to New Development
Local approvals for new parks often trigger long timelines due to public hearings, conditional-use processes, and utility impact reviews, which slow capacity expansion in the recreational vehicle parks and campgrounds market. Developers face permitting costs that escalate when projects require environmental studies for stormwater management, floodplain verification, or wetland delineation under federal and state rules. Policy tightening in select counties requires centralized water and sewer connections for new parks, which raises upfront infrastructure spend and restricts rural greenfield options without municipal utility access. Traffic and setback standards near residential zones further reduce feasible densities and usable acreage on constrained sites, which lifts per-site capital intensity. These conditions raise the value of conversion opportunities with compatible zoning and existing utilities for the recreational vehicle parks and campgrounds market.
High Cap-Ex for Utility/Broadband Upgrades: Fiber and EV Infrastructure Lift Per-Site Investment Above Historic Levels
Modernization cycles require layered utility commitments because guests expect reliable 50A service, water and sewer hookups, and high-throughput WiFi at scale within the recreational vehicle parks and campgrounds market. Broadband deployments and managed WiFi systems push park-level costs into the tens of thousands of dollars, which can delay upgrades at smaller independents without access to low-cost capital. Level 2 charger installations add to the electrical plan, and a pre-wiring approach at a share of sites can lower future cost when demand from plug-in vehicles rises. Construction financing tightened as benchmark rates moved higher in 2024, which extended break-even horizons and demanded more conservative projections for occupancy and ADR. Federal programs such as USDA ReConnect offer grants and low-interest loans to offset rural broadband investment, though administrative requirements and matching-fund thresholds can limit participation in the recreational vehicle parks and campgrounds market.
*Our forecasts treat driver/restraint impacts as directional, not additive. The impact forecasts reflect baseline growth, mix effects, and variable interactions.
Segment Analysis
By Accommodation Type: Glamping and Cabins Capture Aspirational Spend While RV Sites Anchor Baseload Revenue
RV sites commanded 41.23% of 2025 accommodation-type revenue and remain the anchor inventory for high-occupancy parks within the recreational vehicle parks and campgrounds market. Glamping units are expanding at a 7.15% CAGR through 2031 as guests seek experience-led stays and design-forward spaces at price points below boutique hotels but above primitive sites. Full-hookup pull-throughs with 50A pedestals and proximity to core amenities support higher ADRs and have become a baseline expectation among Class A and large towable owners. Operators use cabins and premium tent platforms to diversify the mix, which attracts non-RV households and broadens demand beyond the owner community in the recreational vehicle parks and campgrounds market. Curated amenities such as fire pits, climate control, and private outdoor areas allow parks to push rates without a proportional jump in service costs when layouts are standardized.
First-time campers now sample turn-key lodging before committing to tents or RVs, and urban households lead that trend due to convenience and social discovery effects. Parks configure glamping clusters near shared bathhouses and social hubs, which support group travel and event packages that fill mid-week calendars. Sustainability features are increasingly visible in marketing because guests react positively to energy efficiency, water conservation, and recycled materials. These upgrades align with ISO 21401 themes that emphasize sustainable management at tourism facilities, which strengthens brand positioning for premium units. The recreational vehicle parks and campgrounds industry continues to set design templates that balance aesthetic appeal, service consistency, and capital discipline across property types.


By Visitor Type: Families Accelerate as School-Age Children Return to Structured Travel
Couples represented 26.63% of visits in 2025 and remain a core base that values quiet settings, scenic access, and consistent standards across branded networks in the recreational vehicle parks and campgrounds market. Families are the fastest-growing cohort with a projected 7.88% CAGR through 2031 as households re-center summer travel and short breaks around amenity-rich outdoor stays. Properties with pools, playgrounds, and organized activities convert that demand into repeat visits across school breaks and long weekends, which elevates length of stay and weekday use. Themed concepts and family brands concentrate amenity density and ancillary revenue from retail, food, and paid activities while maintaining predictable service. The recreational vehicle parks and campgrounds market benefits when branded networks use loyalty, content, and distribution to attract younger parents who expect mobile-first booking and on-site convenience.
Hybrid and online schooling models add flexibility for travel windows, which helps families shift some trips into shoulder seasons and off-peak weekdays. Financial confidence has improved for a large share of households compared to pandemic lows, and packaged value through activity passes and bundled amenities drives bookings. Older couples balance the calendar by maintaining demand in shoulder seasons, especially in warmer regions that attract winter sunseekers. Group events for youth organizations and clubs fill weekend clusters at destination parks with adequate programming and meeting spaces. The recreational vehicle parks and campgrounds industry is aligning cabin clusters and flexible group sites to meet these patterns under clear standards and operating playbooks.
By Payment Method: Membership Programs Anchor Recurring Revenue Yet Online Booking Platforms Capture Transient Demand
Membership Programs held a 38.25% share in 2025, and online booking is projected to grow at a 6.52% CAGR through 2031 as marketplace reach and dynamic pricing tools become standard for operators within the recreational vehicle parks and campgrounds market. Platform search trends favored amenity-rich properties and new locations, which strengthened listing visibility for modernized parks with EV-ready sites and fiber-backed WiFi. Parks that sync availability and pricing across OTAs report steadier mid-week bookings and improved ADR during high-demand events when minimum-stay rules and fences are tuned. Operators also prioritize PCI-DSS compliance and modern gateways to improve payment security and check-in efficiency for online reservations. This maturity shifts online channels from experimentation to baseline distribution in the recreational vehicle parks and campgrounds market.
Membership programs continue to anchor recurring revenue and shoulder-season occupancy for many parks, and large networks such as Thousand Trails broaden coverage with zone passes and branded experiences. Loyalty layers well with online distribution because households use marketplaces to discover new parks, then optimize subsequent stays with membership benefits. Operators use segmented pricing strategies to balance member nights with transient demand to protect ADR and occupancy. Distribution strategies now blend direct reservations, membership redemptions, and OTA exposure under coherent rules for cancellations, change fees, and minimum-stay windows. The recreational vehicle parks and campgrounds industry is aligning revenue management and distribution choices to reflect how guests shop and pay across mobile and desktop channels.

By Ownership: Private Parks Leverage Capital Flexibility and Faster Permitting to Outpace Public Counterparts
Private parks held the dominant share of ownership with 63.31% in 2025 and are projected to grow at 7.01% through 2031 as flexible capital and faster permitting support quicker upgrades within the recreational vehicle parks and campgrounds market. Private operators can greenlight expansions within months, which enables timely responses to guest feedback on site mix, amenities, and connectivity. Ancillary revenue lines such as camp stores, propane, and paid activities add resilience compared with public parks that often cap fees to cover operating costs. REITs and large platforms continue to consolidate independents to capture procurement benefits, technology leverage, and distribution scale. Public parks hold irreplaceable locations at iconic destinations, but budget and preservation mandates slow utility and broadband upgrades within the recreational vehicle parks and campgrounds market.
Federal mandates now require broadband access at all National Park Service campgrounds within three years, which will begin to close a gap that many guests identify as a key factor in trip planning. Large private operators executed targeted acquisitions to rebalance portfolios toward fee-simple RV assets with room to expand and steady cash flows. Sun Communities’ sale of Safe Harbor Marinas in 2025 funded acquisitions of 3,605 sites in October 2025, showing ongoing conviction in the category’s durability. Equity Lifestyle Properties reported active acquisition and infill activity in Florida, California, and Arizona, which aligns with high-occupancy corridors and demographic tailwinds. These moves reinforce private parks’ ability to move faster on capex and service upgrades in the recreational vehicle parks and campgrounds market.
Geography Analysis
North America retained 54.46% of the recreational vehicle parks and campgrounds market share in 2025, supported by a large installed RV base, strong household participation, and steady site modernization through 2031. Operators continue to add full-hookup sites and cabin clusters in high-traffic corridors to support family travel and snowbird patterns while lifting mid-week use with robust WiFi for remote workers. EV readiness and fiber-backed broadband are a priority in the United States and Canada because guests filter searches by amenity reliability, which affects both occupancy and ADR during peak periods. Canada’s seasonality concentrates nights in late spring through early fall, which elevates the value of events and shoulder-season programming in provincial and private parks. The recreational vehicle parks and campgrounds market in North America continues to blend public-iconic access with private amenity density to sustain growth.
Asia-Pacific is the fastest-growing region with an 8.35% CAGR outlook through 2031, led by China’s campsite expansion and Japan’s record RV fleet that reached 165,000 units in 2024. China’s domestic tourism recovery and leisure upgrades, including a 2025 push for cultural tourism RV initiatives, are supporting site count increases in Tier 1 and New Tier 1 cities. Japan’s certified RV Park network expanded with new facilities in 2024, which improved overnight options and supported inbound rental demand amid favorable currency trends. Australia and New Zealand benefit from road-trip culture and platform liquidity, with Camplify’s FY2024 growth and BIG4’s network scale improving supply consistency and service. The recreational vehicle parks and campgrounds market in Asia-Pacific is advancing from a smaller base but is scaling rapidly under policy support, platform enablement, and household lifestyle shifts.
Europe shows steady growth from a mature base, supported by strong camping cultures in Germany and France and the continued professionalization of outdoor hospitality networks. Germany recorded record camping nights in 2024, and operators are aligning upgrades to connectivity and site quality as guest expectations shift alongside broader leisure trends. France stabilized after a long period of net campsite closures, and investment and consolidation strategies now focus on quality-tier differentiation that captures price-sensitive demand. Oceania continues to mature with national networks like BIG4 standardizing guest experience and adding new builds and reflags, which support itinerary planning for domestic and international travelers. The recreational vehicle parks and campgrounds market in the Middle East and Africa is developing destination-led projects and glamping concepts, while South America shows selective growth through scenic circuits and urban-adjacent offerings under platform discovery.

Competitive Landscape
The recreational vehicle parks and campgrounds market remains highly fragmented, with leading operators holding a small share of the total footprint. This fragmentation leaves ample opportunity for consolidation and professionalization through platform-based management. Many independent operators run smaller sites and lack modern property systems, creating scope for technology upgrades and brand affiliations that enhance guest experience. Franchisors capitalize on brand recognition and operational standards while deferring capital expenditures to site owners, enabling scalable growth without significant balance-sheet strain. These structural characteristics support roll-up strategies as investors target under-managed assets to improve operational efficiency and revenue performance.
The recreational vehicle parks and campgrounds market has seen capital rotation toward core properties with strong cash flow potential. Leading operators focus on acquisitions, infill, and amenity expansion to drive occupancy and enhance the overall guest experience. Franchise networks continue to expand and standardize offerings, including cabins, recreational features, and family-friendly activities, which encourage longer stays and repeat visitation. These strategic moves emphasize experience density and operational effectiveness across scaled owner-operators. Market participants increasingly prioritize investments that combine property quality with operational efficiency to maximize returns.
The recreational vehicle parks and campgrounds market increasingly relies on technology and distribution platforms to manage revenue and attract guests. Acquisitions and integrations among marketplace providers expand supply and strengthen visibility among younger, digitally savvy travelers. Multi-channel listing platforms help operators maintain centralized availability and consistent rate management, reducing double-bookings and supporting off-peak occupancy. Compliance with data security and privacy standards is becoming essential as online bookings capture a growing share of transient demand. By combining site upgrades with technology adoption and brand standards, operators are able to deliver a consistent, high-quality experience at scale.
Recreational Vehicle Parks And Campgrounds Industry Leaders
Kampgrounds of America (KOA)
Sun Communities – Sun Outdoors
Equity Lifestyle Properties
Northgate Resorts
Blue Water Development
- *Disclaimer: Major Players sorted in no particular order

Recent Industry Developments
- December 2025: Ontario Energy Board introduced the EVC rate design that enables cost relief for commercial EV charging sites using approved load management, relevant to parks adding Level 2 stations and mitigation strategies for demand charges
- February 2025: Sun Communities announced the all‑cash sale of its Safe Harbor Marinas business to Blackstone Infrastructure for USD 5.65 billion, allowing the company to refocus on its core manufactured housing and RV segments and strengthen its balance sheet through de‑leveraging and enhanced financial flexibility.
- April 2025: Zapier launched an AI orchestration platform for enterprise customers, enabling integration, automation, and scaling of AI across thousands of connected apps.
- June 2025: Trigano acquired Albi Camping-Cars to strengthen its French distribution network and support a broader European consolidation strategy.


Global Recreational Vehicle Parks And Campgrounds Market Report Scope
The most typical use of recreational vehicles (RVs) while traveling is temporary lodging. But, because of advantages like easily towable units, low fuel consumption, lower maintenance and insurance expenses, and depreciation value, some people utilize them as their primary house. The Global Recreational Vehicle Parks and Campgrounds are segmented by vehicle type (Motorhomes (Class A, Class B, Class C, rockstar motorhomes)), trailers (5th wheel trailers, travel trailers, tent trailers, retro trailers), price (standard, luxury), end use (individuals, fleet owners), and geography (North America, Europe, Asia Pacific, Latin America, and the Middle East and Africa). In addition, the report offers market size and forecast for the global recreational vehicle parks and campgrounds market in value (USD billion) for all the above segments.
| Tent Sites |
| RV Sites (Full & Partial Hook-up) |
| Cabins |
| Glamping Units |
| Group Camps |
| Families |
| Couples |
| Solo Travelers |
| Groups |
| Senior Citizens |
| Online Booking |
| Walk-In |
| Membership Programs |
| Group Discounts |
| Public Parks |
| Private Parks |
| North America | Canada |
| United States | |
| Mexico | |
| South America | Brazil |
| Peru | |
| Chile | |
| Argentina | |
| Rest of South America | |
| Europe | United Kingdom |
| Germany | |
| France | |
| Spain | |
| Italy | |
| BENELUX (Belgium, Netherlands, Luxembourg) | |
| NORDICS (Denmark, Finland, Iceland, Norway, Sweden) | |
| Rest of Europe | |
| Asia-Pacific | India |
| China | |
| Japan | |
| Australia | |
| South Korea | |
| South East Asia (Singapore, Malaysia, Thailand, Indonesia, Vietnam, Philippines) | |
| Rest of Asia-Pacific | |
| Middle East and Africa | United Arab Emirates |
| Saudi Arabia | |
| South Africa | |
| Nigeria | |
| Rest of Middle East and Africa |
| Accommodation Type | Tent Sites | |
| RV Sites (Full & Partial Hook-up) | ||
| Cabins | ||
| Glamping Units | ||
| Group Camps | ||
| Visitor Type | Families | |
| Couples | ||
| Solo Travelers | ||
| Groups | ||
| Senior Citizens | ||
| Payment Method | Online Booking | |
| Walk-In | ||
| Membership Programs | ||
| Group Discounts | ||
| Ownership | Public Parks | |
| Private Parks | ||
| Geography | North America | Canada |
| United States | ||
| Mexico | ||
| South America | Brazil | |
| Peru | ||
| Chile | ||
| Argentina | ||
| Rest of South America | ||
| Europe | United Kingdom | |
| Germany | ||
| France | ||
| Spain | ||
| Italy | ||
| BENELUX (Belgium, Netherlands, Luxembourg) | ||
| NORDICS (Denmark, Finland, Iceland, Norway, Sweden) | ||
| Rest of Europe | ||
| Asia-Pacific | India | |
| China | ||
| Japan | ||
| Australia | ||
| South Korea | ||
| South East Asia (Singapore, Malaysia, Thailand, Indonesia, Vietnam, Philippines) | ||
| Rest of Asia-Pacific | ||
| Middle East and Africa | United Arab Emirates | |
| Saudi Arabia | ||
| South Africa | ||
| Nigeria | ||
| Rest of Middle East and Africa | ||


Key Questions Answered in the Report
What is the current size and growth outlook for the recreational vehicle parks and campgrounds market?
The recreational vehicle parks and campgrounds market size was USD 25.33 billion in 2026 and is projected to reach USD 34.71 billion by 2031 at a 5.39% CAGR during 2026-2031.
Which regions are leading demand in the recreational vehicle parks and campgrounds market?
North America held 54.46% in 2025, while Asia-Pacific is the fastest growing with an 8.35% CAGR projected through 2031.
What accommodation formats are growing fastest within the recreational vehicle parks and campgrounds market?
RV sites led with 41.23% revenue share in 2025, and glamping units show the fastest growth with a 7.15% CAGR through 2031.
How are platforms affecting bookings in the recreational vehicle parks and campgrounds market?
Membership Programs held a 38.25% share in 2025, and online booking is forecast to grow at a 6.52% CAGR as dynamic pricing and OTA integrations lift off-peak occupancy.
What infrastructure upgrades are most critical for operators?
50A full-hookup power, fiber-backed WiFi, and Level 2 EV chargers are core, supported by the EXPLORE Act’s broadband requirement for National Park Service campgrounds and USDA ReConnect funding.
Page last updated on:


