
Omnichannel Retail Market Size and Share
Market Overview
| Study Period | 2022 - 2031 |
|---|---|
| Market Size (2026) | USD 7.86 Trillion |
| Market Size (2031) | USD 11.31 Trillion |
| Growth Rate (2026 - 2031) | 7.55 % |
| Fastest Growing Market | Asia-Pacific |
| Largest Market | North America |
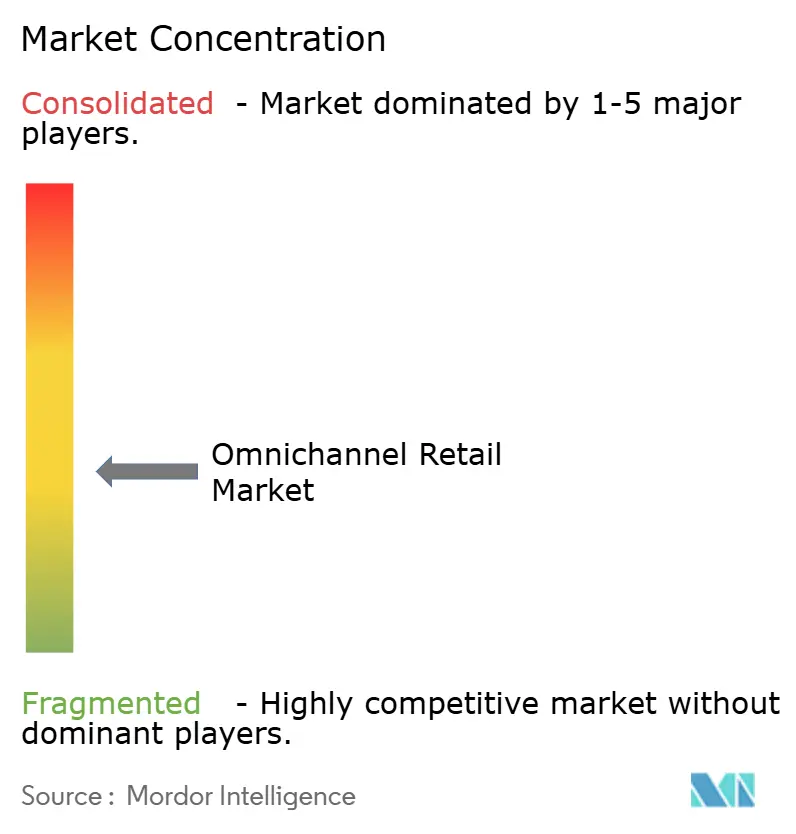
| Market Concentration | Medium |
Major Players *Disclaimer: Major Players sorted in no particular order Image © Mordor Intelligence. Reuse requires attribution under CC BY 4.0. | |
Omnichannel Retail Market Analysis by Mordor Intelligence
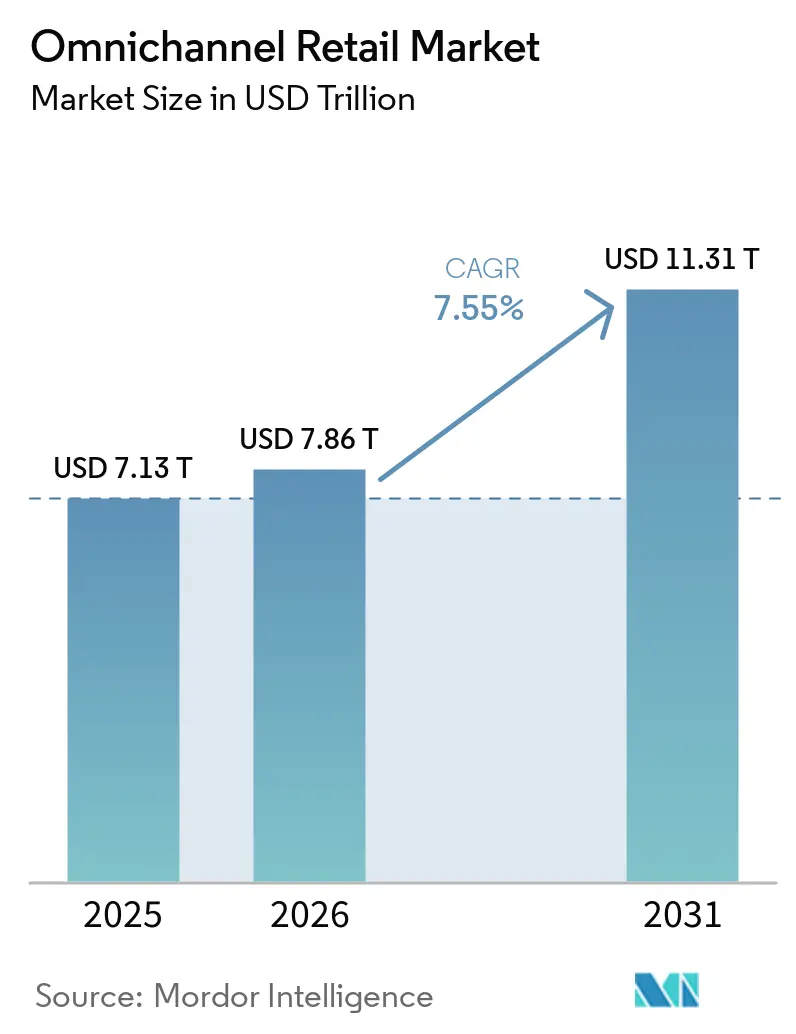
The Omnichannel Retail Market size is expected to increase from USD 7.13 trillion in 2025 to USD 7.86 trillion in 2026 and reach USD 11.31 trillion by 2031, growing at a CAGR of 7.55% over 2026-2031.
The retailers are treating unified commerce as a long-cycle operating investment rather than a short-lived digital response. Capital allocation is moving away from isolated website, store, or app improvements and toward shared inventory systems, unified customer identity, and fulfillment tools that work across every retail touchpoint. Customer expectations are increasingly centered one connected buying journey across stores, mobile, e-commerce, pickup, returns, and service, which is raising the importance of consistency across the retail technology stack. The omnichannel retail market is also being shaped by greater use of real-time inventory data, AI-led merchandising, and store-based fulfillment models that improve convenience and conversion rates. Competitive pressure is therefore shifting from simple online reach to execution quality across inventory accuracy, customer experience, and post-purchase operations.[1]
Key Report Takeaways
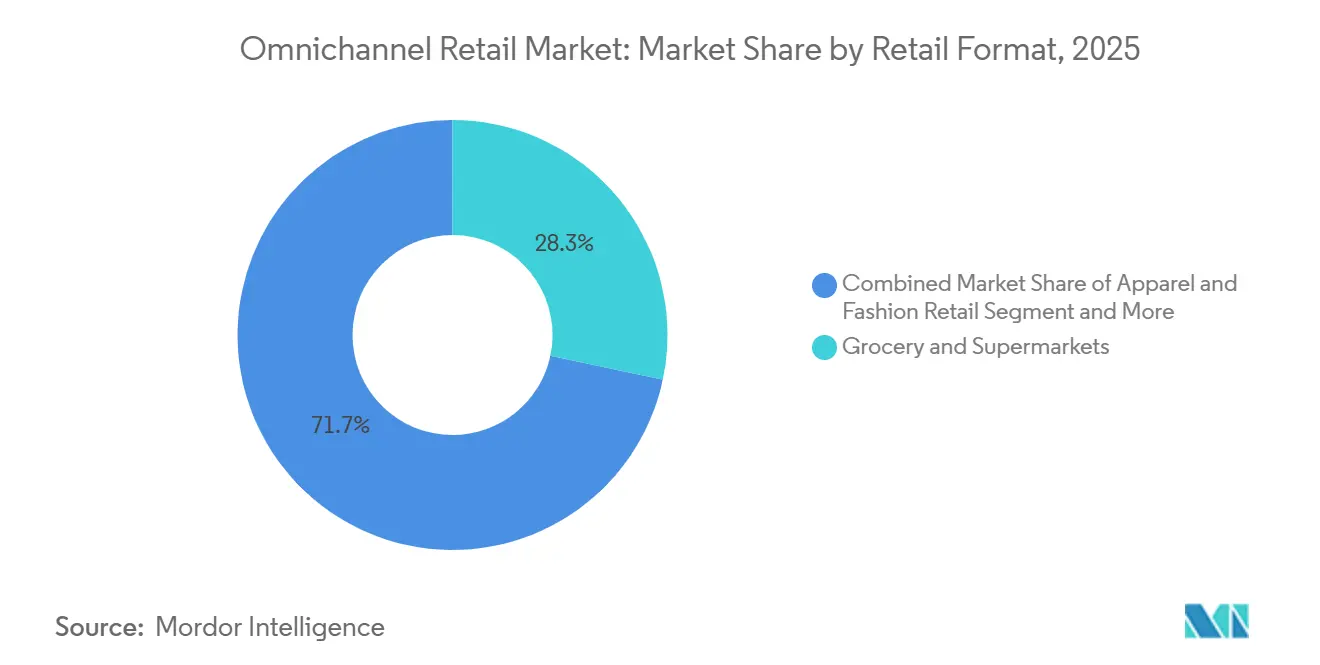
- By retail format, Grocery & Supermarkets held 28.32% of the global omnichannel retail market in 2025, while Health & Beauty Retail is forecast to expand at an 8.78% CAGR through 2031.
- By organization size, Large Enterprises held 66.24% of the global omnichannel retail market in 2025, while Small and Medium-Sized Enterprises are projected to record the highest CAGR at 9.13% through 2031.
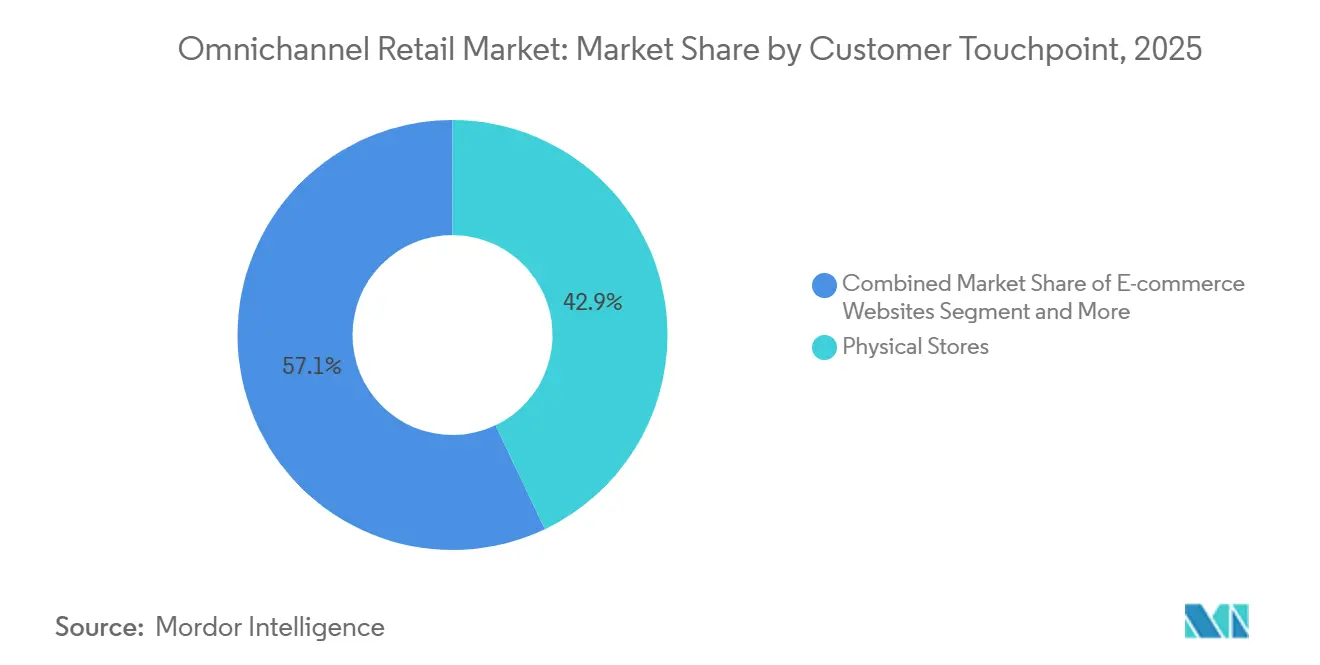
- By customer touchpoint, Physical Stores accounted for 42.93% of the global omnichannel retail market in 2025, while Social Commerce is advancing at a 9.45% CAGR through 2031.
- By geography, North America held 34.81% of the global omnichannel retail market in 2025, while Asia-Pacific is forecast to grow at a 9.96% CAGR through 2031.
Note: Market size and forecast figures in this report are generated using Mordor Intelligence’s proprietary estimation framework, updated with the latest available data and insights as of January 2026.
Global Omnichannel Retail Market Trends and Insights
Drivers Impact Analysis*
| Drivers | (~) % Impact on CAGR Forecast | Geographic Relevance | Impact Timeline |
|---|---|---|---|
| Accelerating Buy-Online, Pick-Up-In-Store Adoption | +1.8% | Global, led by North America & APAC | Short term (≤ 2 years) |
| Rising Demand For Real-Time Inventory Visibility | +1.2% | Global | Medium term (2-4 years) |
| Mobile-First Shopping and Social Commerce Expansion | +1.5% | APAC core, spill-over to North America & Europe | Short term (≤ 2 years) |
| Unified Commerce Orchestration Across Physical and Digital Channels | +1.0% | Global, led by North America & Europe | Medium term (2-4 years) |
| AI-Driven Personalization and Next-Best-Action Merchandising | +0.9% | Global, led by North America & APAC | Medium term (2-4 years) |
| Retail Media Monetization Requiring Cross-Channel Attribution | +0.6% | North America & Europe | Long term (≥ 4 years) |
| Source: Mordor Intelligence | |||
Accelerating BOPIS Adoption Is Redefining Store Productivity Economics
Buy online, pick up in store is becoming more important because stores are no longer serving only as walk-in sales points; they are now part of the fulfillment network for the omnichannel retail market. This shift is particularly visible in grocery, where more than 94% of shoppers in 2025 used both physical and digital channels and where e-commerce contributed close to 75% of total grocery dollar growth during the year Online food sales also increased almost 19% year over year in 2025, which shows that store pickup, last-mile coordination, and order visibility are becoming daily operating requirements rather than optional service features. As retailers scale pickup and return journeys, they also need stronger orchestration across physical and digital channels so that inventory, labor, and customer communication remain aligned in real time. The practical result is that BOPIS adoption is driving demand for better store systems, greater inventory accuracy, and improved order routing across the omnichannel retail market. Retailers that treat pickup as a connected operating model rather than a narrow fulfillment option are better positioned to capture repeat visits, better basket value, and stronger cross-channel conversion.
Rising Demand for Real-Time Inventory Visibility Is Transitioning from Advantage to Baseline
Real-time inventory visibility is moving from a competitive advantage to a baseline requirement because almost every important omnichannel decision now depends on accurate stock data. Aritzia’s partnership with Nedap’s iD Cloud RFID platform enabled item-level inventory visibility across in-store selling, ship-from-store fulfillment, and pickup workflows, demonstrating how inventory precision supports multiple retail functions simultaneously. Manhattan Associates stated that inventory allocation optimization tools can reduce out-of-stock occurrences by half and drive revenue increases of up to 5%, making the business case broader than simple replenishment improvement. Better inventory data also strengthens BOPIS reliability, distributed order management, cross-channel returns handling, and AI-led recommendations because each of those functions depends on trustworthy product availability signals. This is why the omnichannel retail market is increasingly rewarding retailers that build inventory accuracy early and connect it to order, store, and customer systems. Retailers that delay this infrastructure layer often find that later investments in personalization, marketplaces, and store fulfillment deliver weaker returns than expected.
Mobile-First Shopping and Social Commerce Are Reshaping the Discovery-to-Purchase Funnel
Mobile-led discovery and social commerce are changing where retail journeys begin and how fast they move toward conversion in the omnichannel retail market. Salesforce reported that 53% of consumers discovered products through social platforms in 2025, up from 46% in 2023, which confirms that product discovery is moving away from retailer-owned channels at a steady pace. The same report found that 76% of Gen Z used social media to find products in 2025. Gen Z shoppers were 10 times more likely than Baby Boomers to frequently use AI for product discovery. This change matters because mobile screens now carry browsing, content viewing, creator influence, price comparison, and checkout signals in the same session, which compresses the time between discovery and purchase. It also increases the need for cross-channel attribution, as retail media spending, social selling, and conversion analysis depend on understanding how traffic flows from social discovery to owned commerce environments. Retailers that can connect mobile behavior, social engagement, and final purchase data are likely to use marketing budgets more efficiently across the omnichannel retail market.
AI-Driven Personalization Is Shifting from Recommendation Engines to Next-Best-Action Systems
AI-driven personalization is moving beyond basic recommendation engines and toward systems that guide content, timing, channel choice, and fulfillment logic across the omnichannel retail market. Zalando reported that its foundational AI models delivered a 13% increase in items added to bags in 2025, while its Size & Fit AI reduced size-related returns by more than 8%, which shows a measurable impact on both conversion and cost control. Inditex deployed Zara Try-on across 43 markets and recorded more than 7 million sessions in FY2025, showing that virtual fit and visual qualification tools are becoming practical at scale rather than experimental add-ons. These developments also support next-best-action merchandising because retailers can respond to browsing signals, fit uncertainty, and content engagement with more tailored prompts during the session itself. The same data layer is increasingly valuable for retail media monetization, as advertisers increasingly want campaign delivery tied to observable product interest and conversion behavior. The omnichannel retail market is therefore seeing AI move closer to day-to-day commercial execution across assortment exposure, session management, return reduction, and media performance.
Restraints Impact Analysis*
| Restraints | (~) % Impact on CAGR Forecast | Geographic Relevance | Impact Timeline |
|---|---|---|---|
| Legacy System Integration Complexity | -1.5% | Global, more pronounced in the mid-market | Long term (≥ 4 years) |
| Data Privacy, Consent, and Cross-Channel Identity Governance | -0.8% | Europe & North America | Medium term (2-4 years) |
| Channel Conflict Between Stores, Marketplaces, and Direct-To-Consumer Operations | -0.7% | Global, led by North America | Medium term (2-4 years) |
| High Total Cost of Ownership for Mid-Market Retailers | -0.9% | Global, concentrated in the mid-market | Long term (≥ 4 years) |
| Source: Mordor Intelligence | |||
Legacy System Integration Complexity Is Creating a Structural Two-Speed Market
Legacy system integration remains one of the clearest structural restraints, as many retailers still run store, ERP, POS, order management, and loyalty platforms built for separate operating models. The Manhattan Associates Unified Commerce Benchmark showed that only 7% of global retailers had reached “Leading” unified commerce maturity in 2026, which indicates how hard it remains to move from fragmented channel management to connected execution. SAP and Google Cloud’s adoption and support of the Universal Commerce Protocol (UCP) in 2026 signal that the industry is working to make transactions and post-sale workflows easier to coordinate across systems, but open standards do not eliminate the complexity of existing custom integrations overnight. This complexity is felt most sharply by mid-market retailers because the total cost of ownership includes software, API work, data cleanup, retraining, and staged process redesign, rather than license spending. The omnichannel retail market, therefore, continues to develop at two speeds, with better-capitalized retailers moving faster into unified commerce while others take a more gradual path. Even where the strategic case is clear, older technology stacks can stretch rollout timelines and delay the full value of inventory visibility, AI, and cross-channel fulfillment.
Data Privacy, Consent, and Cross-Channel Identity Governance Create Personalization Constraints
Data privacy and consent governance are limiting factors because omnichannel execution depends on linking behavior across web, app, store, and marketplace environments into one usable customer view. Retailers need this visibility to personalize product exposure, manage retention activity, and measure how discovery in one channel leads to conversion in another. Yet, they also need to manage suppression, consent withdrawal, and purpose-based data usage with greater precision. This tension is becoming more important in the omnichannel retail market because retailers are trying to grow both personalization and retail media monetization from the same first-party data foundation. Channel conflict adds another layer of pressure because stores, marketplaces, and direct-to-consumer teams may compete for the same demand, inventory, and promotional window if performance rules are not aligned. Amazon’s expansion of Multi-Channel Fulfillment to support merchant orders from Walmart Marketplace, Shopify, and SHEIN shows that brands are increasingly operating across overlapping commerce environments rather than isolated channels. Retailers that do not align identity controls, inventory rules, and incentive structures across those environments can face weaker attribution, lower margin discipline, and a more fragmented customer experience.[2]
*Our forecasts treat driver/restraint impacts as directional, not additive. The impact forecasts reflect baseline growth, mix effects, and variable interactions.
Segment Analysis
By Retail Format: Grocery Anchors the Base While Health & Beauty Accelerates
Grocery & Supermarkets held 28.32% of the global omnichannel retail market share in 2025, which kept the format at the center of everyday omnichannel execution. The scale of grocery matters because high purchase frequency exposes operational gaps in stock accuracy, order routing, pickup readiness, and return handling much more quickly than in lower-frequency retail categories. More than 94% of grocery shoppers in 2025 engaged across both physical and digital channels, showing how deeply omnichannel behavior has become embedded in this format. E-commerce also accounted for close to 75% of total grocery dollar growth in 2025, while online food sales increased almost 19% year over year, confirming that digital growth is now closely tied to store-linked fulfillment and service models. Within the omnichannel retail industry, grocery remains the clearest test of whether a retailer can coordinate physical and digital operations at scale daily.
Health & Beauty Retail is forecast to deliver the fastest growth in the omnichannel retail market at an 8.78% CAGR through 2031, reflecting its strong fit with high-visual discovery and high-personalization selling models. The format benefits from AI-led skin analysis, virtual try-on capabilities, and social commerce journeys that reduce friction across discovery, evaluation, and purchase. This category also responds well to richer content, repeat-purchase logic, and recommendation layers, as beauty shoppers often move between guidance, product trial, and replenishment within a short cycle. Apparel & Fashion Retail remains an important contributor because fit guidance, return management, and social-led discovery continue to shape customer decisions across channels. Consumer Electronics, Home & Furniture, and other formats are still progressing. Still, their omnichannel payback tends to depend more heavily on category-specific service, delivery, and research patterns than it does in grocery and beauty.

By Organization Size: Enterprise Scale Dominates, SME Agility Narrows the Gap
Large Enterprises captured 66.24% of the global omnichannel retail market in 2025, reflecting their structural advantages in capital scale, proprietary customer data, and established logistics systems. These retailers are better positioned to fund platform migration, build stronger internal data foundations, and negotiate broader solution bundles with software and infrastructure providers. The Manhattan Associates benchmark shows why this matters: only 7% of global retailers had reached Leading unified commerce maturity in 2026, and the performance gap between maturity levels remained commercially visible. Large operators can also absorb longer transformation timelines because they tend to manage technology investment as part of a wider productivity and customer retention agenda. As a result, the omnichannel retail market still favors enterprise retailers when execution requires scale across stores, fulfillment, and data activation.
Small and Medium-Sized Enterprises are projected to record the fastest CAGR of 9.13% through 2031, indicating that the capability gap is narrowing, even as the scale gap remains wide. Shopify’s Spring ’26 Edition introduced support for the Universal Commerce Protocol (UCP) and a framework that allows merchants to surface products across AI search interfaces, social channels, and agentic commerce environments from a single catalog layer. This kind of cloud-native infrastructure lowers the technical barrier to omnichannel adoption, enabling smaller retailers to activate more channels without building large internal engineering teams. SMEs are still more exposed to data cleanup costs, training needs, and process redesign, but they are gaining access to tools that were once concentrated among much larger operators. The omnichannel retail market is therefore opening new growth room for smaller retailers that can maintain catalog quality, inventory accuracy, and clear fulfillment discipline.
By Customer Touchpoint: Physical Stores Hold the Revenue Foundation as Social Commerce Rewires Discovery
Physical Stores accounted for 42.93% of the global omnichannel retail market in 2025, confirming that stores remain the primary revenue driver in connected retail models. Their role is changing, however, because stores now support browsing, assisted selling, pickup, ship-from-store, and returns rather than serving only as transaction sites. Shopify noted that luggage brand Monos reported 40% year-over-year revenue growth in regions with physical stores after gaining real-time cross-location inventory visibility through Shopify’s inventory layer. That example shows how the store network can simultaneously improve digital conversion and fulfillment efficiency when inventory and order data are properly connected. The omnichannel retail market continues to rely on stores not as legacy assets, but as operating nodes that connect convenience, trust, and post-purchase service.
Social Commerce is forecast to advance at a 9.45% CAGR through 2031, making it the fastest-growing touchpoint in the omnichannel retail market. Salesforce reported that 53% of consumers discovered products through social platforms in 2025, up from 46% in 2023, indicating a clear shift in where top-of-funnel activity begins. The same source found that 76% of Gen Z used social media to find products, reinforcing the extent to which younger shoppers are shaping the discovery layer of retail demand. Mobile Commerce is rising in parallel, as product research, creator content, comparison, and checkout are increasingly happening on a single screen and often within a single session. E-commerce websites remain important for deeper product research and higher-consideration purchases. Still, the touchpoint mix now shows a clearer split between where discovery begins and where conversion occurs.
Geography Analysis
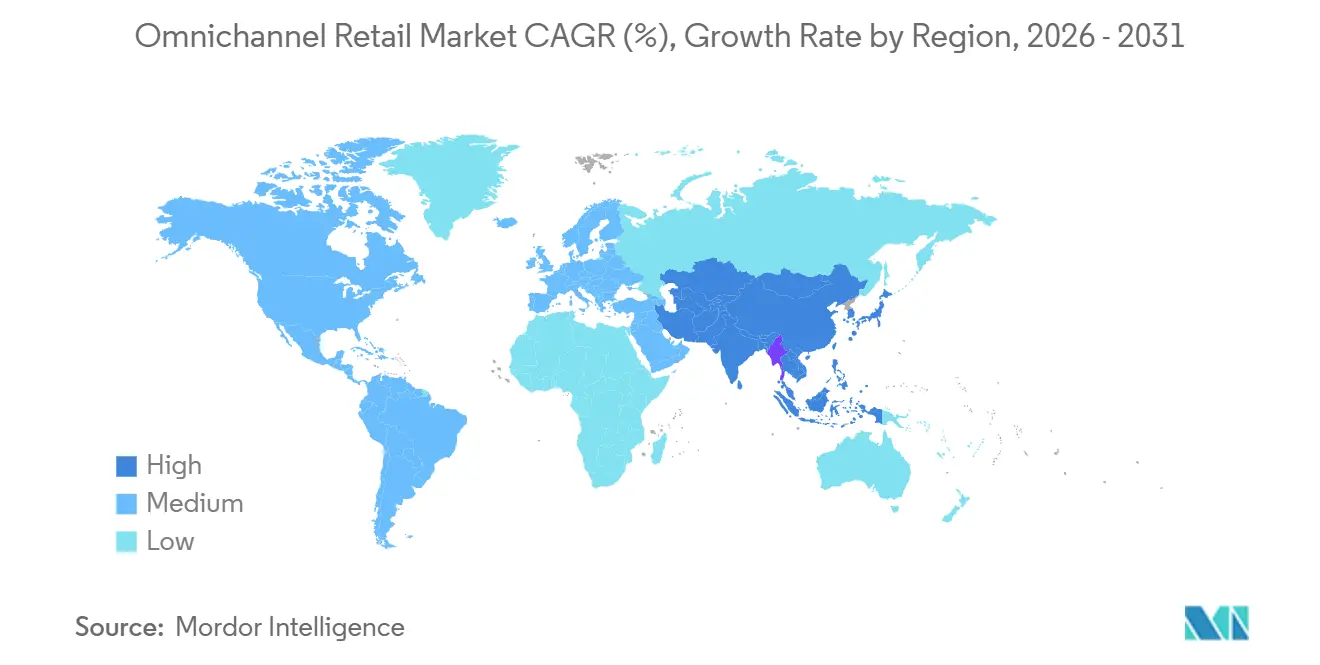
North America held 34.81% of the global omnichannel retail market share in 2025, maintaining its leading regional position. The region benefits from mature logistics networks, strong digital payment adoption, and large retailers that have already invested heavily in connected commerce models. Walmart's June 2026 announcement of its planned acquisition of Vibe.co indicates that major players are seeking to link retail media, streaming audiences, in-store activity, and digital commerce into a more unified commercial model. Amazon expanded Multi-Channel Fulfillment capabilities for merchants selling across external marketplaces and commerce platforms, including Walmart Marketplace, Shopify, and SHEIN. These moves suggest that the next stage of regional growth depends less on basic digital adoption and more on better coordination across advertising, inventory, stores, and final-mile execution.
Asia-Pacific is forecast to grow at a 9.96% CAGR through 2031, making it the fastest-growing region in the omnichannel retail market. The region combines mobile-led shopping behavior, strong social commerce adoption, and large physical retail networks, which gives omnichannel models more room to scale across categories and income tiers. For Indian retailers and brands, this regional pattern matters because customer expectations are increasingly being shaped by mobile-first engagement, faster digital decision-making, and tighter integration between online and offline service points. Health and beauty, fashion, grocery, and general merchandise formats are all under stronger pressure to connect discovery, payments, fulfillment, and service into a single journey rather than across separate channel teams. This keeps Asia-Pacific, including India, at the center of the global omnichannel retail market's evolution over the forecast period.
Europe is advancing at a more measured pace because fragmented retail structures, multiple consumer contexts, and stricter operating complexity can slow unified execution across markets. South America is developing through strong mobile commerce adoption and broader marketplace participation, though network quality and logistics depth outside major cities can still limit consistency. The Middle East is progressing on the back of digital infrastructure investment, rising smartphone use, and modern retail development in major urban centers. Across all 3 regions, the main pattern is clear: the omnichannel retail market grows fastest where logistics coordination, payment readiness, and cross-channel service standards are strong enough to support repeat customer use at scale.[3]
Competitive Landscape
The global omnichannel retail market shows a moderately concentrated platform layer, with Shopify, Salesforce Commerce Cloud, SAP Commerce Cloud, Oracle Commerce, and Adobe Commerce holding established positions among larger retailers. Competition is intensifying on 2 fronts: enterprise suites are defending their installed base while composable vendors are targeting retailers seeking quicker, more modular change. The Manhattan Associates Unified Commerce Benchmark indicates that capability maturity remains limited across the broader retailer base, leaving room for specialists to solve inventory, fulfillment, personalization, and returns challenges more effectively. SAP and Google Cloud’s 2026 deployment of the Universal Commerce Protocol is important because it moves platform competition toward open, AI-readable transaction standards rather than only storefront functionality. That keeps the omnichannel retail market competitive, active, and still open to shifts in platform preference over the medium term.
Strategic moves in 2025 and 2026 show that vendors are expanding through both acquisitions and product-layer innovation. Walmart announced an agreement to acquire Vibe.co in June 2026 to strengthen Walmart Connect’s commerce media capabilities across streaming, in-store, and digital environments. Commercetools unveiled MosAIc, an AI-native orchestration capability designed to support pricing, promotions, and fulfillment decisions. BigCommerce also unveiled new product innovations in April 2026 across multi-storefront orchestration, B2B functionality, payments, and AI-led commerce tools, which shows that product breadth remains a major competitive lever. These examples show that competitive differentiation in the omnichannel retail market is increasingly built around orchestration depth and AI usability rather than only storefront reach.
Amazon’s 2025 expansion of Multi-Channel Fulfillment to support merchants selling on Walmart Marketplace, Shopify, and SHEIN highlights the growing value of interoperability in an environment where retailers and brands operate across multiple selling surfaces simultaneously. Manhattan Associates commercialized its AI Agent Workforce in January 2026 and extended cloud access to its solutions via the Google Cloud Marketplace, strengthening its position in fulfillment-heavy, service-intensive deployments. White-space opportunities remain strongest in cross-channel returns optimization, mid-market unified commerce, and retail media attribution, where no vendor has fully closed the gap between data, fulfillment, and measurement. The competitive pattern, therefore, remains balanced, with large incumbents still influential but specialist execution and open integration models steadily changing buying decisions across the omnichannel retail market.
Omnichannel Retail Industry Leaders
-
Amazon.com, Inc.
-
Walmart Inc.
-
Shopify Inc.
-
Salesforce, Inc.
-
Oracle Corporation
- *Disclaimer: Major Players sorted in no particular order
Recent Industry Developments
- June 2026: Walmart announced an agreement to acquire Vibe.co, a self-serve connected TV advertising platform, to strengthen Walmart Connect's commerce media capabilities across streaming, in-store, and digital formats. Combined with the prior acquisition of VIZIO, this positions Walmart Connect as a full-funnel commerce media platform offering closed-loop attribution across CTV and retail channels.
- June 2026: commercetools introduced Autonomous Commerce at Shoptalk Europe and unveiled commercetools Sphere, an enterprise commerce platform integrating AI-native infrastructure with agent governance. The launch also included MosAIc, the first multi-agent orchestration tool enabling simultaneous management of pricing, promotions, and fulfillment based on desired business outcomes
- June 2026: SAP and Google Cloud announced support for and implementation of the Universal Commerce Protocol (UCP), an open standard designed to enable AI agents to interact with retail commerce systems, product discovery, transaction processing, and post-sale resolution, directly through SAP Commerce Cloud and Google’s Gemini interface.
- April 2026: VTEX announced an expanded AI-native commerce suite, introducing AI Personal Shopper, agentic customer experience capabilities, and a unified platform combining its Commerce, Retail Media, and Agentic CX modules. VTEX operates 3,100 online stores across 44 countries.
Global Omnichannel Retail Market Report Scope
| Grocery & Supermarkets |
| Apparel & Fashion Retail |
| Consumer Electronics Retail |
| Health & Beauty Retail |
| Home & Furniture Retail |
| Other Retail Formats |
| Small and Medium-Sized Enterprises |
| Large Enterprises |
| Physical Stores |
| E-commerce Websites |
| Mobile Commerce |
| Social Commerce |
| North America | United States |
| Canada | |
| Mexico | |
| South America | Brazil |
| Peru | |
| Chile | |
| Argentina | |
| Rest of South America | |
| Europe | United Kingdom |
| Germany | |
| France | |
| Spain | |
| Italy | |
| BENELUX (Belgium, Netherlands, and Luxembourg) | |
| NORDICS (Denmark, Finland, Iceland, Norway, and Sweden) | |
| Russia | |
| Rest of Europe | |
| Asia-Pacific | India |
| China | |
| Japan | |
| Australia | |
| South Korea | |
| South East Asia (Singapore, Malaysia, Thailand, Indonesia, Vietnam, and Philippines) | |
| Rest of Asia-Pacific | |
| Middle East and Africa | United Arab Emirates |
| Saudi Arabia | |
| South Africa | |
| Nigeria |
| By Retail Format | Grocery & Supermarkets | |
| Apparel & Fashion Retail | ||
| Consumer Electronics Retail | ||
| Health & Beauty Retail | ||
| Home & Furniture Retail | ||
| Other Retail Formats | ||
| By Organization Size | Small and Medium-Sized Enterprises | |
| Large Enterprises | ||
| By Customer Touchpoint | Physical Stores | |
| E-commerce Websites | ||
| Mobile Commerce | ||
| Social Commerce | ||
| By Geography | North America | United States |
| Canada | ||
| Mexico | ||
| South America | Brazil | |
| Peru | ||
| Chile | ||
| Argentina | ||
| Rest of South America | ||
| Europe | United Kingdom | |
| Germany | ||
| France | ||
| Spain | ||
| Italy | ||
| BENELUX (Belgium, Netherlands, and Luxembourg) | ||
| NORDICS (Denmark, Finland, Iceland, Norway, and Sweden) | ||
| Russia | ||
| Rest of Europe | ||
| Asia-Pacific | India | |
| China | ||
| Japan | ||
| Australia | ||
| South Korea | ||
| South East Asia (Singapore, Malaysia, Thailand, Indonesia, Vietnam, and Philippines) | ||
| Rest of Asia-Pacific | ||
| Middle East and Africa | United Arab Emirates | |
| Saudi Arabia | ||
| South Africa | ||
| Nigeria | ||
Key Questions Answered in the Report
What is the projected value of the omnichannel retail market by 2031?
The omnichannel retail market is projected to reach USD 11.31 trillion by 2031, rising from USD 7.86 trillion in 2026 at a CAGR of 7.55%.
Which region is growing fastest in omnichannel retail?
Asia-Pacific is the fastest-growing region, with the omnichannel retail market in the region expected to expand at a 9.96% CAGR through 2031.
Which retail format leads omnichannel retail market?
Grocery & Supermarkets led the global omnichannel retail market in 2025 with a 28.32% share, supported by frequent purchases and heavy use of both physical and digital channels.
Which customer touchpoint still generates the most revenue?
Physical Stores remained the largest touchpoint in 2025, accounting for 42.93% of the global omnichannel retail market, even as social commerce grows faster.
Why is inventory visibility so important in omnichannel retail?
Real-time inventory visibility supports BOPIS, ship-from-store, returns, and personalization. Manhattan Associates said optimization tools can cut out-of-stocks by half and lift revenue by up to 5%.
What is driving faster adoption among smaller retailers?
SMEs are projected to grow at a 9.13% CAGR through 2031, helped by cloud-native tools that reduce the technical barriers to launching connected store, digital, and social commerce capabilities.