
Market Overview
| Study Period | 2021 - 2031 |
|---|---|
| Market Size (2026) | USD 23.08 Billion |
| Market Size (2031) | USD 34.09 Billion |
| Growth Rate (2026 - 2031) | 8.11 % |
| Fastest Growing Market | Asia Pacific |
| Largest Market | North America |
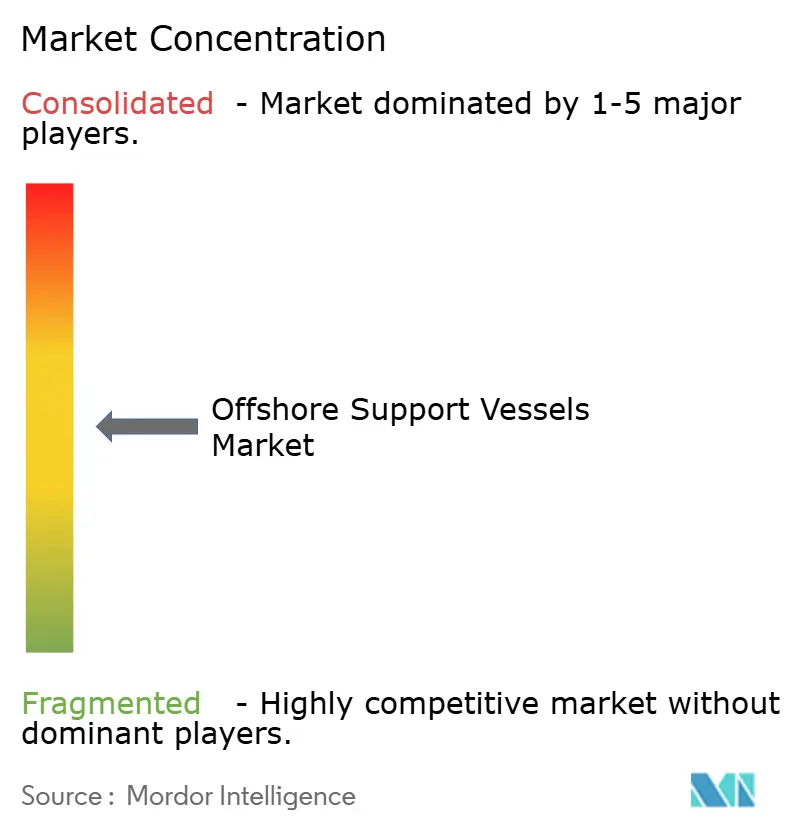
| Market Concentration | Medium |
Major Players *Disclaimer: Major Players sorted in no particular order Image © Mordor Intelligence. Reuse requires attribution under CC BY 4.0. | |
Offshore Support Vessels Market Analysis by Mordor Intelligence
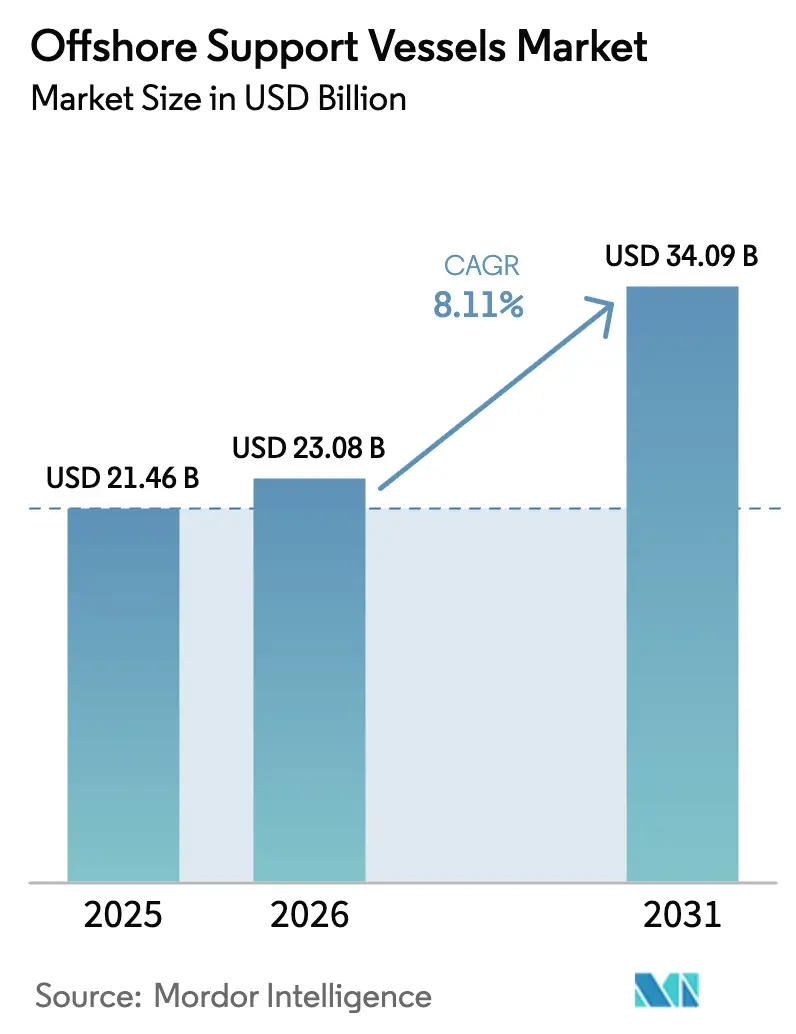
The Offshore Support Vessels Market size is projected to expand from USD 21.46 billion in 2025 and USD 23.08 billion in 2026 to USD 34.09 billion by 2031, registering a CAGR of 8.11% between 2026 to 2031.
Overlap among legacy oil-and-gas drilling, accelerating offshore-wind build-outs, and a sizable decommissioning backlog keeps vessel utilization tight even as shipyard capacity and volatile steel prices restrain newbuild supply. Charterers now favor multi-role tonnage capable of switching between anchor handling, subsea work, and wind-farm logistics, while owners race to add battery-hybrid and methanol-ready propulsion to satisfy International Maritime Organization 2030 emission limits. The market’s age profile, median 18 years, intensifies replacement demand, heightening barriers for cash-strapped operators but creating pricing power for modern fleets. Competitive dynamics, therefore, hinge on propulsion technology, dynamic-positioning class, and digital-readiness rather than sheer hull count.
Key Report Takeaways
- By vessel type, Anchor Handling Tug/Anchor Handling Towing Supply (AHT/AHTS) units commanded 42.4% of the offshore support vessels market share in 2025; in contrast, the multi-purpose, subsea-construction, and standby-crew category is forecast to grow at a 9.5% CAGR through 2031.
- By application, oil and gas maintained a 50.9% share of the offshore support vessels market size in 2025, whereas offshore wind is advancing at a 15.9% CAGR to 2031.
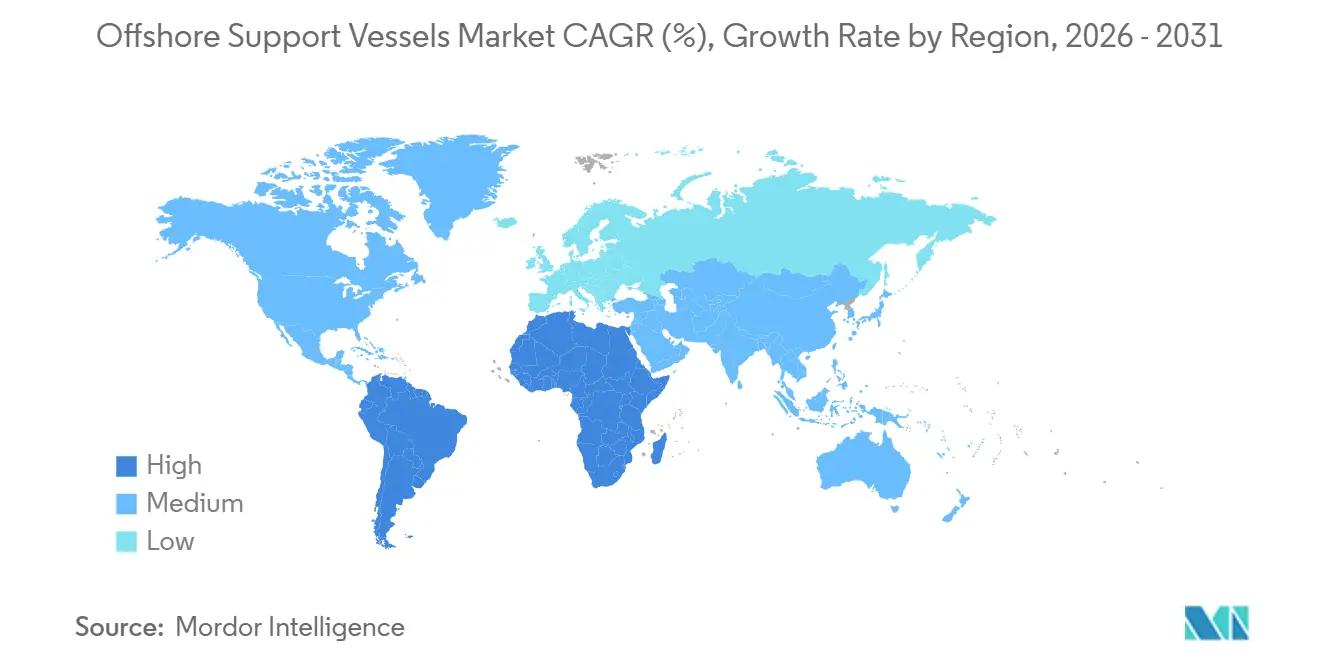
- By geography, North America led with 33.7% offshore support vessels market share in 2025, while Asia-Pacific is poised for the fastest 9.1% CAGR to 2031.
Note: Market size and forecast figures in this report are generated using Mordor Intelligence’s proprietary estimation framework, updated with the latest available data and insights as of January 2026.
Market Trends and Insights
Drivers Impact Analysis of Offshore Support Vessels Market*
| Driver | (~) Impact on CAGR Forecast | Geographic Relevance | Impact Timeline |
|---|---|---|---|
| Up-cycle in offshore E&P CAPEX | 2.1% | Global, with concentration in Gulf of Mexico, North Sea, Brazil pre-salt, Middle East | Medium term (2-4 years) |
| Accelerating offshore wind installations | 2.5% | Europe (North Sea, Baltic), Asia-Pacific (China, Taiwan, South Korea), nascent North America Atlantic coast | Long term (≥4 years) |
| Stricter decommissioning mandates | 0.7% | North Sea (UK, Norway), Gulf of Mexico, Southeast Asia (Malaysia, Thailand) | Medium term (2-4 years) |
| Surge in floating production systems (FPSO, FLNG) | 1.2% | Brazil pre-salt, West Africa (Angola, Nigeria), Guyana, Southeast Asia | Medium term (2-4 years) |
| Ageing fleet renewal & green retrofit demand | 1.3% | Global, led by European operators under EU ETS, followed by North America and Asia-Pacific | Medium term (2-4 years) |
| Data-driven OPEX optimisation (digital twins, CBM) | 0.9% | Global, early adoption in North Sea (Norway, UK) and Gulf of Mexico | Short term (≤2 years) |
| Source: Mordor Intelligence | |||
Up-cycle in Offshore E&P CAPEX
Offshore exploration budgets rebounded in 2024-2025 as operators sanctioned projects deferred during the 2020 downturn, supporting the offshore support vessels market. Chevron allocated USD 7 billion for Gulf of Mexico tie-backs set to commence in 2026, while ExxonMobil approved the Hammerhead field in Guyana in early 2025, both programs requiring sustained AHT/AHTS and PSV support.[1] Shell’s Bonga North development in Nigeria and BW Energy’s Maromba campaign in Brazil exemplify geographic breadth. Rig utilization climbed to 88% by mid-2024, pushing DP-2 day rates beyond USD 25,000 in the North Sea. Vessel owners with young, high-specification fleets are therefore positioned to capture full-rate contracts, whereas aging tonnage faces cold-stacking.
Accelerating Offshore Wind Installations
European and Asian developers are commissioning gigawatt-scale arrays that are strengthening the offshore support vessels market by relying on specialized service-operation vessels, cable-lay support, and crew-transfer units. Cadeler secured a USD 500 million award in 2025 for Ørsted’s Hornsea 3 project, deploying installation tonnage plus standby and supply craft. China added 6 GW of offshore wind in 2024, raising crew-transfer utilization above 80% in coastal provinces.[2] U.S. Bureau of Ocean Energy Management approval for Empire Wind and Sunrise Wind in 2024 opened a Jones Act–Act-constrained market where compliant vessels command day rates exceeding USD 50,000.[3] These projects require DP-2 or higher capability, large deck areas, and walk-to-work gangways, prompting newbuild orders from Damen and Ulstein.
Aging Fleet Renewal & Green Retrofit Demand
Median fleet age reached 18 years in 2024, spurring investment in methanol dual-fuel and battery-hybrid systems across the offshore support vessels market. Eidesvik converted two PSVs in 2025, cutting carbon intensity by 80% and securing long-term Equinor charters with sustainability-linked pricing. Maersk Supply Service invested USD 45 million in hybrid retrofits across four anchor handlers in 2024, trimming fuel burn by 20% during DP operations.[4] Owners unwilling or unable to finance upgrades accelerated scrapping, tightening effective supply, and supporting rate recovery even as nominal hull counts decline.
Data-Driven OPEX Optimization
Predictive analytics is lowering downtime and fuel costs across the offshore support vessels market. Bureau Veritas launched a digital-twin platform in 2024 that schedules maintenance during port calls, avoiding offshore breakdowns. Norwegian firm Seavium reported 12% fuel savings across eight PSVs by optimizing trim and routing. Bourbon connected 30 vessels to an IoT backbone in 2025, predicting failures 72 hours in advance and cutting maintenance expense 18% year over year. Adoption started in the North Sea and Gulf of Mexico fleets but is spreading as charterers mandate digital readiness in tenders.
Restraints Impact Analysis of Offshore Support Vessels Market*
| Restraint | (~) Impact on CAGR Forecast | Geographic Relevance | Impact Timeline |
|---|---|---|---|
| High oil-price volatility | -1.4% | Global, acute in marginal offshore basins with break-even above USD 60/bbl | Short term (≤2 years) |
| Capital-intensive newbuild costs | -1.1% | Global, most acute in markets requiring specialized tonnage (Jones Act, offshore wind SOVs) | Long term (≥4 years) |
| Shortage of experienced crew | -0.8% | Global, most severe in North Sea, Gulf of Mexico, and Asia-Pacific growth markets | Medium term (2-4 years) |
| Limited yard capacity & high steel prices | -0.9% | Global, concentrated in Asian shipbuilding hubs (China, South Korea, Singapore) | Medium term (2-4 years) |
| Source: Mordor Intelligence | |||
High Oil-Price Volatility
Brent swings between USD 70 and USD 90 in 2024-2025, with delayed FIDs for higher-cost fields. TotalEnergies postponed the Begonia project in Angola, idling four PSVs earmarked for the campaign. Tidewater disclosed in Q3 2024 that 12% of its fleet faced contract roll-offs without immediate follow-on work, underscoring sensitivity to price uncertainty. Volatility favors short-cycle shale over multi-year offshore commitments, dampening vessel demand in West Africa and the U.S. Gulf.
Shortage of Experienced Crew
The International Maritime Organization warns of an 89,510-officer shortfall by 2026. Solstad left eight vessels idle in 2024 because it could not source DP operators and chief engineers. Achieving DP Unlimited certification entails 180 days of sea time plus coursework, creating a two-year training pipeline. Acute deficits in the Asia-Pacific force operators to import European crew at premium wages, squeezing margins.
*Our forecasts treat driver/restraint impacts as directional, not additive. The impact forecasts reflect baseline growth, mix effects, and variable interactions.
Offshore Support Vessels Market Segment Analysis
By Vessel Type:
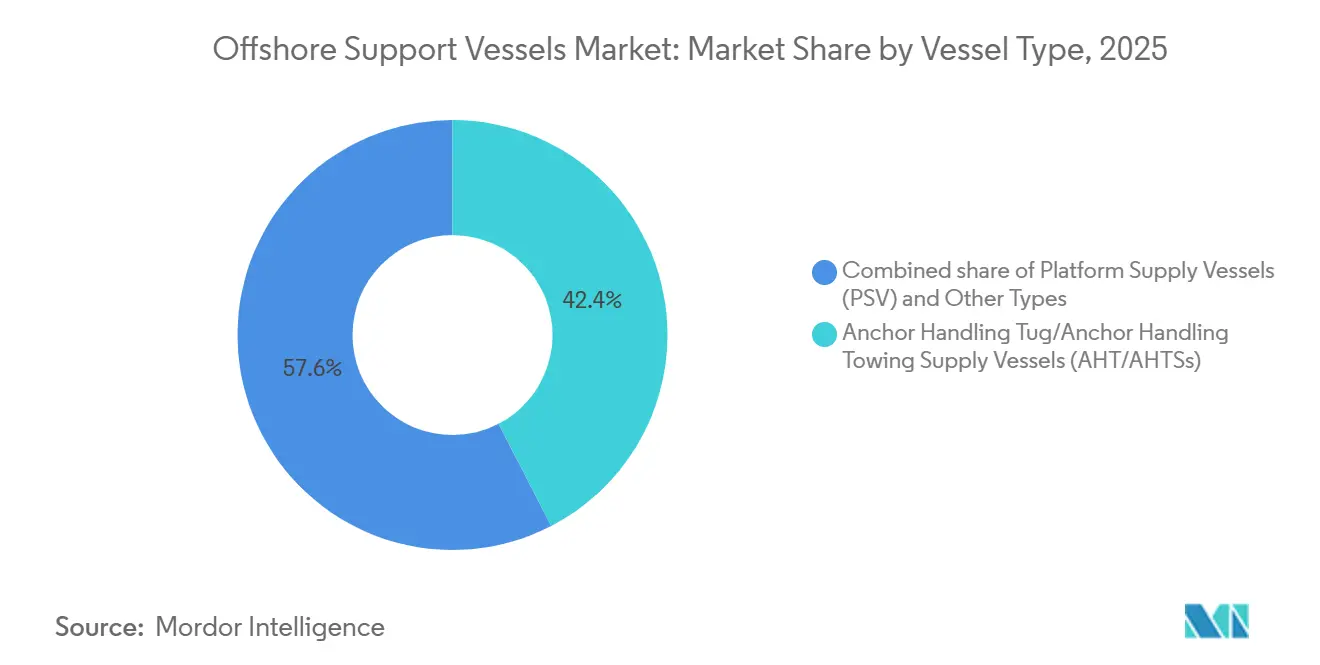
AHT/AHTS Dominance Meets Multi-Purpose GrowthAHT/AHTS units secured 42.4% offshore support vessels market share in 2025, driven by deepwater rig moves in the Gulf of Mexico, North Sea, and West Africa, with modern ≥ 15,000 bollard-pull vessels running above 82% utilization at Tidewater’s fleet hub. Platform Supply Vessels (PSVs) followed, supporting logistics for drilling fluids and provisions; North Sea PSV utilization climbed to 78% in 2024 on the back of Equinor and Aker BP campaigns.
The “Other Types” cluster, multi-purpose support vessels (MPSVs), subsea-construction units, and standby-crew boats, will outpace headline growth at 9.5% CAGR as owners value assets that pivot between well intervention, cable-lay, and emergency response. Saipem deployed the Constellation III MPSV in 2025 to TotalEnergies’ Mero-3 FPSO installation, showcasing DP-3 and 400-ton crane capability. Regulatory mandates in the U.K. and German waters now require dedicated safety vessels within 30 minutes of turbine arrays, expanding demand for standby craft. Damen delivered six Fast Crew Supplier 2710 units in 2024, each moving 26 technicians in sea states up to 2.5 m.



By Application:
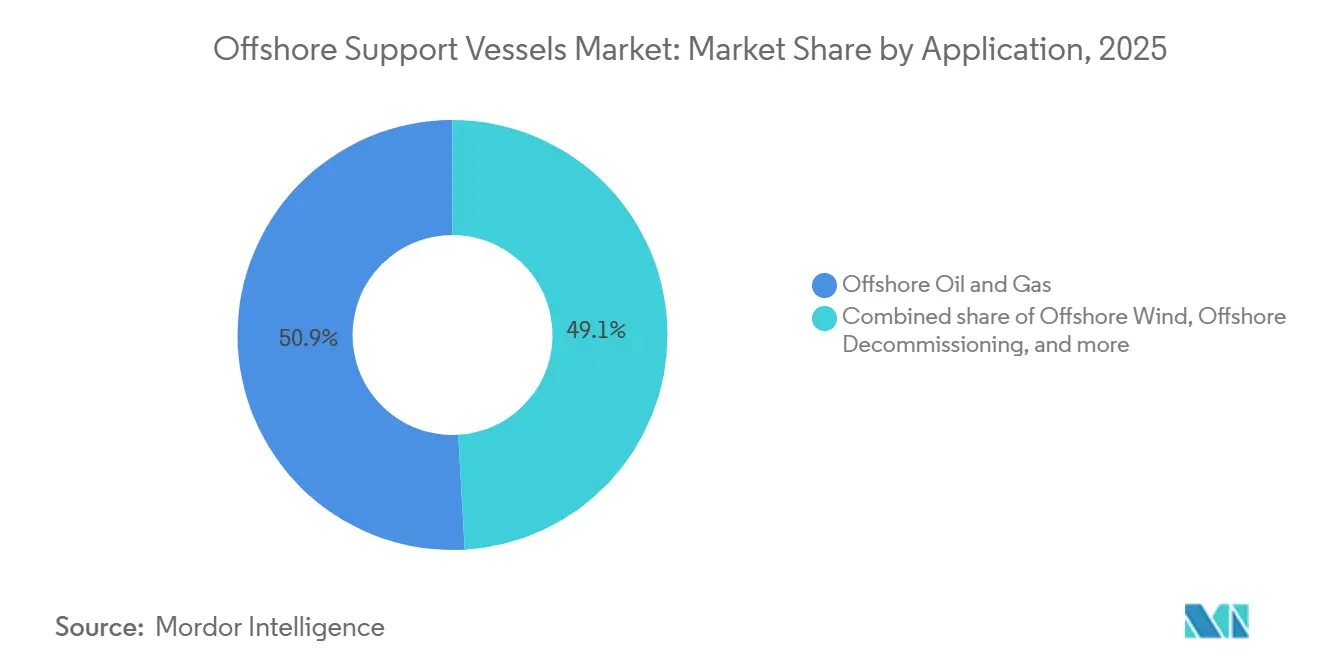
Oil and Gas Anchors While Wind AcceleratesOil and gas retained 50.9% of the offshore support vessels market size in 2025, buoyed by Petrobras’ 62-vessel charter portfolio in Brazil’s pre-salt Santos Basin and Chevron’s Anchor project in the Gulf of Mexico. Decommissioning also underpins demand: the U.K. regulator estimates 2,000 wells and 500 platforms require abandonment by 2030, necessitating heavy-lift and plug-and-abandonment support.
Offshore wind, however, is the fastest-growing application, expanding at a 15.9% CAGR. Ørsted’s Hornsea 3 alone contracted 12 service-operation vessels and eight crew-transfer boats for a 25-year operations phase. U.S. wind build-out along the Atlantic seaboard is capacity-constrained by the Jones Act, encouraging domestic yards to invest despite 36-month delivery lead times. Emerging niches include subsea mining and offshore aquaculture, where Norway’s Loke Marine commenced a two-year seabed-sampling charter in 2025.
Geography Analysis
North America Offshore Support Vessels Market
North America held 33.7% of the offshore support vessels market share in 2025, propelled by 22 active Gulf of Mexico rigs and early-stage U.S. wind projects. The Jones Act limits mean only 12 compliant service-operation vessels are available for a 30-GW Atlantic pipeline, sending charter rates north of USD 50,000 per day and prompting new orders at Gulf Coast yards despite extended delivery slots. Canada’s Bay du Nord project, sanctioned in 2025, will need six DP-2 PSVs and two AHTS units from 2028.
Europe Offshore Support Vessels Market
Europe combines North Sea drilling intensity with the world’s largest installed offshore wind base. Ørsted’s Hornsea 3 and RWE’s Sofia projects together locked in 20 service-operation vessels through 2050, guaranteeing long-duration revenue streams for Cadeler and Seaway 7. Germany cleared 4 GW of new wind capacity in 2024, spurring cable-lay demand. Norway spudded 15 exploration wells in 2024, the highest since 2019, keeping Stavanger-based AHTS utilization above 80%.
APAC Offshore Support Vessels Market
Asia-Pacific will post a 9.1% CAGR to 2031, fueled by China’s target of 100 GW offshore wind by 2030 and India’s Krishna-Godavari deepwater program. China installed 6.3 GW in 2024, driving crew-transfer utilization beyond 85% in coastal bases such as Yangjiang. India’s ONGC drilled eight deepwater wells in 2024, chartering DP-2 PSVs from Singapore and Malaysia. Australia’s Star of the South wind farm, approved in 2024, will require six service-operation vessels from 2028.

Regulatory Landscape
Regulation is increasingly shaping offshore support vessel (OSV) technical specifications and operating economics around safety, personnel carriage, and emissions reporting. Under the International Maritime Organization (IMO), amendments entering into force on 1 January 2026 add requirements for lifting appliances on offshore construction ships, tightening expectations for equipment standards and documentation on construction and subsea-support tonnage. In parallel, the IMO International Code of Safety for Ships Carrying Industrial Personnel (IP Code) (Chapter XV) applies to cargo ships and high-speed craft carrying more than 12 industrial personnel, for vessels constructed on or after 1 July 2024. This reinforces demand for purpose-designed offshore wind and construction support vessels with compliant arrangements for industrial personnel.
In Europe, emissions compliance is shifting from voluntary claims toward auditable data and, next, carbon cost exposure. Regulation (EU) 2015/757 (EU MRV) applies greenhouse gas monitoring and reporting to offshore ships of 400 GT and above from 1 January 2025, raising the compliance bar for OSV operators serving EU jurisdictions. In the United States, the U.S. Coast Guard (USCG) has formalized navigational safety expectations for vessels operating in or near offshore renewable energy installations through NVIC 03-23, influencing routing, risk assessments, and site-interface procedures for Jones Act-constrained service and crew transfer activity around offshore wind project areas.
Competitive Landscape
Market concentration remains moderate: the top five operators, Tidewater, Bourbon, Maersk Supply Service, Seacor Marine, and Edison Chouest Offshore, hold roughly 35% of global capacity, leaving regional specialists room to maneuver. Technology and environmental credentials now trump raw fleet size. Tidewater’s USD 180 million purchase of 12 modern PSVs from Swire Pacific in 2024 allowed the retirement of older hulls and the immediate charter of DP-2 tonnage into Asia-Pacific wind campaigns. Maersk Supply Service’s USD 45 million hybrid-retrofit program secured sustainability-linked charters with Equinor at premium rates.
Digital advantage is another differentiator. Bourbon’s predictive-maintenance suite delivered 22% downtime reduction and 98% availability guarantees, an edge where rig delays cost operators USD 500,000 daily. Solstad carved out a niche in construction support with a 10-year DP-3 contract for the Normand Maximus, one of only eight comparable units worldwide. Disruptors such as Cadeler channel wind-specific equity, USD 600 million raised in 2024, into next-generation turbine-installation vessels, lifting competitive pressure on oil-centric incumbents.
Offshore Support Vessels Industry Leaders
Transocean
Valaris
Seadrill
Noble
Shelf Drilling
- *Disclaimer: Major Players sorted in no particular order
Offshore Support Vessels Market Companies Covered in this Report
- Bourbon Corporation SA
- Maersk Supply Service AS
- Seacor Marine Holdings Inc.
- Edison Chouest Offshore LLC
- Swire Pacific Limited
- Tidewater Inc.
- Harvey Gulf International Marine LLC
- Solstad Offshore ASA
- Hornbeck Offshore Services Inc.
- PACC Offshore Services Holdings Ltd.
- DOF Group ASA
- Vroon Offshore Services BV
- Siem Offshore Inc.
- Havila Shipping ASA
- Eidesvik Offshore ASA
- Vallianz Holdings Limited
- Companhia Brasileira de Offshore (CBO)
- Zakher Marine International
- Damen Shipyards Group
- Deep Sea Supply Plc

Market Opportunities and Future Outlook
Fleet renewal and retrofit capacity anchors the market white space given the aging operating fleet and tighter compliance requirements, while shipyard slots remain limited. Operators are putting capital toward lower-emission and higher-spec capability rather than generic tonnage additions. Maersk Supply Service committed USD 45 million to hybrid retrofits across four anchor handlers in 2024, and Eidesvik converted two PSVs in 2025 while tying the upgrades to long-term Equinor charters. With a median 18-year fleet age (2024) and EU emissions reporting obligations (MRV from 1 January 2025), the case for battery-hybrid, methanol-ready, and digital-ready upgrades strengthens, alongside third-party engineering, class, and energy-efficiency services that reduce downtime during dry-docking.
Offshore wind operations and construction are also extending multi-year service needs that favor owners with walk-to-work capability, DP-2 or higher, and higher-comfort accommodation, alongside local-content constraints in some markets. In July 2026, Ørsted and Windcat signed long-term contracts for seven crew transfer vessels supporting UK wind farm operations out of Grimsby, illustrating how operations-phase requirements translate into multi-vessel awards and sustain utilization for modern crews and craft. Financing and newbuild programs for wind-specific tonnage continue as well, including Cadeler arranging a EUR 247 million green term loan facility (backed by EIFO) in July 2026 to fund construction of its wind turbine installation vessel. This supports an investment pipeline for specialized offshore wind support and adjacent OSV services.
Recent Industry Developments in Offshore Support Vessels Market
- July 2026: Ørsted and Windcat signed long-term contracts for seven crew transfer vessels to support offshore wind operations in the UK, based out of Grimsby. The multi-vessel structure increases visibility of utilization for CTV operators and reinforces demand for purpose-built personnel transfer capacity tied to long-duration wind farm operations.
- January 2026: DOF secured a four-year contract with Petrobras for its ROV support vessel Skandi Commander, with work scheduled to start in January 2027 and an estimated contract value of about USD 150 million. The award extends DOF's Brazil footprint and underlines sustained tendering for high-spec subsea and ROV support tonnage in pre-salt and related offshore programs.
- November 2025: Windcat signed an agreement with Damen Shipyards Group for a new Multi-Purpose Accommodation Support Vessel (MP-ASV), with an option for five additional vessels. The move expands the build pipeline for wind-oriented offshore support assets that combine accommodation with deck and lifting capability, and it signals owners prioritizing flexible vessels that can cover construction support and operations-phase logistics.


Offshore Support Vessels Market Report Scope and Research Methodology
Market Definition and Coverage
This market is defined as the revenue generated from offshore support vessels that are chartered or operated to transport supplies, crew, and equipment, and to provide towing, anchoring, standby, and similar marine support for offshore energy activities across global waters.
Scope exclusions: The sizing excludes naval vessels and inland waterway workboats, and it also excludes onshore logistics and port service revenue that is billed outside OSV day-rate contracts.
Segments Covered in This Report
- By Vessel Type
- Anchor Handling Tug/Anchor Handling Towing Supply Vessels (AHT/AHTSs)
- Platform Supply Vessels (PSV)
- Other Types (MPSV, Subsea, Standy Crew)
- By Application
- Offshore Oil and Gas
- Offshore Wind
- Offshore Decommissioning
- Other Applications
- By Geography
- North America
- United States
- Canada
- Mexico
- Europe
- United Kingdom
- Norway
- Germany
- France
- Italy
- Russia
- Rest of Europe
- Asia-Pacific
- China
- India
- Japan
- South Korea
- ASEAN Countries
- Australia and New Zealand
- Rest of Asia-Pacific
- South America
- Brazil
- Argentina
- Chile
- Rest of South America
- Middle East and Africa
- Saudi Arabia
- United Arab Emirates
- Qatar
- Nigeria
- Angola
- Rest of Middle East and Africa
- North America
Data Sources, Market Sizing, and Validation
Desk Research
Desk work starts by building a clean demand map of offshore activity and fleet availability, so later assumptions are not floating. Public sources, such as IEA offshore oil and gas supply outlooks, EIA offshore production statistics, national offshore regulators and leasing agencies, and IMO/flag state safety and registration references, are used to anchor activity levels and operating rules.
We also review OSV owner investor decks, annual reports, and earnings call notes to track utilization, day-rate direction, and fleet changes by vessel class. On top of this, we use paid subscriptions for company financials and intelligence, plus a ship-focused database and a contract and tenders feed to cross-check awarded work, vessel deployment signals, and timing. The sources listed here are illustrative and not exhaustive, and we reviewed additional public references to support data collection, validation, and clarification.
Primary Interviews and Surveys
Primary inputs come from interviews and short surveys with OSV owners and operators, chartering and commercial managers, offshore project teams, and marine procurement stakeholders across APAC, EMEA, and the Americas. The discussions were used to confirm how day-rates are quoted, how utilization behaves by basin and season, and which vessel classes are being substituted or kept distinct, then we adjusted the model assumptions where differences were consistently observed.
Distribution of primary research fieldwork respondents
| Company type | Respondent position | Region |
|---|---|---|
| Top tier: 39% | CXOs: 13% | APAC: 47% |
| Mid tier: 45% | Functional/Unit leaders: 30% | EMEA: 32% |
| Smaller Players: 16% | Managers: 57% | Americas: 21% |
Market-Sizing & Forecasting
The core sizing uses a top-down build where offshore activity levels are reconstructed by basin and then translated into OSV demand through service intensity and vessel mix assumptions. In practice, we start from indicators like offshore rig counts and days on hire, subsea and offshore wind project schedules, and offshore production and maintenance activity, which are then converted into expected vessel-days for PSVs, AHTS, and other common OSV roles.
Once the vessel-day pool is formed, pricing is applied using observed day-rate bands and a weighted mix that reflects contract length, spot exposure, and typical utilization ranges. To keep the totals realistic, we corroborate results with selective bottom-up approximations, such as sampling disclosed charter rates, checking representative fleets against stated utilization, and validating implied revenue per vessel against reported performance ranges. Forecasts are developed using scenario analysis around offshore capex, regional project starts, and utilization normalization, followed by stepwise updates to day-rates based on primary inputs and recent tender outcomes. Where data is thin for smaller basins, gaps are handled by using proxy utilization and rate curves from comparable regions, then stress-testing the impact in review.
Data Validation & Update Cycle
Model outputs are checked against independent market signals, including fleet supply changes, tender volumes, and utilization direction, before the final numbers are signed off. If a region shows a sharp jump that is not supported by rigs, project timing, or awarded work, we re-check the assumptions and re-contact relevant interviewees for clarification.
The estimates go through multi-step analyst reviews where inputs, unit logic, and currency conversions are checked for consistency and outliers. Reports are refreshed annually, and interim updates are made when material events occur, such as major offshore sanctioning shifts, sudden day-rate resets, or meaningful fleet capacity changes. Before delivery, a final pass is completed so clients receive the latest updated view aligned to the current data cut.
Mordor Intelligence's Global Offshore Support Vessels Market Market Size Compared Against Other Published Estimates
Published OSV market numbers can look far apart even when they talk about the same vessel types, because the timing of the pricing snapshot and the way rates are averaged across spot and term work is not handled the same way. Differences also show up when sources mix offshore wind support revenue into the same bucket, or when they use a broader workboat definition that brings in adjacent marine services.
In a refresh-led approach, the spread is often explained by when currency conversion is locked, how fast day-rate curves are updated after tender cycles, and whether utilization is treated as a yearly average or a peak-season proxy. That is why the 2026 value in this report was updated using the most recent contract and utilization checks, along with desk indicators, a discipline applied by Mordor Intelligence.
Benchmark comparison
| Source | Market Size | Gaps in Research Methodology |
|---|---|---|
| Mordor Intelligence | USD 23.08 B (2026) | |
| Industry Research Publisher A | USD 25.60 B (2024) | Uses an earlier base year and can reflect a different rate cycle, and it is not always clear if the pricing is a spot-heavy snapshot or a blended annual average across contract types. |
| Research Platform B | USD 22.71 B (2024) | A lower 2024 value can come from slower day-rate progression assumptions and a more conservative utilization path, and the forecast window differs, which can change what is treated as the normalized starting point. |
Across the three figures, most of the gap can be traced back to base-year choice, how utilization is averaged, and how day-rates are updated and converted into USD. By keeping the market boundary tied to OSV charter and operating revenue and by forcing each step to reconcile with observable activity and tender signals, the final number stays transparent and repeatable even when conditions change fast.


Key Questions Answered in the Report
How large is the offshore support vessels market in 2026?
The offshore support vessels market is valued at USD 23.08 billion in 2026, continuing its trajectory toward USD 34.09 billion by 2031.
What factors drive demand for new offshore support vessels?
Rising offshore-wind installations, a rebound in deepwater exploration CAPEX, and the need to replace aging tonnage with low-emission, digital-ready ships are the primary demand drivers.
Which vessel class dominates the sector?
AHT/AHTS units remain the single largest class, holding 42.4% offshore support vessels market share in 2025, thanks to their critical role in rig moves and deepwater anchoring.
Why are charter rates climbing in the U.S. offshore wind segment?
Jones Act constraints limit the number of compliant vessels, creating supply scarcity just as East Coast wind projects enter construction, which pushes day rates above USD 50,000.
What technologies are owners adopting to cut operating costs?
Battery-hybrid propulsion, methanol dual-fuel engines, predictive maintenance, and digital twins are being deployed to reduce fuel burn, emissions, and unplanned downtime.
How severe is the crew shortage?
The International Maritime Organization projects an 89,510-officer deficit by 2026, delaying vessel deployment and inflating wage bills, especially in Asia-Pacific growth markets.
Page last updated on:




