
Nano Biosensors Market Size and Share
Market Overview
| Study Period | 2020 - 2031 |
|---|---|
| Market Size (2026) | USD 15.8 Billion |
| Market Size (2031) | USD 23.55 Billion |
| Growth Rate (2026 - 2031) | 8.36 % |
| Fastest Growing Market | Asia Pacific |
| Largest Market | North America |
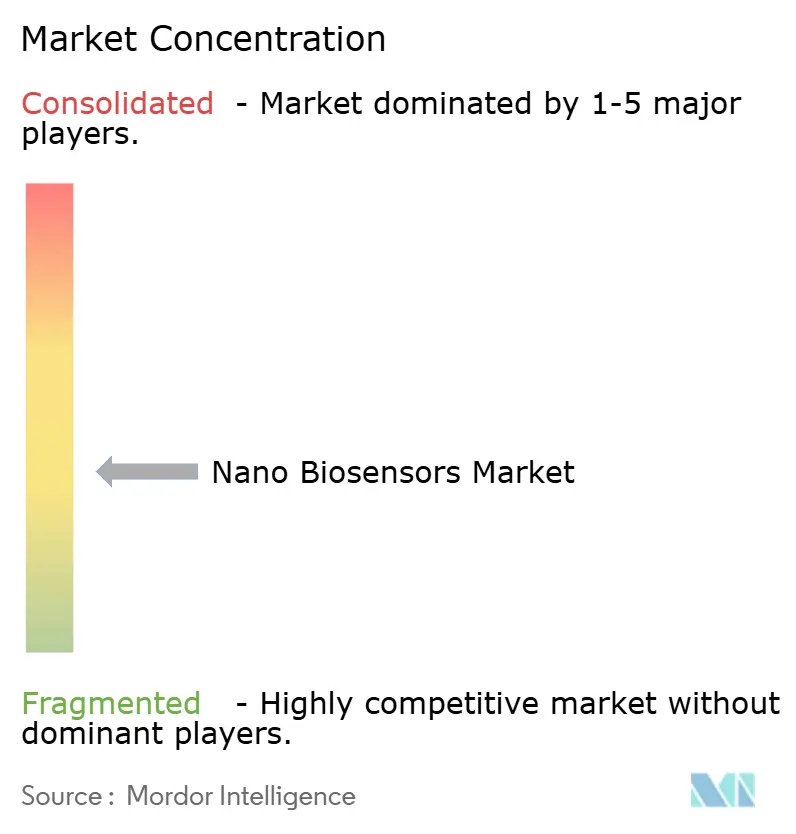
| Market Concentration | Medium |
Major Players *Disclaimer: Major Players sorted in no particular order Image © Mordor Intelligence. Reuse requires attribution under CC BY 4.0. | |
Nano Biosensors Market Analysis by Mordor Intelligence
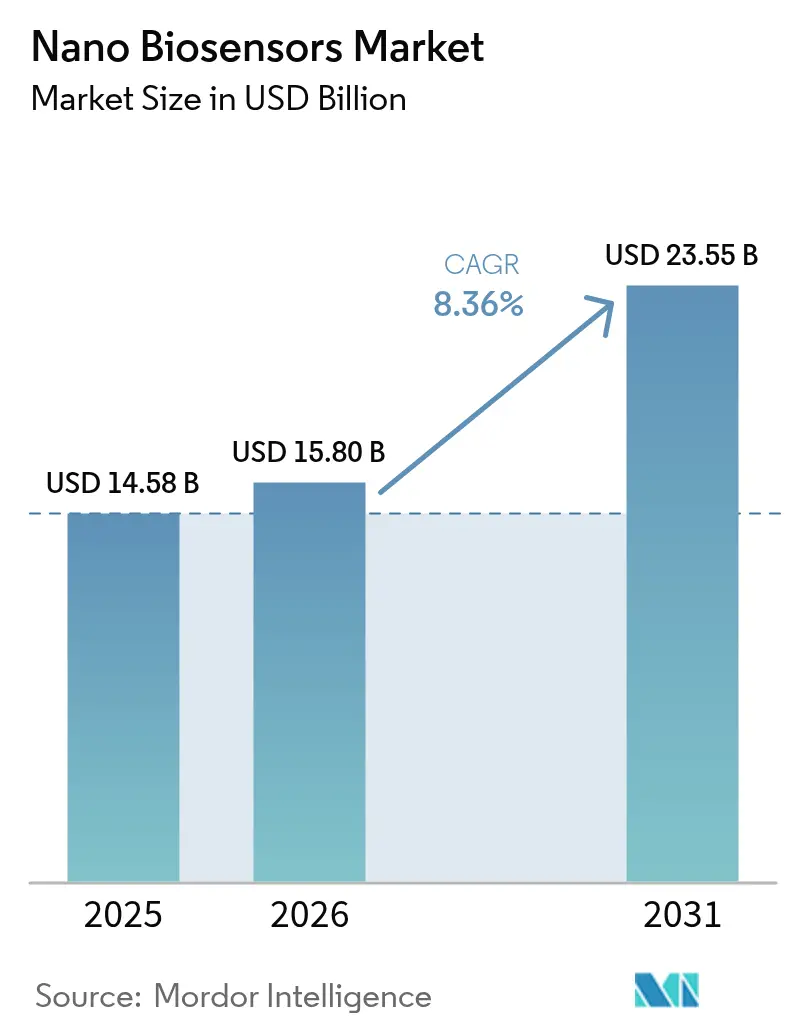
The nano biosensors market size is expected to grow from USD 14.58 billion in 2025 to USD 15.8 billion in 2026 and is forecast to reach USD 23.55 billion by 2031 at 8.36% CAGR over 2026-2031. This expansion is underpinned by continued nanomaterial breakthroughs, the proliferation of point-of-care testing mandates, and a global shift toward decentralized care pathways that favor near-patient analytics over batch laboratory workflows. Demand is further supported by public-health programs incentivizing rapid pathogen screening, cloud-integrated wearable devices that deliver continuous biomarker streams, and policy moves targeting antimicrobial stewardship in both clinical and food-supply settings. Strategic partnerships between sensor manufacturers and cloud-platform providers are multiplying, as providers seek to compress latency while ensuring compliance with HIPAA and GDPR frameworks,. Meanwhile, supply-chain vulnerabilities for graphene oxide and rare-earth-doped quantum dots are elevating raw-material risk profiles, lengthening lead times, and encouraging vertical integration by multinational incumbents.
Key Report Takeaways
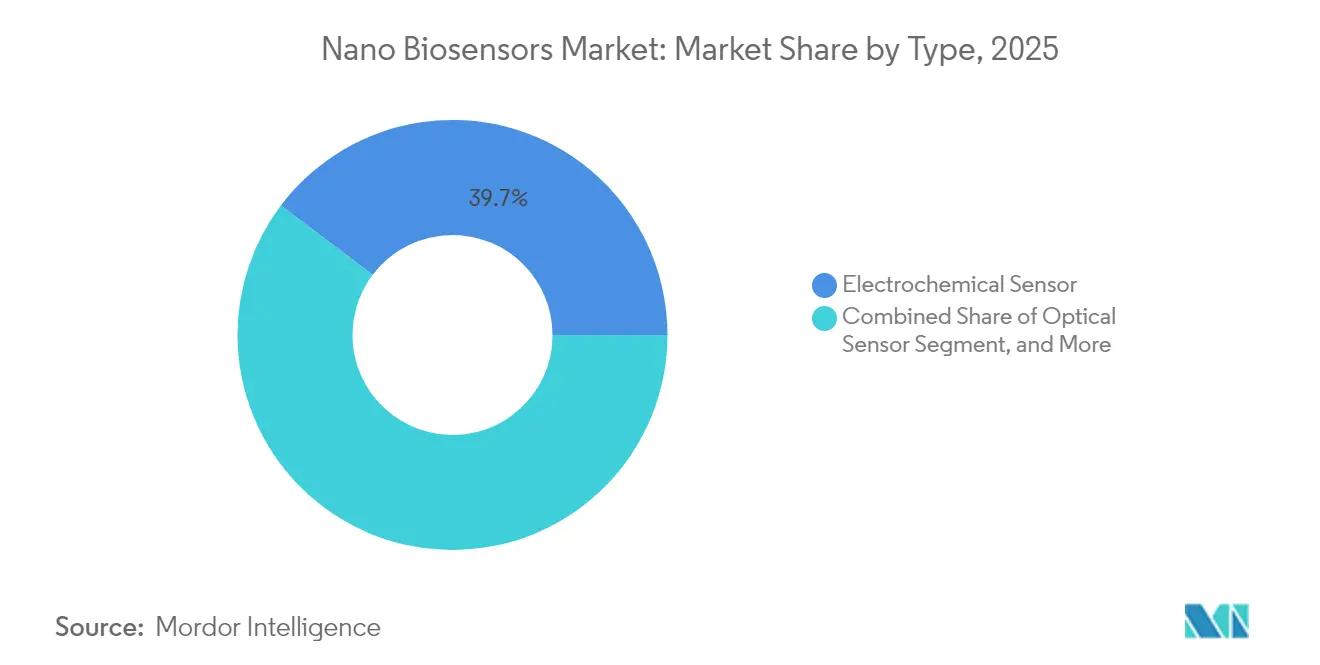
- By type, electrochemical sensors led with a 39.72% nano biosensors market share in 2025, while optical platforms are projected to expand at a 9.48% CAGR through 2031.
- By end user, healthcare held 35.12% of nano biosensors market revenue in 2025; environmental monitoring is set to record the fastest 8.82% CAGR to 2031.
- By application, medical diagnostics accounted for 45.78% of 2025 revenue, whereas food safety testing is forecast to accelerate at a 9.22% CAGR through 2031.
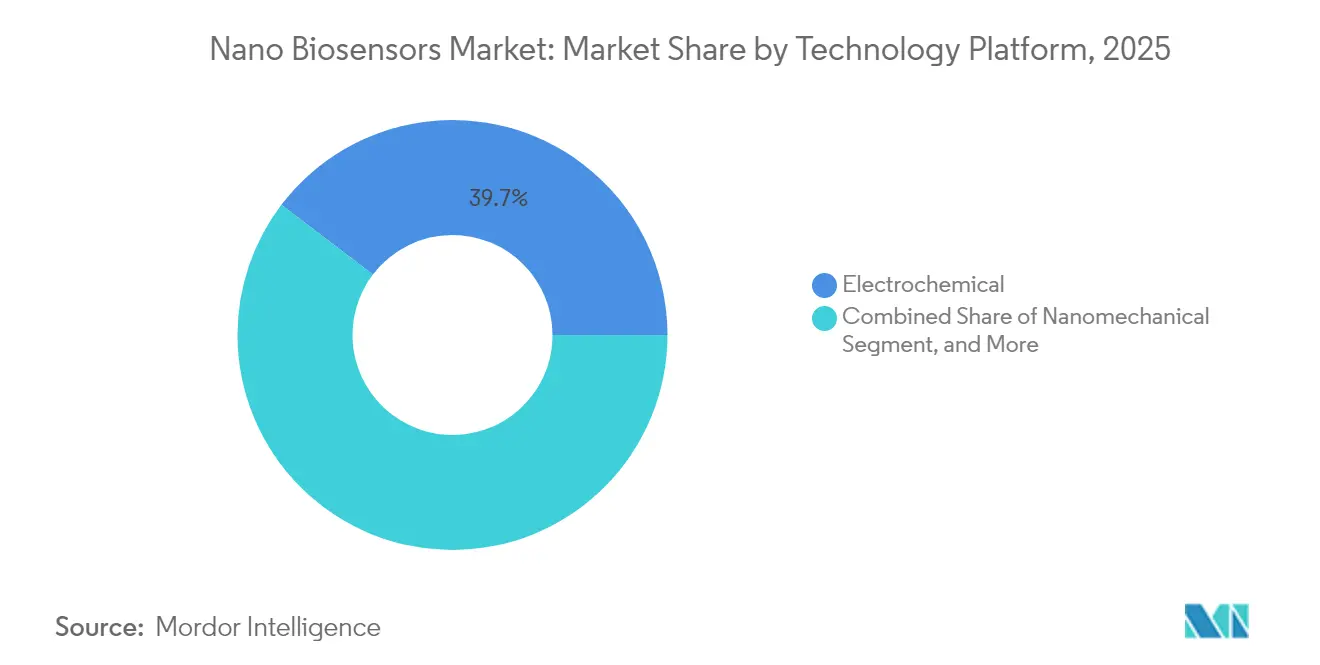
- By technology platform, electrochemical architectures captured 39.65% of 2025 sales, but nanomechanical systems are advancing at a 9.68% CAGR to 2031.
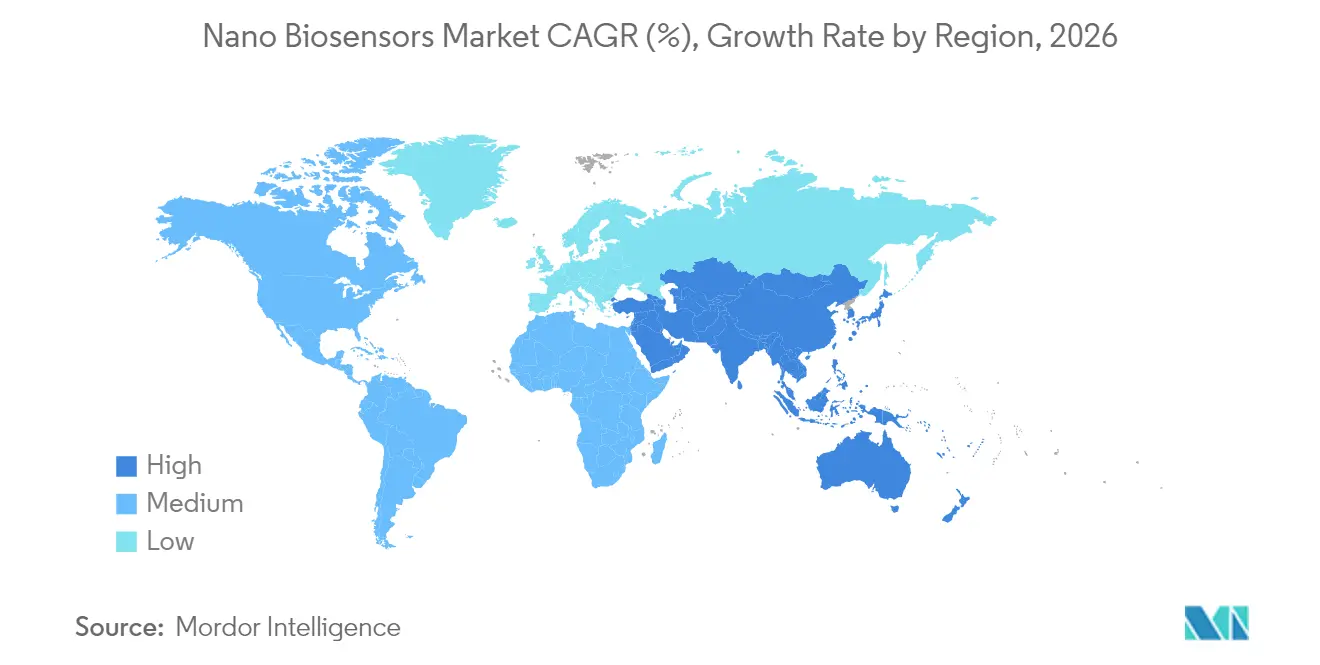
- By geography, North America generated 34.55% of 2025 revenue, yet Asia-Pacific is poised to grow at a 9.86% CAGR over the forecast window.
Note: Market size and forecast figures in this report are generated using Mordor Intelligence’s proprietary estimation framework, updated with the latest available data and insights as of 2026.
Market Trends and Insights
Drivers Impact Analysis of Nano Biosensors Market*
| Driver | (~) % Impact on CAGR Forecast | Geographic Relevance | Impact Timeline |
|---|---|---|---|
| Rising adoption in point-of-care medical diagnostics | +1.8% | Global, concentrated in North America and Europe | Medium term (2-4 years) |
| Advancements in nanomaterial fabrication techniques | +1.5% | Global, led by Asia-Pacific manufacturing hubs | Long term (≥4 years) |
| Growing demand for continuous glucose monitoring devices | +1.4% | North America and Europe, expanding into Asia-Pacific | Short term (≤2 years) |
| Integration of biosensors with IoT platforms | +1.2% | Global, early adoption in North America and EU | Medium term (2-4 years) |
| Regulatory push for antibiotic stewardship | +0.9% | Global, with WHO and CDC leadership | Medium term (2-4 years) |
| Printable flexible substrates for food safety | +0.8% | Asia-Pacific core, spillover to North America | Long term (≥4 years) |
| Source: Mordor Intelligence | |||
Rising Adoption in Point-of-Care Medical Diagnostics
Point-of-care tools are replacing centralized laboratory testing across emergency departments, rural clinics, and home-care settings because turnaround time directly influences clinical outcomes. In 2024, the United States Food and Drug Administration cleared 23 nano-enabled diagnostic platforms that deliver multiparameter results within 15 minutes using fingerstick volumes under 50 microliters. Reimbursement models such as Medicare’s Hospital Readmissions Reduction Program reward hospitals that discharge patients with rapid triage data in hand, and nano-scale transducers offer femtomolar detection limits that catch sepsis biomarkers earlier than conventional immunoassays. As a result, decentralized testing is also scaling in low- and middle-income countries under the World Health Organization’s ASSURED criteria, which emphasize affordability and user friendliness. The ensuing uptake supports consistent double-digit unit growth for compact handheld readers in the nano biosensors market.
Advancements in Nanomaterial Fabrication Techniques
Continuous roll-to-roll synthesis of graphene, carbon nanotubes, and quantum dots has reduced per-unit nanomaterial costs ten-fold since 2024. Inkjet-printed graphene electrodes now achieve sheet resistances below 50 Ω per square at deposition speeds above 10 m/min, enabling low-cost disposable test strips. Cadmium-free indium phosphide quantum dots comply with RoHS rules while sustaining quantum yields above 60%, a prerequisite for optical biosensors serving time-critical food-safety assays. These gains transform single-use sensor economics, bringing test prices below USD 0.50 and trimming sample-to-answer windows to under 30 minutes. ISO/TS 80004-2 issued in 2024 codifies nanomaterial terminology, reducing regulatory ambiguity and shortening product-registration cycles
Growing Demand for Continuous Glucose Monitoring Devices
Continuous glucose monitoring (CGM) has moved from a niche diabetes therapy to a mainstream wellness tool. Abbott’s FreeStyle Libre surpassed USD 5.3 billion in 2024 sales as non-insulin-using diabetics sought real-time data.[1]Abbott Laboratories, “Annual Report 2024,” abbott.com Centers for Medicare and Medicaid Services expanded coverage to this cohort, adding 3.2 million eligible U.S. beneficiaries. Nanowire and nanoparticle electrodes extend sensor life to 14 days and reduce biofouling. Dexcom’s G7 maintains mean absolute relative difference at 8.2% across 10 days, aided by silver-nanoparticle membranes. The convergence of sensor data with automated insulin delivery further broadens addressable demand, moving the nano biosensors market into athletic performance optimization and general metabolic tracking.
Integration of Biosensors with IoT Platforms
Edge computing and 5G connectivity convert episodic diagnostics into continuous health streams. IEEE 11073, ratified in 2024, defines interoperability between biosensors and electronic health records, lowering integration barriers. Wearable patches that track lactate, cortisol, and electrolytes already inform real-time coaching decisions in professional sports. Nonetheless, wireless transmission heightens cybersecurity exposure, prompting regulators to require end-to-end encryption and penetration testing in premarket filings. GDPR data-residency rules add compliance complexity for firms operating across borders.
Restraints Impact Analysis of Nano Biosensors Market*
| Restraint | (~) % Impact on CAGR Forecast | Geographic Relevance | Impact Timeline |
|---|---|---|---|
| Complex manufacturing process and yield variability | -0.7% | Global, acute in Asia-Pacific contract facilities | Short term (≤2 years) |
| Stringent regulatory approval pathways | -0.6% | North America and Europe | Medium term (2-4 years) |
| Nanomaterial supply-chain constraints | -0.4% | Global, concentrated in China-dependent pipelines | Long term (≥4 years) |
| Data-privacy concerns in wearable ecosystems | -0.3% | Europe and North America | Medium term (2-4 years) |
| Source: Mordor Intelligence | |||
Complex Manufacturing Process and Yield Variability
Multi-step fabrication that includes nanomaterial synthesis, electrode patterning, and microfluidic assembly introduces defect accumulation that suppresses yields. Pilot runs achieve 85%–92% output, yet rates drop once line speed exceeds 15 m/min because ink viscosity fluctuates and substrates distort. A 1% electrode-alignment error can cut sensor sensitivity by 12%, forcing deployment of USD 0.08-to-0.12 inline imaging per unit. Batch-to-batch material variability drives additional recalibration cycles, problematic for over-the-counter strips priced for single use. IEC 62304 traceability mandates compound documentation tasks, stretching smaller developers’ resources and delaying time-to-volume ramp-ups.
Stringent Regulatory Approval Pathways for Clinical Biosensors
The U.S. FDA’s 2024 guidance shifted many diagnostic claims from 510(k) to premarket approval, requiring pivotal trials enrolling up to 500 subjects with year-long follow-up. Europe’s In Vitro Diagnostic Regulation demands third-party conformity assessment for Class C biosensors, adding 18-24 months to launch timelines. Post-market vigilance has intensified as well; manufacturers must now submit adverse reports within 30 days, and 47 biosensor recalls occurred in 2024. Extended timelines inflate burn rates, dampening early-stage venture capital flows and tempering the near-term outlook for new entrants within the nano biosensors market.
*Our forecasts treat driver/restraint impacts as directional, not additive. The impact forecasts reflect baseline growth, mix effects, and variable interactions.
Nano Biosensors Market Segment Analysis
By Type:
Optical Sensors Gain Ground in Multiplexed AssaysOptical sensor platforms in the nano biosensors market are advancing at a 9.48% CAGR, eclipsing the broader growth rate as food-safety and environmental users demand label-free, multi-analyte assays. Surface-plasmon-resonance chips and fluorescence-based transducers avoid enzyme labels that suffer cold-chain restrictions, thereby shaving logistics overhead. Electrochemical architectures still dominated 2025 with 39.72% revenue thanks to glucose and cardiac panels, yet they face interference from electroactive compounds in complex matrices, adding filtration steps that inflate bill-of-materials costs. Acoustic sensors, which read mass changes on piezoelectric crystals, are making inroads where opacity sidelines optical approaches, such as fermentation broth monitoring. Calorimetric and nanomechanical variants remain confined to research due to high instrumentation costs, though Defense Advanced Research Projects Agency funding seeks handheld prototypes by 2027, a move that could refresh product roadmaps. Overall, the shift toward optical multiplexing expands use-case breadth and underpins premium pricing, reinforcing revenue momentum for specialized suppliers.
The nano biosensors market size for optical sensors is set to expand more quickly than other types as end users value rapid, simultaneous detection that cuts total assay time. Electrochemical platforms will continue to command scale advantages in consumables, yet commoditization pressures from low-cost Asian fabs necessitate innovation in interference shielding and reagent-free chemistries. As technology choices converge on specific performance niches, vendors that tailor sensor packages to well-defined clinical or industrial problems are expected to capture disproportionate wallet share.



By End User Industry:
Environmental Monitoring SurgesEnvironmental bodies are opening procurement budgets to tackle new contaminant classes, propelling environmental monitoring to a 8.82% CAGR, the fastest among end users. The U.S. Environmental Protection Agency’s 2024 regulation putting PFAS limits at 4 ppt requires sub-ppm sensitivity that roll-to-roll nanowire sensors now achieve in under 20 minutes. Healthcare remained the largest buyer at 35.12% of 2025 spending, yet its growth moderates as CGM penetration saturates type 1 diabetic cohorts. Food and beverage processors are scaling biosensor use at loading docks and cold-chain hubs, satisfying retailer mandates for four-hour pathogen clearance windows. Defense and security agencies trial quantum-dot arrays for standoff detection of weaponized chemicals, underscoring the breadth of addressable niches in the nano biosensors industry.
Environmental adopters value low-maintenance nodes that integrate with supervisory control systems and supply granular risk analytics. These capabilities justify premium per-unit pricing despite municipal budget constraints. As benchmark contaminant lists lengthen, adoption curves are expected to remain steep, strengthening the nano biosensors market.
By Technology Platform:
Nanomechanical Systems EmergeNanomechanical cantilever and resonance-frequency sensors are growing at a 9.68% CAGR, the fastest in technology splits, because they deliver label-free readouts suited to high-throughput drug screening pipelines. Electrochemical platforms still hold the largest 2025 share at 39.65%, but price competition is intense, with Chinese producers offering glucose strips at USD 0.15. Optical transducers are gaining share in food safety, offering multi-pathogen detection in 30 minutes with 98.3% concordance to PCR. Calorimetric devices lag because of insulation needs, although MEMS thermopiles are closing size gaps. The nano biosensors market size within nanomechanical systems is expected to widen as pharmaceutical and academic labs adopt higher-throughput formats, driving accessory reagent sales.
Future gains hinge on miniaturization, scalability, and integration with standard microplate formats. Vendors that deliver plug-and-play compatibility with laboratory automation can lock in sticky, recurring revenue across consumables and software analytics.
By Application:
Food Safety Testing AcceleratesFood safety-testing demand is rising at a 9.22% CAGR, outpacing overall growth as the U.S. Produce Safety Rule compels on-site screening for Listeria within the work shift. Biosensors delivering results in under an hour enable just-in-time logistics, cutting storage costs and spoilage. Medical diagnostics retained a 45.78% share in 2025 thanks to strong CGM and multisite cardiac biomarker usage, though incremental growth is tilting toward panels that combine metabolic and inflammatory markers on a single cartridge. Environmental monitoring now extends to block-level air quality maps in cities like London, with sensor nodes feeding municipal IoT networks. Industrial process control remains under 8% of revenue but offers large whitespace, particularly as biopharma makers target yield gains via real-time nutrient tracking.
As retailers impose zero-defect delivery standards, food processors rely on biosensors to safeguard brand equity and maintain shelf-life guarantees. This set of compliance pressures gives vendors a durable revenue outlook anchored in consumables replenishment, reinforcing double-digit unit shipments into the nano biosensors market.
Geography Analysis
APAC Nano Biosensors Market
Asia-Pacific is projected to post a 9.86% CAGR to 2031, the highest regional pace in the nano biosensors market. China’s 14th Five-Year Plan allocates CNY 12 billion (USD 1.7 billion) in subsidies for domestic nanomaterial and sensor capacity, while the National Medical Products Administration expedites reviews for locally developed CGM systems.India’s Ayushman Bharat Digital Health Mission integrates sensor data with unified records, spurring hospital demand. Japan approved eight novel platforms in 2024 under the Society 5.0 banner, extending market presence into wellness-oriented saliva and sweat assays.
The Americas and EMEA Nano Biosensors Market
North America, which generated 34.55% of 2025 revenue, enjoys an installed base of CGM users and favorable reimbursement. Growth, however, is moderating as type 1 penetration plateaus, shifting unit volumes toward prediabetic monitoring and multi-analyte patches. European momentum depends on the In Vitro Diagnostic Regulation, which delivers a market of 450 million consumers but raises conformity assessment costs and elongates launch calendars EMA. The Middle East is investing in smart-city platforms; Dubai deployed 200 real-time water-quality nodes in 2024 under its Smart City initiative. South America and Africa remain underpenetrated owing to fragmented rules and limited cold-chain logistics, although Brazil’s ANVISA eased pathways for WHO-prequalified point-of-care devices.
APAC and Europe Nano Biosensors Market
Collectively, regional policy support, reimbursement expansion, and manufacturing capability are reshaping market-share contours. The nano biosensors market size in Asia-Pacific is on track to surpass Europe before 2030 if current adoption trajectories persist.

Regulatory Landscape
Regulation for nano biosensors is governed largely through existing medical device and IVD regimes, with additional scrutiny when nanomaterials drive performance or introduce exposure risk. In the European Union, the Medical Device Regulation (EU) 2017/745 treats devices incorporating nanomaterials as higher risk under Rule 19 when internal exposure potential is medium or high. The In Vitro Diagnostic Regulation (EU) 2017/746 also increases third-party conformity assessment requirements for many clinical biosensors, which pushes out time-to-market.
In the United States, the FDA regulates products containing nanomaterials under product-specific authorities and has provided nanomaterial considerations in an April 2022 guidance for drug and biological products. This reinforces expectations around characterization, quality, and study design when nano-features are material to performance or safety. Globally, standards and terminology frameworks shape submissions and test plans, including ISO nanotechnology work (ISO/TC 229) and ISO 10993 biocompatibility testing for patient-contacting components. For connected and algorithm-assisted biosensors, traceability and software lifecycle controls increase documentation burdens for developers integrating IoT and analytics.
Value Chain Analysis
The nano biosensors value chain spans (1) upstream nanomaterial inputs (graphene and carbon nanotubes, quantum dots, nanowires, functional coatings and reagents), (2) device fabrication and packaging (CMOS-compatible microfabrication, roll-to-roll printing on flexible substrates, electrode patterning, microfluidic integration, and assembly), (3) system integration (readers, firmware, connectivity modules, and cloud/edge analytics), and (4) downstream channels (clinical laboratories and hospitals, point-of-care distributors, retail and pharmacy networks for home tests, food and beverage processors, and environmental-monitoring programs). Competitive differentiation is increasingly concentrated in the integration layers, including robust surface chemistry, antifouling strategies, microfluidic sample handling, and software that turns nano-scale signals into clinically actionable outputs.
Moving from lab prototypes to volume production creates bottlenecks around yield variability and calibration consistency in complex biological fluids, including Debye screening and broader matrix effects. Many developers rely on specialized contract manufacturers for micro and nano-scale assembly and use semiconductor-style process control to improve repeatability. Larger incumbents are also pursuing vertical integration to reduce exposure to constrained nanomaterial supply chains and to shorten lead times for critical inputs.
Competitive Landscape
The nano biosensors market remains moderately fragmented; the top five players Abbott, Dexcom, Medtronic, Roche Diagnostics, and Honeywell command 42% of global revenue. Incumbents double down on vertical integration, acquiring nanomaterial suppliers to mitigate quantum-dot and graphene oxide shortages. Patent activity is brisk: a World Intellectual Property Organization analysis counted 1,847 active biosensor filings in 2024, with 34% held by universities, highlighting robust technology-transfer pipelines. Smaller entrants exploit regulatory arbitrage, winning early approvals in India and Australia before pursuing FDA clearance, thereby generating non-dilutive cash flow.
Competitive advantage is shifting toward holistic platform models that bundle hardware, consumables, and subscription analytics. CGM leaders now sell monthly plans with unlimited sensors and coaching, improving lifetime value and reducing churn. Technology differentiation focuses on three levers sensor longevity, calibration frequency, and multiplexing breadth. Firms extending sensor wear past 14 days cut per-diem costs, while machine-learning-based drift correction raises accuracy. Predicted FCC rule changes on bandwidth allocation for medical devices could spark a new wave of connected biosensor launches, intensifying cloud partnership activity.
New entrants leverage printable microfluidics to condense multi-step assays into credit-card-sized cartridges. A venture-backed startup demonstrated a tri-modality platform performing PCR, immunoassay, and electrochemical detection from a single blood drop, aiming at retail clinics and pharmacies. Incumbents respond through acquisitions or co-development deals to avoid losing share in emerging decentralized channels. As subscription models mature, data analytics and patient-engagement services represent a growing share of profit pools, reshaping value-capture strategies across the nano biosensors industry.
Nano Biosensors Industry Leaders
ACON Laboratories, Inc.
Abbott Point of Care, Inc.
Agilent Technologies, Inc.
Nanowear, Inc.
AerBetic LLC
- *Disclaimer: Major Players sorted in no particular order
Nano Biosensors Market Companies Covered in this Report
- Abbott Laboratories
- ACON Laboratories, Inc.
- Agilent Technologies Inc.
- NanoScent Ltd.
- Nanowear, Inc.
- AerBetic LLC
- Instant NanoBiosensors Co. Ltd.
- LamdaGen Corporation
- Bruker Corporation
- Honeywell International Inc.
- Analog Devices Inc.
- Omron Corporation
- Biosensors International Group Ltd.
- Universal Biosensors Inc.
- Medtronic plc
- Roche Diagnostics International AG
- Dexcom Inc.
- STMicroelectronics N.V.

Market Opportunities and Future Outlook
White-space is opening where compliance timelines and workflow economics favor near-patient and field-deployable testing over centralized laboratory throughput. In healthcare, point-of-care cartridges and wearable patches are gaining budget access when they align with reimbursement and care-pathway objectives, supported by the FDA clearance count for nano-enabled rapid diagnostic platforms in 2024 and ongoing expansion of continuous monitoring use cases around glucose and multi-analyte panels. For manufacturers, opportunities concentrate in platformization, particularly bundling disposable sensor consumables with subscription analytics and interoperability aligned to IEEE 11073 (ratified in 2024) to reduce integration friction with electronic health records.
Outside healthcare, regulatory and procurement anchors are creating clearer pull for nano biosensors that deliver lower detection limits and faster turnaround. The U.S. EPA PFAS limit of 4 ppt (issued in 2024) raises demand for high-sensitivity environmental nodes capable of rapid measurements. Food safety mandates, including the U.S. Produce Safety Rule, support on-site screening that fits within operational shift windows. On the supply side, adoption opportunities also hinge on industrializing nanomaterial-enabled manufacturing, including CMOS-compatible approaches and roll-to-roll printed electrodes, where improved reproducibility and standardized calibration can reduce regulatory risk and support uptake across decentralized, high-volume channels.
Recent Industry Developments in Nano Biosensors Market
- March 2026: Abbott Point of Care issued a field safety notification for i-STAT EG7+, EG6+, and G3+ cartridges after identifying potential PCO2 and pH deviation issues in specific lots. The action underscores how post-market quality controls and lot-level traceability affect adoption for connected point-of-care testing menus that depend on cartridge standardization across care sites.
- October 2025: ACON Laboratories received FDA 510(k) clearance for the Flowflex Plus RSV + Flu A/B + COVID Home Test, positioned as a 4-in-1 respiratory home test. The expanded panel supports consumer migration toward multiplexed at-home diagnostics and increases competitive pressure on single-analyte or narrower rapid-test portfolios.
- April 2024: Abbott received FDA clearance for the i-STAT TBI cartridge using whole blood to assist in assessing suspected concussions at the patients bedside. This clearance broadens the addressable point-of-care testing menu in emergency and near-patient settings, supporting demand for compact readers paired with disposable cartridges.


Nano Biosensors Market Report Scope and Research Methodology
Market Definition and Coverage
For this study, the nano biosensors market covers biosensing devices where nanoscale materials or structures enable detection of biological signals, and revenues are counted as the sale value of these sensor systems used across major end uses.
Scope exclusions: We exclude adjacent conventional biosensors that do not use nano-enabled sensing elements and any stand-alone lab reagents that are not part of a nano biosensor system sale.
Segments Covered in This Report
- By Type
- Optical Sensor
- Electrochemical Sensor
- Acoustic Sensor
- Other Types
- By End User Industry
- Healthcare
- Food And Beverage
- Environmental Monitoring
- Defence And Security
- Other End Users
- By Technology Platform
- Electrochemical
- Optical
- Nanomechanical
- Calorimetric
- Acoustic
- By Application
- Medical Diagnostics
- Food Safety Testing
- Environmental Monitoring
- Industrial Process Control
- Others Applications
- By Geography
- North America
- United States
- Canada
- Mexico
- Europe
- United Kingdom
- Germany
- France
- Italy
- Rest of Europe
- Asia-Pacific
- China
- Japan
- India
- South Korea
- Rest of Asia
- Middle East
- Israel
- Saudi Arabia
- United Arab Emirates
- Turkey
- Rest of Middle East
- Africa
- South Africa
- Egypt
- Rest of Africa
- South America
- Brazil
- Argentina
- Rest of South America
- North America
Data Sources, Market Sizing, and Validation
Desk Research
Desk work starts by building the demand and supply context around nano-enabled sensing, since pricing and adoption can swing by application. We referenced public sources such as the US FDA device database and guidance pages, the US National Institutes of Health and PubMed for peer-reviewed study volume, the World Health Organization for disease and screening signals, and the World Bank and OECD for macro indicators that influence healthcare and industrial spending.
To ground the commercial side, we also leaned on company annual reports, investor decks, and product literature to understand what is sold as a nano biosensor versus a broader diagnostics platform. Patent databases were used to check the pace of nanomaterial and sensing platform innovation, and an approved paid subscription for company financials and intelligence helped standardize revenues and segment clues when disclosures were not clean. These sources are illustrative, and many other public references were used to collect data, validate assumptions, and clarify open questions during the research process.
Primary Interviews and Surveys
Primary work was used to stress-test what desk sources cannot settle cleanly, especially ASP ranges, shipment mix by application, and how quickly nano-enabled platforms are replacing older sensing approaches. We spoke with a mix of device-side stakeholders, channel participants, and end-user decision makers across Americas, EMEA, and APAC so assumptions could be checked against real buying and deployment patterns.
Distribution of primary research fieldwork respondents
| Company type | Respondent position | Region |
|---|---|---|
| Top tier: 34% | CXOs: 15% | APAC: 53% |
| Mid tier: 47% | Functional/Unit leaders: 26% | EMEA: 29% |
| Smaller Players: 19% | Managers: 59% | Americas: 18% |
Market-Sizing & Forecasting
Sizing is built using a top-down approach where application-led demand pools are reconstructed, and then converted into value using typical system ASPs and replacement or utilization patterns. In practice, we track where nano biosensors are used most (for example, medical diagnostics and food safety testing), and then tie adoption to indicators such as point-of-care testing expansion, chronic disease screening loads, environmental monitoring activity, and industrial process control needs.
The totals are then cross-checked using selective bottom-up approximations, such as sampling supplier portfolios, estimating unit volumes through channel discussions, and applying a realistic ASP band by platform (for example, electrochemical versus optical). Where disclosure gaps exist, ranges are set first and narrowed using interview-backed splits, followed by a final reconciliation so regional totals remain consistent with known deployment intensity. Forecasts are produced using scenario analysis with a light multivariate structure, where the main drivers (healthcare access, testing decentralization, regulation intensity, and platform cost-down) are moved together based on what experts expect over the next five years.
Data Validation & Update Cycle
Validation is done through multiple passes, since early model outputs can overreact to one strong indicator like rapid diagnostics or wearable uptake. We check for outliers by comparing implied unit volumes, implied ASPs, and regional growth rates against independent signals, and then revisit assumptions when the numbers look stretched.
Before sign-off, the work is reviewed step by step, and follow-up calls are triggered when a key input such as a pricing trend, adoption speed, or application mix shifts the model materially. Reports refresh annually, and interim updates are added when major events affect demand or pricing, followed by a final pre-delivery review so clients receive the latest view.
Mordor Intelligence's Global Nano Biosensors Market Market Size Measured Against Other Published Estimates
Published market sizes for nano biosensors often do not match because the timing, the pricing logic, and the exact scope boundary are handled differently across studies. Differences also show up when one estimate leans heavily on a single demand proxy, while another spreads demand across several applications and then reconciles the totals.
A common gap driver is refresh cadence and currency timing, where an older price deck or an early-year FX rate is kept unchanged even though selling prices and mix can move within months. Another driver is how ASPs are treated across platforms and end uses, since counting high-spec medical diagnostic systems the same way as lower-cost environmental monitoring deployments can lift the average unrealistically. These checks are updated on a set cadence and re-validated through follow-up interviews in the market model used by Mordor Intelligence, which is why the market value can land far from smaller-scope or older-vintage snapshots.
Benchmark comparison
| Source | Market Size | Gaps in Research Methodology |
|---|---|---|
| Mordor Intelligence | USD 15.80 B (2026) | |
| Global Consultancy A | USD 0.63 B (2024) | Uses an earlier base year and a much narrower revenue capture, which typically undercounts medical diagnostics scale and broader end-use adoption, and it can also hold older ASP levels without rechecking platform mix. |
| Industry Publisher B | USD 10.87 B (2025) | Starts from a different base year and groups technology types in a way that can blend nano-enabled and adjacent sensing revenues, and the pricing build can vary if FX timing and ASP declines are not refreshed consistently. |
Taken together, the spread is mainly explained by when the estimate is anchored, what gets counted as nano biosensor revenue, and how platform-level ASPs are kept current. By keeping the steps traceable to adoption indicators and then reconciling them with practical price and mix checks, the resulting number stays balanced and repeatable.


Key Questions Answered in the Report
What is the current value of the nano biosensors market?
The nano biosensors market size stands at USD 15.8 billion in 2026.
How fast is the nano biosensors market expected to grow?
It is projected to register an 8.36% CAGR and reach USD 23.55 billion by 2031.
Which sensor type leads revenue today?
Electrochemical architectures hold the largest 39.72% revenue share.
Which region is forecast to grow the quickest?
Asia-Pacific is expected to deliver a 9.86% CAGR through 2031.
What segment is expanding fastest by application?
Food-safety testing is advancing at a 9.22% CAGR, propelled by stricter pathogen-screening mandates.
How concentrated is competition among leading companies?
The combined share of the top five suppliers is 42%, indicating moderate fragmentation and ongoing room for new entrants.
Page last updated on:





