Market Overview
| Study Period | 2020 - 2031 |
|---|---|
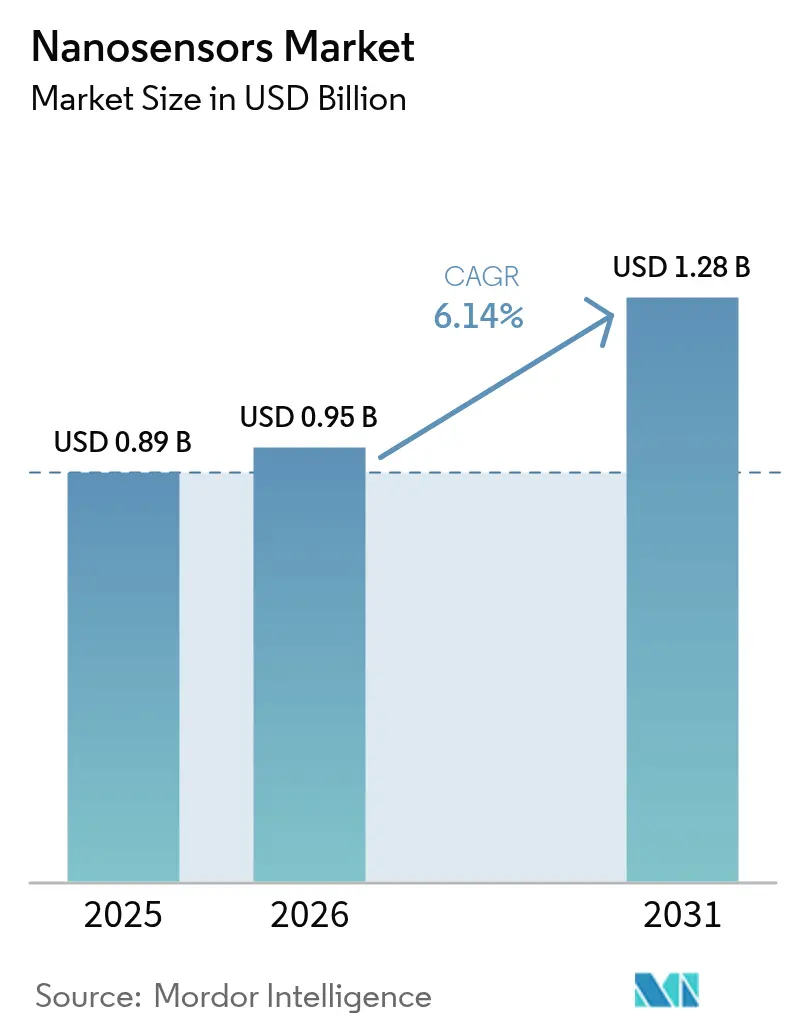
| Market Size (2026) | USD 0.95 Billion |
| Market Size (2031) | USD 1.28 Billion |
| Growth Rate (2026 - 2031) | 6.14% CAGR |
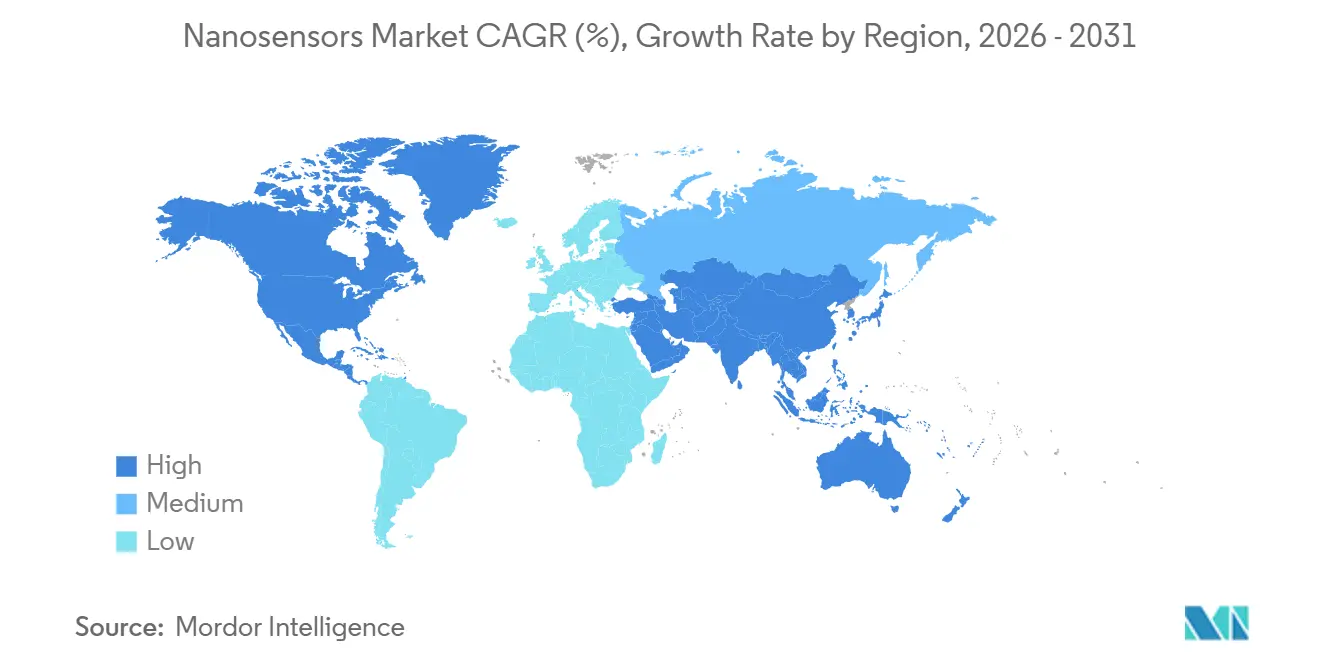
| Fastest Growing Market | Asia Pacific |
| Largest Market | North America |
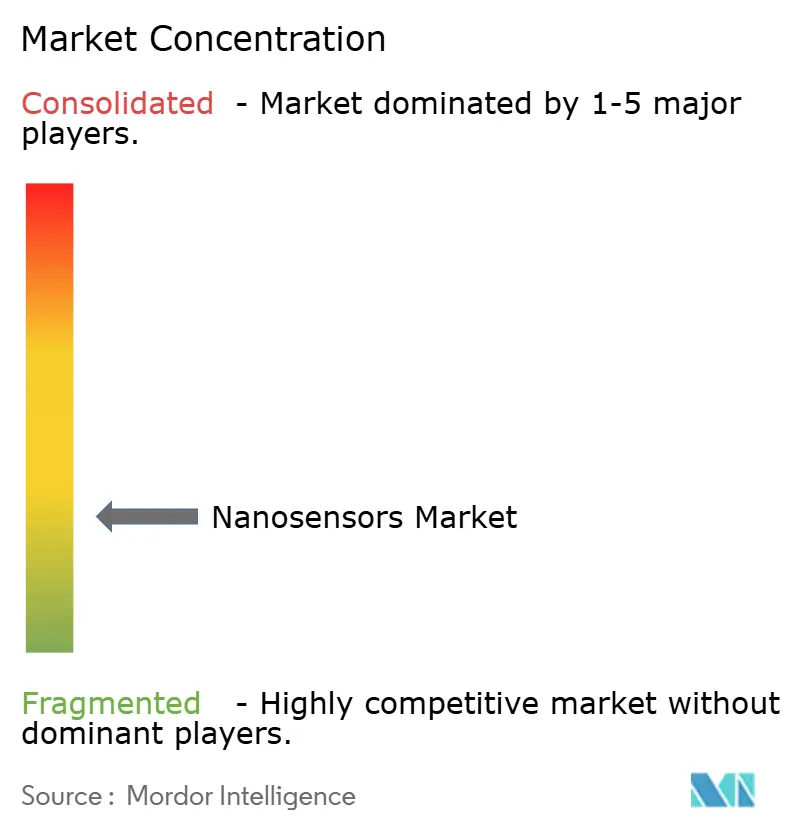
| Market Concentration | Low |
Major Players *Disclaimer: Major Players sorted in no particular order Image © Mordor Intelligence. Reuse requires attribution under CC BY 4.0. | |
Nanosensors Market Analysis by Mordor Intelligence
The nanosensors market size is projected to be USD 0.89 billion in 2025, USD 0.95 billion in 2026, and reach USD 1.28 billion by 2031, growing at a CAGR of 6.14% from 2026 to 2031. Advances in edge artificial intelligence are moving sensing tasks from centralized clouds to local silicon, eliminating latency and lowering power budgets. This shift is speeding adoption across healthcare, smart manufacturing, and consumer electronics as developers prioritize always-on, low-energy data capture. Standardization of two-dimensional materials is easing integration of nanosensors into flexible substrates, opening waterproof and skin-mounted form factors that traditional silicon cannot serve. Meanwhile, government grants, especially in the United States and China, are funding pilot lines that convert laboratory prototypes into high-volume production, helping vendors close the yield gap that has long capped commercial scale. Competitive intensity is rising as semiconductor majors bundle nano sensing with logic and memory, shrinking bill-of-materials costs for connected devices.
Key Report Takeaways
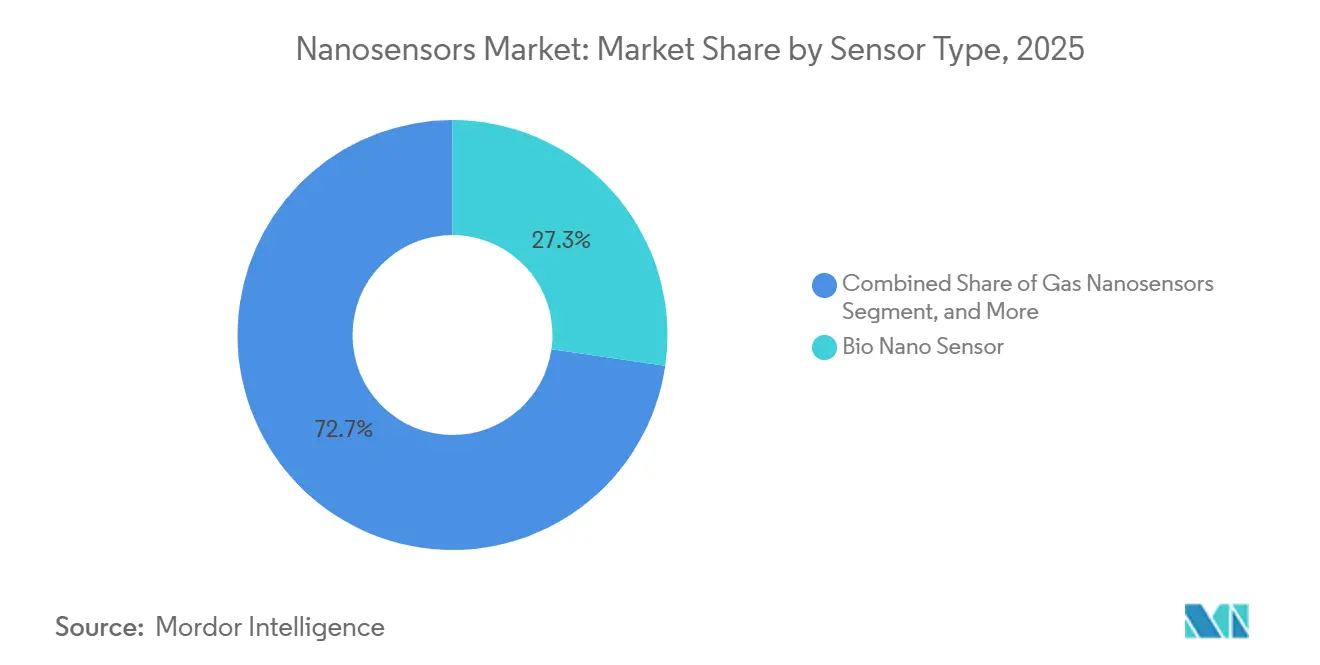
- By sensor type, biological platforms led with 27.28% of the nanosensors market share in 2025, while gas detection sensors are projected to expand at a 6.87% CAGR through 2031.
- By end-use vertical, healthcare held 31.19% of the nanosensors market share in 2025, and environmental monitoring is forecast to grow at a 6.96% CAGR to 2031.
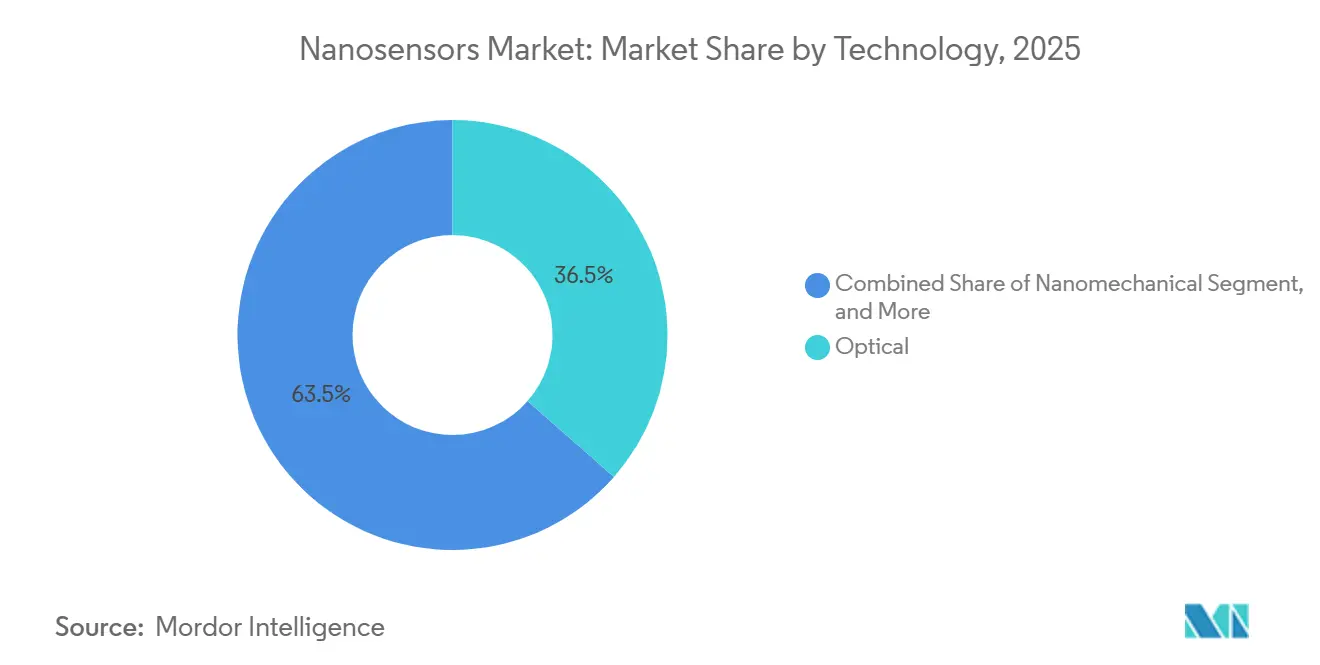
- By technology, optical methods accounted for 36.48% share of the nanosensors market size in 2025 and nanomechanical platforms are advancing at a 6.73% CAGR to 2031.
- By nanomaterial, carbon-based materials captured 42.84% share of the nanosensors market size in 2025, while two-dimensional materials are projected at a 7.11% CAGR to 2031.
- By geography, North America led with 34.66% of the nanosensors market share in 2025, though Asia-Pacific is set to expand at a 7.23% CAGR through 2031.
Note: Market size and forecast figures in this report are generated using Mordor Intelligence’s proprietary estimation framework, updated with the latest available data and insights as of 2026.
Global Nanosensors Market Trends and Insights
Drivers Impact Analysis*
| Driver | (~) % Impact on CAGR Forecast | Geographic Relevance | Impact Timeline |
|---|---|---|---|
| Edge-AI Enabled Autonomous Nanosensor Networks | +1.20% | Global, with early adoption in North America and Asia-Pacific | Medium term (2-4 years) |
| Miniaturization of Electronics and Wearables Integration | +1.10% | Global, led by North America, Europe, and Asia-Pacific | Short term (≤ 2 years) |
| Rapid Expansion of Point-of-Care Diagnostics | +1.00% | Global, with accelerated uptake in North America and Europe | Short term (≤ 2 years) |
| Surge in Industrial Predictive-Maintenance IoT Deployments | +0.90% | Global, concentrated in North America, Europe, and Asia-Pacific industrial hubs | Medium term (2-4 years) |
| Government-Funded Nanotech Research Programmes | +0.80% | North America, Europe, and Asia-Pacific (China, Japan, South Korea) | Long term (≥ 4 years) |
| Quantum-Dot Cost Curve Improvements | +0.70% | Global, with manufacturing concentration in Asia-Pacific | Medium term (2-4 years) |
| Source: Mordor Intelligence | |||
Edge-AI Enabled Autonomous Nanosensor Networks
Local inference engines are cutting response times from hundreds of milliseconds to under 10 milliseconds, a threshold that enables collision-avoidance in autonomous robots and gesture recognition in wearables.[1]Bosch Sensortec, “BHI385 IMU with On-Device AI,” bosch-sensortec.com Samsung embedded TensorFlow Lite on its biosensor silicon in 2025 so glucose monitors can flag hypoglycaemia 30 minutes ahead of onset without cloud calls.[2]Samsung Electronics, “TensorFlow Lite Biosensor Integration,” samsung.com The battery savings extend device uptime from 2-3 days to a full week, supporting untethered user experiences. Sensor nodes now calibrate against neighbouring peers, reducing drift in remote air-quality arrays where backhaul bandwidth is scarce. Vendors that pair nanosensors with on-chip neural accelerators are building durable performance moats.
Miniaturization of Electronics and Wearables Integration
Form factors below 5 millimetres are letting nanosensors slip under the skin or into the eye, broadening continuous monitoring options for athletes and glaucoma patients. Nanowear knit carbon-nanotube strain gauges into fabric to capture cardiac bioimpedance, surpassing chest-strap spatial resolution. Breakthrough device designations for three nanosensor wearables in 2025 shortened U.S. review cycles, nudging commercial launches forward. Smartphone makers now integrate gas nanosensors that alert users to indoor formaldehyde, giving premium phones a tangible wellness hook. Sub-millimetre shrink, however, raises power density beyond 10 W/cm², forcing the industry to explore microchannel cooling and novel heat spreaders.
Rapid Expansion of Point-of-Care Diagnostics
Handheld analysers armed with electrochemical nanosensors cut test times from 24 hours to under 15 minutes, enabling same-visit treatment. Roche’s malaria handheld hits 95% sensitivity at the pharmacy counter.[3]Roche, “Cobas Liat Malaria Assay,” roche.com A blood-based Alzheimer’s screen measures tau-217 with 89% concordance to PET scans, turning what was a hospital procedure into a primary-care service. In rural clinics lacking refrigeration, Medtronic deployed 5,000 glucose nanosensor kits that tolerate ambient temperatures. Lower logistics overhead trims test costs by 30-40%, building a solid reimbursement case.
Surge in Industrial Predictive-Maintenance IoT Deployments
Factories are pressing nanosensors into rotating hardware so faults surface weeks before catastrophic failure. Honeywell’s piezoelectric package resolves sub-micrometre shaft wobble, slashing unexpected downtime by a quarter. Gas nanosensors in chemical plants can now distinguish between 12 volatile compounds, preventing facility-wide shutdowns when only a single refrigerant line leaks. Lockheed Martin’s infrared nanosensors track jet-engine heat in flight, extending overhaul intervals and saving millions per airframe. Digital twins fed by nanosensor data predict degradation scenarios, guiding maintenance crews with data-driven schedules.
Restraints Impact Analysis*
| Restraint | (~) % Impact on CAGR Forecast | Geographic Relevance | Impact Timeline |
|---|---|---|---|
| Complex Nanofabrication Scalability Bottlenecks | -0.80% | Global, with acute challenges in North America and Europe high-volume manufacturing | Medium term (2-4 years) |
| Regulatory Lag on Nano-Toxicology Standards | -0.60% | Global, particularly impacting North America and Europe market entry timelines | Long term (≥ 4 years) |
| Signal Drift in High-Humidity Field Environments | -0.40% | Global, with pronounced effects in tropical and coastal regions | Short term (≤ 2 years) |
| Supply-Chain Concentration of High-Purity SWCNTs | -0.50% | Global, with dependencies on Asia-Pacific suppliers | Medium term (2-4 years) |
| Source: Mordor Intelligence | |||
Complex Nanofabrication Scalability Bottlenecks
Yield drops of 30% appear when designs move from 150 mm research wafers to 300 mm production, eroding margins. Electron-beam patterning crawls at under 10 wafers an hour, and stiction still kills nanomechanical structures in release etch. STMicroelectronics reported yields under 65% before recent process tweaks. Atomic-layer deposition, the route to defect-free films, coats at a pace of one angstrom per cycle, limiting daily output. These headwinds delay scale-up of quantum nanosensors that need sub-ppb defect densities to maintain coherence.
Regulatory Lag on Nano-Toxicology Standards
Medical implants and ingestible sensors face 18–24-month extensions in review because safety protocols remain unsettled. ISO vocabulary exists, but detailed cytotoxicity assays are still in draft. FDA guidance is a decade old and predates two-dimensional material use, leaving innovators without a template. Under European Union REACH, each nanomaterial variant demands separate registration, with testing fees topping EUR 500,000 (USD 565,000). Startups often lack capital to run parallel studies, chilling entry of novel form factors.
*Our forecasts treat driver/restraint impacts as directional, not additive. The impact forecasts reflect baseline growth, mix effects, and variable interactions.
Segment Analysis
By Sensor Type: Biological Platforms Lead, Gas Detection Accelerates
Biological devices captured 27.28% of the nanosensors market share in 2025 as their femtomolar limits of detection brought early cancer and infectious-disease screens into routine care. Gas sensors are on course for a 6.87% CAGR to 2031, spurred by industrial emission rules and cabin air-quality features in automobiles. Chemical formats remain relevant, using nanoparticle colour shifts for quick readouts in field water tests. Physical sensors translate strain and temperature into electrical signals, guarding bridges and aircraft from hidden cracks. Quantum approaches, though small today, map subsurface magnetics for mineral exploration at micrometre resolution. Smartphone OEMs now bundle gas detection beside cameras to freshen product roadmaps, while lab equipment makers mix biological and chemical channels on a single chip to flag pathogens and toxins simultaneously.
Adoption patterns are tiered. Hospitals gravitate toward biological and optical integrations, whereas heavy industry leans on robust gas and physical formats that tolerate heat and vibration. Regulatory approvals in oncology diagnostics validate performance claims, driving clinical demand. Consumer interest rises when sensors deliver immediate, actionable insights, such as alerting to carbon monoxide or allergens. The hybridization trend is therefore widening, with vendors layering gas and biological stacks to spot both chemical leaks and microbial contamination in food facilities. The nanosensors market continues to pivot on versatility, rewarding suppliers that fuse multiple transduction paths with shared readout electronics.


By End-Use Vertical: Healthcare Dominates, Environmental Monitoring Surges
Healthcare generated 31.19% of 2025 revenue and continues to absorb volume thanks to insurance codes favouring rapid diagnostics and continuous monitoring. Hospitals, pharmacies, and home-care providers value test-when-needed workflows that shorten clinical decision cycles. Environmental networks, projected at a 6.96% CAGR, draw municipal and industrial budgets aiming to track pollutants in real time. Consumer electronics brands exploit nanosensors to differentiate wearables, embedding hydration and glucose estimators that support fitness apps. Aerospace and defense integrate chemical threat sensors sensitive to parts-per-billion, so soldiers receive early warnings well before exposure thresholds.
Industrial and automotive customers rely on vibration and temperature nanosensors for predictive maintenance, shaving 30-40% of unplanned downtime. Energy utilities outfit transformers with nano-enabled oil monitors to avert million-dollar failures. Medtronic’s once-per-14-day calibration glucose patch lowered user burden, demonstrating that incremental workflow gains can tilt adoption curves. In environmental monitoring, the United States mandated hourly particulate reports, forcing 20,000 new sensor nodes onto factory stacks. Each vertical’s growth hinges on balancing cost with specificity. The nanosensors market size for environmental deployments gains from falling per-node prices, while healthcare’s margin profile remains attractive due to reimbursed disposables.
By Technology: Optical Methods Prevail, Nanomechanical Gains Momentum
Optical platforms held 36.48% of 2025 demand, propelled by surface plasmon resonance chips that watch biomolecules bind in real time without labels. Nanomechanical devices should rise at a 6.73% CAGR through 2031 as cantilevers hit atto-gram mass resolution and single-virus detection becomes critical for pandemic readiness. Electrochemical readouts stay fundamental to glucose and heavy-metal assays were current flow tracks analyte concentration. Electromagnetic resonators monitor cold-chain integrity by sensing frequency shifts, and piezoelectric stacks harvest mechanical stress in aircraft wings to reveal hidden fractures.
Agilent fused photonic waveguides with microfluidics to screen 96 protein markers from a pinprick of blood, proving multiplex economics. Nanomechanical resonators now underpin portable mass spectrometers for field forensics. Optical’s leadership persists because laboratories already run fluorescence and spectral gear, letting staff adopt nanosensor cartridges with minimal retraining. Yet hardware roadmaps hint at blended systems that pick whichever transduction yields the cleanest signal for a given target. Competition therefore revolves around software that reconciles multimodal data.
By Nanomaterial: Carbon Dominance Persists, Two-Dimensional Materials Ascend
Carbon architectures generated 42.84% of 2025 revenue, benefitting from mature single-walled carbon nanotube supply lines and electron mobilities that support picoampere detection. Two-dimensional alternatives, forecast at 7.11% CAGR, grant transparent, flexible layers for next-gen wearables. Gold and silver nanoparticles dominate low-cost colorimetric strips, while semiconductor quantum dots unlock multiplex fluorescence in drug discovery. Polymer nanocomposites marry flexibility with chemical selectivity, permitting conformal, sweat-resistant patches.
Samsung’s USD 110 million partnership with GRAIL targets the graphene capture of circulating tumor DNA. Supply concentration remains a red flag as only a handful of refiners hit electronic-grade nanotube purity, and spot shortages have inflated prices by 20%. Meanwhile, wafer-scale chemical vapor deposition lowered graphene cost from USD 500/cm² in 2024 to under USD 50 by 2026, tipping the cost-benefit in favour of two-dimensional roll-to-roll production. Material choice increasingly dictates both sensor sensitivity and manufacturing economics, making sourcing strategy a pivotal element of competitive advantage in the nanosensors market.
Geography Analysis
North America led the nano sensors market in 2025 with a 34.66% revenue share, supported by National Science Foundation grants surpassing USD 200 million a year. The United States secures most of the region’s intake thanks to Food and Drug Administration approvals that accelerate clinical rollouts and Department of Defense contracts that anchor aerospace demand. Canada focuses on mining and environmental deployments, using nanosensors to trace tailings-pond leaks before they threaten waterways. Mexico’s automotive clusters embed predictive-maintenance packages in assembly plants, though local fabrication remains limited.
Europe contributes a diverse research base but grapples with protracted certification under REACH, stretching time-to-market by up to 18 months. Germany and France funnel funding into Industry 4.0 retrofits, and the United Kingdom promotes breath-based diagnostics through public-private consortia. Southern Europe prioritizes agricultural soil-sensor pilots to manage water scarcity. Overall uptake is steady but trails the United States because compliance costs raise launch thresholds.
Asia-Pacific is the fastest mover, projected at a 7.23% CAGR, as China ramps fab capacity under its 14th Five-Year Plan and Japan’s Society 5.0 embeds sensors throughout urban grids. South Korea’s memory giants intersect nanosensors with storage, producing self-calibrating smart nodes. India’s smart-city program equips municipal buses with air-quality nanosensors so residents receive pollution alerts via mobile apps, though funding cycles can slow coverage. Southeast Asia, led by Singapore, incubates startups that merge nanosensors with blockchain traceability in food supply chains.
South America and the Middle East pursue early-stage pilots. Brazil tests soil nutrient nanosensors to optimize fertilizer use, while the United Arab Emirates installs water-line detectors that stop leaks in desert infrastructure. Africa is nascent but gaining proof points; South Africa’s science council deployed 500 air-quality nodes in 2025, illustrating a path to continent-wide networks once donor funding stabilizes. Infrastructure readiness, regulatory clarity, and local manufacturing depth will determine the pace at which each region scales its share of the nanosensors market size.

Competitive Landscape
The nanosensors market features moderate fragmentation with incumbents such as Agilent Technologies and Bruker leveraging installed lab instruments to attach nanosensor modules. Semiconductor majors, including STMicroelectronics and Samsung Electronics, integrate nanosensors into microelectromechanical portfolios, using existing clean rooms to undercut standalone sensor houses on cost. Startups like Nanowear and Applied Nanodetectors specialize in textiles or gas analytics, targeting niches untouched by broad-line suppliers.
Differentiation hinges on nanomaterial selection and transduction architecture. Honeywell filed 47 patents in 2025 around temperature-resilient piezoelectric composites, illustrating the race to own foundational intellectual property. Collaboration is another lever; sensor makers pair with pharmaceutical firms to create companion diagnostics that feed recurring reagent sales outperforming hardware margins. Regulatory arbitrage also appears wellness gadgets bypass medical classification by labelling outputs informational, cutting approval cycles to under a year.
Pricing pressure intensifies as consumer electronics brands bundle multiple sensors in single chips. Vendors that can co-fabricate logic, memory, and sensing enjoy a structural cost lead. Yet performance remains paramount for clinical and aerospace clients unwilling to trade accuracy for price. Consequently, the competitive field bifurcates into high-accuracy specialists and cost-optimized generalists, with mid-tier players squeezed. Mergers and targeted acquisitions are expected as firms fill technology gaps and seek breadth across end markets.
Nanosensors Industry Leaders
Agilent Technologies Inc.
Analog Devices Inc.
Honeywell International Inc.
OMRON Corporation
Bruker Corporation
- *Disclaimer: Major Players sorted in no particular order

Recent Industry Developments
- January 2026: Samsung Electronics expanded its collaboration with GRAIL, investing an additional USD 110 million to integrate graphene nanosensors into multi-cancer screening platforms targeting Asian markets.
- December 2025: Hoffmann-La Roche received U.S. FDA approval for its blood-based Alzheimer’s test built on gold-nanoparticle electrodes with 89% PET scan concordance.
- November 2025: Lockheed Martin secured a USD 132.4 million contract to equip F/A-18 fighters with infrared nanosensors that extend engine overhaul intervals by 15%.
- October 2025: Bosch Sensortec launched the BMV080 particulate sensor, using metal-oxide nanosensors to match reference equipment at one-fiftieth the cost.


Global Nanosensors Market Report Scope
The Nanosensors Market Report is Segmented by Sensor Type (Biological, Chemical, Physical, Quantum, Gas), End-Use Vertical (Healthcare, Consumer Electronics, Aerospace and Defence, Automotive and Industrial, Energy and Power Generation, Environmental Monitoring), Technology (Electrochemical, Optical, Electromagnetic, Piezoelectric, Nanomechanical), Nanomaterial (Carbon-Based, Metal-Based Nanoparticles, Semiconductor Quantum Dots, Polymer-Based Nanocomposites, Two-Dimensional Materials), and Geography (North America, South America, Europe, Asia-Pacific, Middle East, Africa). The Market Forecasts are Provided in Terms of Value (USD).
By Sensor Type
| Biological Nanosensors |
| Chemical Nanosensors |
| Physical Nanosensors |
| Quantum Nanosensors |
| Gas Nanosensors |
By End-Use Vertical
| Healthcare |
| Consumer Electronics |
| Aerospace And Defence |
| Automotive And Industrial |
| Energy And Power Generation |
| Environmental Monitoring |
By Technology
| Electrochemical |
| Optical |
| Electromagnetic |
| Piezoelectric |
| Nanomechanical |
By Nanomaterial
| Carbon-Based Nanomaterials |
| Metal-Based Nanoparticles |
| Semiconductor Quantum Dots |
| Polymer-Based Nanocomposites |
| Two-Dimensional Materials (Graphene, TMDCs) |
By Geography
| North America | United States |
| Canada | |
| Mexico | |
| South America | Brazil |
| Argentina | |
| Rest Of South America | |
| Europe | Germany |
| United Kingdom | |
| France | |
| Italy | |
| Spain | |
| Russia | |
| Rest Of Europe | |
| Asia-Pacific | China |
| Japan | |
| India | |
| South Korea | |
| South-East Asia | |
| Rest Of Asia-Pacific | |
| Middle East | Saudi Arabia |
| United Arab Emirates | |
| Rest Of Middle East | |
| Africa | South Africa |
| Egypt | |
| Rest Of Africa |
| By Sensor Type | Biological Nanosensors | |
| Chemical Nanosensors | ||
| Physical Nanosensors | ||
| Quantum Nanosensors | ||
| Gas Nanosensors | ||
| By End-Use Vertical | Healthcare | |
| Consumer Electronics | ||
| Aerospace And Defence | ||
| Automotive And Industrial | ||
| Energy And Power Generation | ||
| Environmental Monitoring | ||
| By Technology | Electrochemical | |
| Optical | ||
| Electromagnetic | ||
| Piezoelectric | ||
| Nanomechanical | ||
| By Nanomaterial | Carbon-Based Nanomaterials | |
| Metal-Based Nanoparticles | ||
| Semiconductor Quantum Dots | ||
| Polymer-Based Nanocomposites | ||
| Two-Dimensional Materials (Graphene, TMDCs) | ||
| By Geography | North America | United States |
| Canada | ||
| Mexico | ||
| South America | Brazil | |
| Argentina | ||
| Rest Of South America | ||
| Europe | Germany | |
| United Kingdom | ||
| France | ||
| Italy | ||
| Spain | ||
| Russia | ||
| Rest Of Europe | ||
| Asia-Pacific | China | |
| Japan | ||
| India | ||
| South Korea | ||
| South-East Asia | ||
| Rest Of Asia-Pacific | ||
| Middle East | Saudi Arabia | |
| United Arab Emirates | ||
| Rest Of Middle East | ||
| Africa | South Africa | |
| Egypt | ||
| Rest Of Africa | ||


Key Questions Answered in the Report
How large will the nanosensors market be by 2031?
It is projected to reach USD 1.28 billion, reflecting a 6.14% CAGR over 2026-2031.
Which sensor type currently generates the most revenue?
Biological platforms lead, holding 27.28% share in 2025.
What vertical is growing fastest through 2031?
Environmental monitoring shows the highest projected CAGR at 6.96%.
Why are two-dimensional materials gaining traction?
Falling wafer-scale synthesis costs and superior flexibility drive a 7.11% CAGR for this material class.
Which region is expected to post the quickest growth?
Asia-Pacific, buoyed by government programs, is forecast to expand at 7.23% CAGR.
What is the main barrier to mass production?
Yield loss during scale-up to 300 mm wafers remains the chief bottleneck, trimming overall growth by 0.8%.
Page last updated on:


