Military Fixed Wing Aircraft Market Size and Share
Market Overview
| Study Period | 2020 - 2031 |
|---|---|
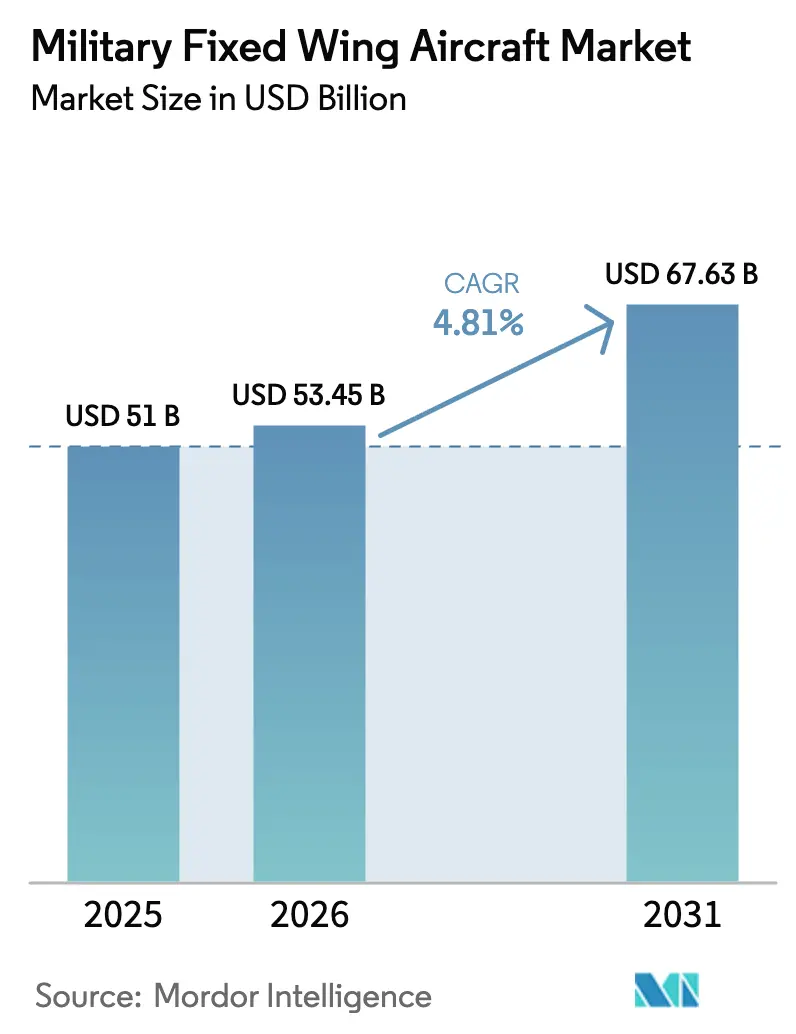
| Market Size (2026) | USD 53.45 Billion |
| Market Size (2031) | USD 67.63 Billion |
| Growth Rate (2026 - 2031) | 4.81% CAGR |
| Fastest Growing Market | Asia Pacific |
| Largest Market | North America |
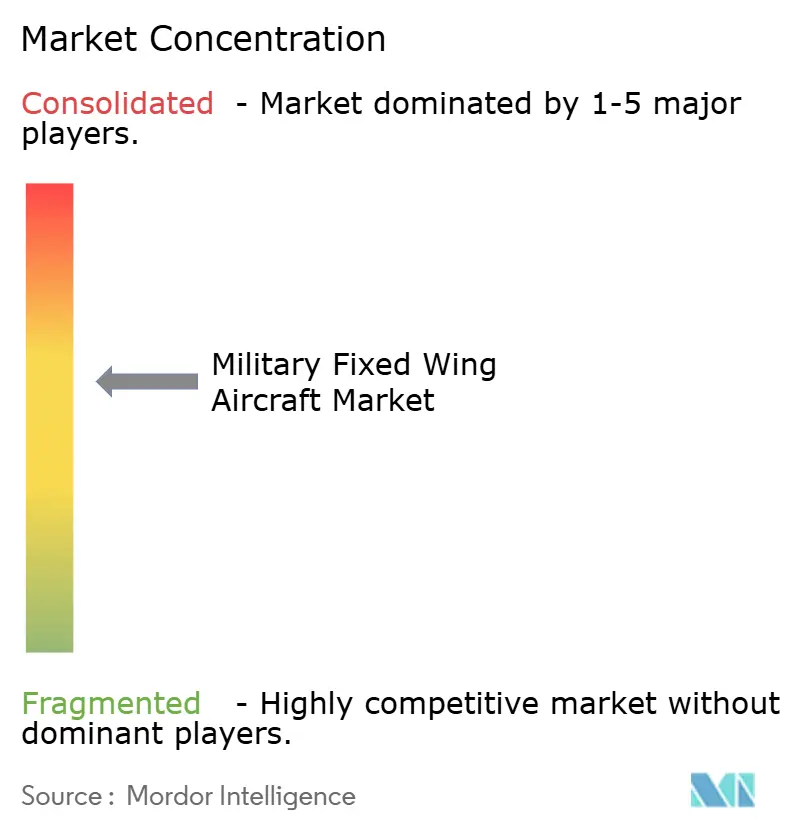
| Market Concentration | Medium |
Major Players *Disclaimer: Major Players sorted in no particular order Image © Mordor Intelligence. Reuse requires attribution under CC BY 4.0. | |
Military Fixed Wing Aircraft Market Analysis by Mordor Intelligence
The military fixed-wing aircraft market size in 2026 is estimated at USD 53.45 billion, growing from 2025 value of USD 51 billion with 2031 projections showing USD 67.63 billion, growing at 4.81% CAGR over 2026-2031. This growth trajectory reflects heightened geopolitical risk, fast-tracking fleet-modernization plans, and stronger defense outlays across North America, Europe, and Asia-Pacific. Air forces are retiring Cold War-era fighters in favor of multi-role designs that compress training, maintenance, and basing costs. At the same time, open-systems architectures shorten upgrade cycles and protect long-term value. Asia-Pacific governments, buoyed by average GDP growth above 4%, continue to allocate larger shares of national budgets to next-generation aircraft that can project power across vast maritime zones. At the same time, complementary demand for pilot trainers, tankers, and intelligence platforms sustains a broad addressable opportunity set for suppliers in the military fixed-wing aircraft market.
Key Report Takeaways
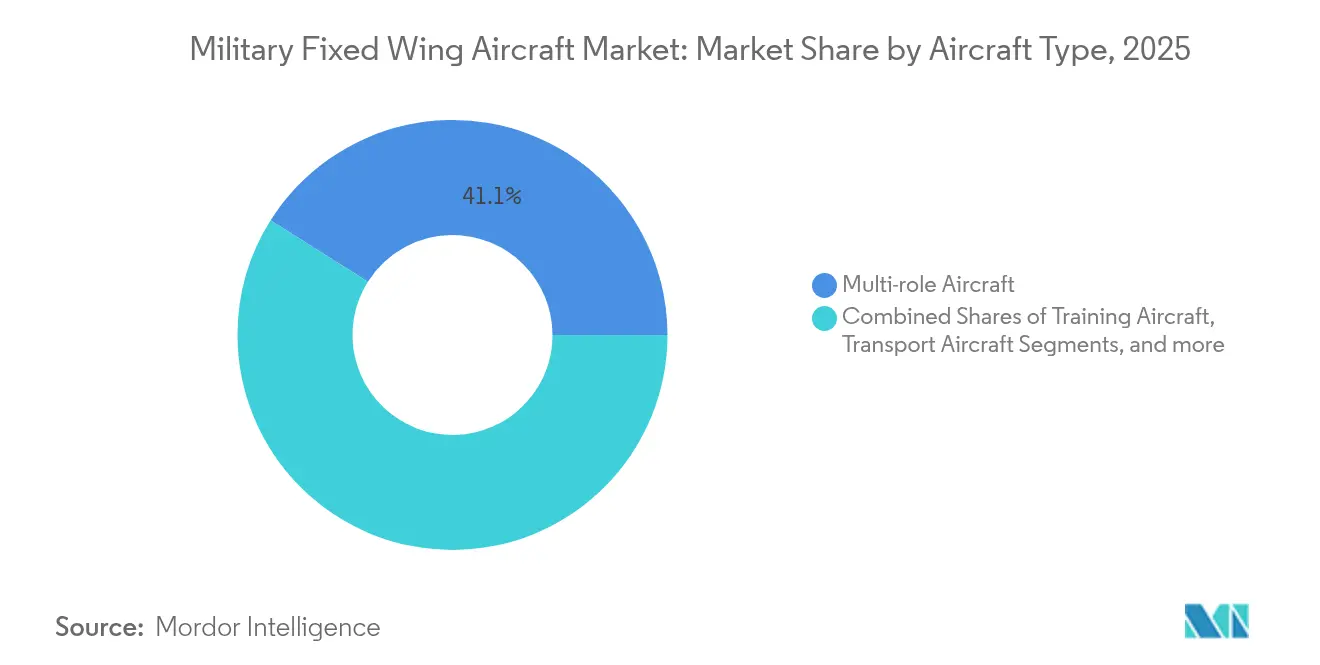
- By aircraft type, multi-role platforms led with 41.05% of the military fixed wing aircraft market share in 2025, while training aircraft are projected to post a 5.85% CAGR through 2031.
- By end-user service, Air Force operations held 41.93% of the military fixed wing aircraft market size in 2025; Joint/Special Operations are tracking the highest growth at 5.54% CAGR to 2031.
- By propulsion type, turbofan systems commanded 64.55% of the military fixed wing aircraft market size in 2025; fully electric/hybrid-electric concepts are on course for a 4.62% CAGR through 2031.
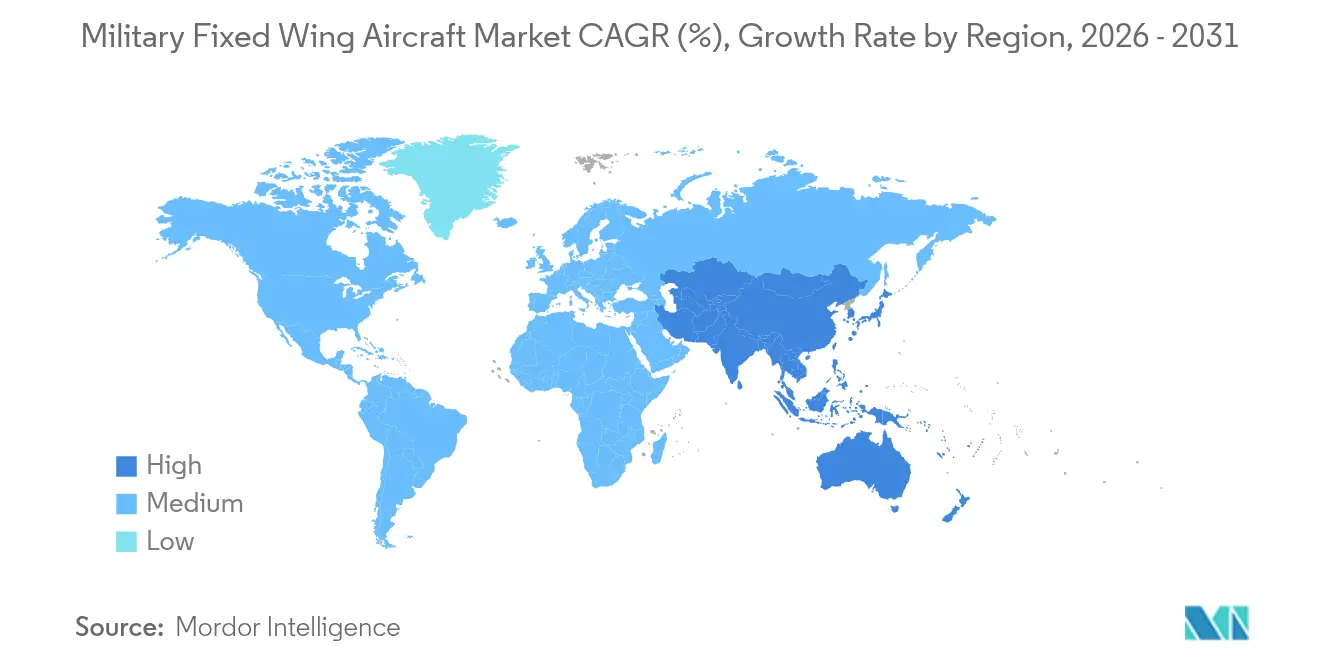
- By geography, North America accounted for 51.10% of the military fixed-wing aircraft market share in 2025, whereas the Asia-Pacific is advancing at a 6.12% CAGR to 2031.
Note: Market size and forecast figures in this report are generated using Mordor Intelligence’s proprietary estimation framework, updated with the latest available data and insights as of 2026.
Global Military Fixed Wing Aircraft Market Trends and Insights
Driver Impact Analysis*
| Driver | (~) % Impact on CAGR Forecast | Geographic Relevance | Impact Timeline |
|---|---|---|---|
| Geopolitical flashpoints accelerating combat aircraft procurement | +1.2% | Eastern Europe, Indo-Pacific | Short term (≤ 2 years) |
| Rapid fleet-modernization cycles to replace aging Cold War inventory | +1.8% | North America, Europe, select APAC allies | Medium term (2-4 years) |
| Rising Asia-Pacific defense budgets backed by sustained GDP growth | +1.1% | Core APAC, spill-over to Middle East | Long term (≥ 4 years) |
| Multirole platform preference lowering life-cycle costs | +0.7% | Global | Medium term (2-4 years) |
| Modular open systems architecture enabling plug-and-play upgrades | +0.5% | North America, Europe, Japan, Australia | Long term (≥ 4 years) |
| Loyal-Wingman’ demand creating new manned aircraft procurement synergies | +0.4% | United States, Australia, Europe | Long term (≥ 4 years) |
| Source: Mordor Intelligence | |||
Geopolitical Flashpoints Accelerating Fighter Procurement
Russia’s war on Ukraine galvanized European governments to hit NATO’s 2%-of-GDP spending pledge, pulling multi-year fighter orders forward and injecting immediate volume into the military fixed-wing aircraft market.[1]North Atlantic Treaty Organization, “Defence Expenditure of NATO Countries 2024,” nato.int Poland’s 32-unit F-35A contract, worth USD 3 billion, exemplifies the scale of near-term upsizing, while Germany’s Eurofighter Typhoon reorder sustains dual-use air-policing and nuclear-sharing tasks. Across the Indo-Pacific, China’s escalating air incursions spurred Japan to raise its defense budget by 26% annually through 2027, foregrounding F-35, F-15EX, and next-generation fighter programs.[2]Japanese Ministry of Defense, “Medium-Term Defense Program 2024–2028,” mod.go.jp Australia’s USD 11 billion fleet of 72 F-35As underpins allied interoperability, and the Quad framework intensifies demand for platform commonality. These accelerants feed directly into higher production-run stability for prime contractors in the military fixed-wing aircraft market.
Rapid Fleet-modernization Cycles to Replace Aging Cold-War Inventory
Roughly 3,000 NATO combat aircraft average more than 25 years in service, with maintenance downtime and obsolescent avionics cutting into readiness metrics. The US Air Force’s 690-strong F-16 bloc has airframes pushing 9,000 flight hours; replacement with F-35As is essential for air-superiority parity versus peer threats.[3]US Air Force, “Pilot Training Next,” af.mil Germany is working against a 2030 sunset date for Tornado strike fighters, obliging a direct transition to stealth strike capabilities. Because incremental retrofits cannot resolve airframe fatigue and integration limits, full-fleet recapitalization becomes more economical, elevating unit demand across the military fixed-wing aircraft market.
Rising Asia-Pacific Defense Budgets Backed by Sustained GDP Growth
Regional military expenditure hit USD 575 billion in 2024, up 8.2% year-over-year, and is forecast to outpace global averages through 2030.[4]Stockholm International Peace Research Institute, “Military Expenditure Database 2024,” sipri.org Japan assigns 43% of its FY-2025 budget to aircraft procurement, funding 105 additional F-35A/B jets and seed money for an indigenous sixth-generation fighter worth USD 40 billion by 2030. South Korea channels USD 8.8 billion into the KF-21 Boramae program, nurturing domestic supply-chain autonomy and export positioning across Southeast Asia. Australia’s USD 270 billion force structure plan earmarks more than USD 60 billion for air-combat and maritime patrol capabilities, stitching broad upside into the military fixed-wing aircraft market.
Multirole Platform Preference Lowering Life-cycle Costs
Air forces now prize aircraft that switch seamlessly among air-to-air, air-to-ground, and ISR tasking. The F-35 delivers 30% lower training expense by consolidating multiple mission cadres into one type course. Germany streamlined from seven combat-aircraft lines in 1990 to three today, cutting spare-parts inventories and hangar footprints. Emerging operators in Southeast Asia and Latin America opt for the Gripen E and Super Hornet solutions that embed diverse ordnance options and plug-and-play datalinks, optimizing affordability inside the military fixed-wing aircraft market.
Restraint Impact Analysis*
| Restraint | (~) % Impact on CAGR Forecast | Geographic Relevance | Impact Timeline |
|---|---|---|---|
| Lengthy development and certification timelines | –0.8% | Global, acute in complex multi-role projects | Long term (≥ 4 years) |
| Ballooning program costs triggering order deferrals | –1.2% | High-cost fighter programs worldwide | Medium term (2-4 years) |
| Budget diversion toward unmanned/cyber-warfare capabilities | –0.6% | United States, Europe, Asia-Pacific | Medium term (2-4 years) |
| Export-control and technology-transfer restrictions | –0.4% | Emerging markets | Short term (≤ 2 years) |
| Source: Mordor Intelligence | |||
Lengthy Development and Certification Timelines
Contemporary combat-aircraft efforts average 15-20 years from concept to operational readiness, mainly due to software integration and cyber-resilience testing that now swallow 60-plus percent of the schedule. The F-35 required 23 years to reach IOC, underscoring how delays compound cost and inventory risk. Multinational programs such as the A400M saw an eight-year slippage, adding 40% to unit cost. Compliance with evolving cybersecurity frameworks typically extends flight-test phases by two years. These lags slow new-platform inflow and cap near-term upside in the military fixed-wing aircraft market.
Ballooning Program Costs Triggering Order Deferrals
Inflation-adjusted combat-aircraft unit prices climbed twice the rate of headline CPI over the past decade. The F-35 stands at USD 109 million per tail in 2024, leading several partner states to trim planned buys by up to 25%. Germany delayed Eurofighter batches to manage treasury ceilings despite committed capability goals. The B-21 Raider program pared targets from 165 to 100 bombers, proving how overruns directly curtail fleet sizing. This dynamic restrains the total accessible volume of the military fixed-wing aircraft market.
*Our forecasts treat driver/restraint impacts as directional, not additive. The impact forecasts reflect baseline growth, mix effects, and variable interactions.
Segment Analysis
By Aircraft Type: Multi-role Platforms Dominate Modernization Priorities
Multi-role fighters accounted for 41.05% of the military fixed-wing aircraft market share in 2025, reflecting operator demand for single-platform versatility across air-to-air, air-to-ground, and ISR tasking. Training aircraft represent the highest-growth niche, with a 5.85% CAGR through 2031, as air arms rush to backfill pilot pipelines with digitally networked simulators and live-fly assets.
The F-35 program’s delivery tally surpassed 890 units worldwide by 2025 and showcases how a standard airframe reduces life-cycle outlays and eases coalition interoperability. Transport programs like the C-130J and A400M continue to turn over legacy fleets, though growth is flatter because many nations completed replacements in the past decade. Specialized EW and maritime patrol variants form a smaller but indispensable layer that remains stable through targeted recapitalization budgets. Collectively, these trends amplify breadth within the military fixed-wing aircraft market.


By End-User Service: Air Force Operations Lead While Joint Missions Accelerate
Air Force operators held 41.93% of the military fixed-wing aircraft market in 2025, owing to their statutory role in air superiority and strategic strike domains. Joint/Special Operations units exhibit the fastest trajectory at a 5.54% CAGR, mirroring expanded counterterrorism and irregular warfare tasking worldwide.
The CV-22 Osprey, with over 400 aircraft in service, typifies how joint formations rely on specialized fixed-wing lift for rapid infiltration. Naval/Marine Corps Aviation sustains procurement through carrier decks and amphibious assault ships, with F-35B/C jets ensuring fleet defense. Army Aviation’s fixed-wing slice includes ISR, medevac, and light transport roles. These dynamics help distribute demand across military fixed-wing aircraft market participants and shield suppliers from over-reliance on single service pipelines.
By Propulsion Type: Turbofan Dominance with Emerging Electric Potential
Turbofan engines powered 64.55% of the military fixed-wing aircraft market size in 2025, prized for thrust-to-weight ratios that enable supersonic dash and sustained high-subsonic cruise. With only a 0.9% revenue share now, hybrid and fully electric systems are forecasted for a 4.62% CAGR through 2031 as militaries pilot zero-emissions concepts for trainers and light transports.
The F135 engine yields 43,000 pounds of thrust with stealth-compatible design parameters, securing its primacy. Turboprops at 34.79% maintain relevance in rough-field logistics and basic training regimes due to lower operating costs. Environmental mandates from the US Environmental Protection Agency on noise and emissions propel R&D in sustainable fuels and electric-motor architectures, ensuring future diversification inside the military fixed-wing aircraft market.
Geography Analysis
North America retained 51.10% of the military fixed-wing aircraft market share in 2025, thanks to the US Department of Defense's (DoD's) USD 842 billion budget and ongoing F-35, B-21, and KC-46 procurements. Canada's Future Fighter Capability Project and Mexico's surveillance-aircraft upgrades provide incremental regional volume. Together, these drivers push the region toward a projected 3.92% CAGR between 2026 and 2031, against a prior 2.75% pace.
Asia-Pacific is the fastest-expanding arena with a 6.12% CAGR to 2031. Japan's multi-layer fighter roadmap, South Korea's USD 8.8 billion KF-21 development, and Australia's integrated air-defense enhancements crowd the procurement pipeline. The broader theater's strategic calculus, framed by China's modernization, propels allied partners to favor Western designs that assure interoperability, reinforcing top-line momentum for the military fixed-wing aircraft market.
Europe accounts for roughly 20% of current spending and will stay buoyant as NATO states pursue 2%-of-GDP targets. Germany's F-35A buy, Poland's multi-type recapitalization, and the Franco-German-Spanish Future Combat Air System (FCAS) seed long-run demand. The Middle East and Africa add lumpy but sizable projects, typified by Saudi and UAE fighter competitions. Latin American growth is steadier, centered on trainer replacements and light attack aircraft. These regional patterns diversify revenue pools inside the military fixed-wing aircraft market, mitigating cyclical risk tied to any one theater.

Competitive Landscape
The market is moderately consolidated, with five lead contractors, Lockheed Martin, Boeing, Airbus, Northrop Grumman, and BAE Systems, accounting for the majority of revenue, conferring moderate concentration in the military fixed-wing aircraft industry. Competition remains acute for headline fighter opportunities, where the F-35 faces the Eurofighter Typhoon, Dassault Rafale, and Saab Gripen in multi-billion-dollar tenders.
Strategic teaming is central. The F-35 industrial network spans 18 partner states and spreads workshare across over 1,500 suppliers, diffusing political and supply chain risk. Europe’s Future Combat Air System adopts a tri-national development model, while US primes integrate Silicon Valley software houses to accelerate MOSA upgrades. Emerging entrants Korea Aerospace Industries, Turkish Aerospace Industries, and India’s Hindustan Aeronautics leverage government-backed programs to carve export slots, raising competitive stakes inside the military fixed-wing aircraft market.
Innovation hotspots cluster around autonomous teaming, electric propulsion, and advanced materials. Boeing’s MQ-28A Ghost Bat and Northrop Grumman’s B-21 Raider reveal how legacy firms translate stealth and autonomy know-how into new franchise programs. Airbus partners with Rolls-Royce on hydrogen-ready engine demonstrators, anticipating future environmental regulations. Sustained R&D intensity, protected by long-cycle contracts, underpins durable barriers to entry across the military fixed-wing aircraft market.
Military Fixed Wing Aircraft Industry Leaders
Airbus SE
Lockheed Martin Corporation
The Boeing Company
Northrop Grumman Corporation
Leonardo S.p.A.
- *Disclaimer: Major Players sorted in no particular order

Recent Industry Developments
- October 2025: The Swedish Defence Materiel Administration granted Saab AB a procurement contract to conduct conceptual studies on future fighter systems. The agreement covers research initiatives from 2025 to 2027 and is valued at SEK 2.6 billion (USD 274 million).
- October 2025: Hindustan Aeronautics Limited achieved a significant milestone with its Nashik facility's inaugural flight of the Tejas Mk1A fighter jet. The company manufactured and tested ten Mk1A jets; however, the formal delivery to the Indian Air Force remains contingent upon the successful completion of final flight trials and weapon integration procedures.
- March 2025: The US Pentagon awarded Boeing the contract to develop the Next Generation Air Dominance (NGAD) fighter aircraft. This sixth-generation fighter, designated F-47, will replace the existing F-22 Raptor in the US Air Force's advanced combat aircraft fleet.


Global Military Fixed Wing Aircraft Market Report Scope
| Multi-role Aircraft |
| Training Aircraft |
| Transport Aircraft |
| Other Aircraft |
| Air Force |
| Army Aviation |
| Naval/Marine Corps Aviation |
| Joint/Special Operations |
| Paramilitary and Coast Guard |
| Turbojet |
| Turboprop |
| Fully Electric/Hybrid-Electric |
| North America | United States | |
| Canada | ||
| Mexico | ||
| Europe | United Kingdom | |
| France | ||
| Germany | ||
| Spain | ||
| Italy | ||
| Russia | ||
| Rest of Europe | ||
| Asia-Pacific | China | |
| India | ||
| Japan | ||
| South Korea | ||
| Indonesia | ||
| Australia | ||
| Rest of Asia-Pacific | ||
| South America | Brazil | |
| Rest of South America | ||
| Middle East and Africa | Middle East | Saudi Arabia |
| United Arab Emirates | ||
| Qatar | ||
| Rest of Middle East | ||
| Africa | South Africa | |
| Nigeria | ||
| Rest of Africa | ||
| By Aircraft Type | Multi-role Aircraft | ||
| Training Aircraft | |||
| Transport Aircraft | |||
| Other Aircraft | |||
| By End-User Service | Air Force | ||
| Army Aviation | |||
| Naval/Marine Corps Aviation | |||
| Joint/Special Operations | |||
| Paramilitary and Coast Guard | |||
| By Propulsion Type | Turbojet | ||
| Turboprop | |||
| Fully Electric/Hybrid-Electric | |||
| By Geography | North America | United States | |
| Canada | |||
| Mexico | |||
| Europe | United Kingdom | ||
| France | |||
| Germany | |||
| Spain | |||
| Italy | |||
| Russia | |||
| Rest of Europe | |||
| Asia-Pacific | China | ||
| India | |||
| Japan | |||
| South Korea | |||
| Indonesia | |||
| Australia | |||
| Rest of Asia-Pacific | |||
| South America | Brazil | ||
| Rest of South America | |||
| Middle East and Africa | Middle East | Saudi Arabia | |
| United Arab Emirates | |||
| Qatar | |||
| Rest of Middle East | |||
| Africa | South Africa | ||
| Nigeria | |||
| Rest of Africa | |||


Market Definition
- Aircraft Type - All the military aircraft which are used for various applications are included in this study.
- Sub-Aircraft Type - For this study, all the military fixed-wing aircraft based on their application are considered.
- Body Type - Multi-Role Aircraft, Transport, Training Aircraft, Bombers, Reconnaissance Aircraft, and various other aircraft are considered in this study.
| Keyword | Definition |
|---|---|
| IATA | IATA stands for the International Air Transport Association, a trade organization composed of airlines around the world that has an influence over the commercial aspects of flight. |
| ICAO | ICAO stands for International Civil Aviation Organization, a specialized agency of the United Nations that supports aviation and navigation around the globe. |
| Air Operator Certificate (AOC) | A certificate granted by a National Aviation Authority permitting the conduct of commercial flying activities. |
| Certificate Of Airworthiness (CoA) | A Certificate Of Airworthiness (CoA) is issued for an aircraft by the civil aviation authority in the state in which the aircraft is registered. |
| Gross Domestic Product (GDP) | Gross domestic product (GDP) is a monetary measure of the market value of all the final goods and services produced in a specific time period by countries. |
| RPK (Revenue Passenger Kilometres) | The RPK of an airline is the sum of the products obtained by multiplying the number of revenue passengers carried on each flight stage by the stage distance - it is the total number of kilometers traveled by all revenue passengers. |
| Load Factor | The load factor is a metric used in the airline industry that measures the percentage of available seating capacity that has been filled with passengers. |
| Original Equipment Manufacturer (OEM) | An original equipment manufacturer (OEM) traditionally is defined as a company whose goods are used as components in the products of another company, which then sells the finished item to users. |
| International Transportation Safety Association (ITSA) | International Transportation Safety Association (ITSA) is an international network of heads of independent safety investigation authorities (SIA). |
| Available Seats Kilometre (ASK) | This metric is calculated by multiplying Available Seats (AS) in one flight, defined above, multiplied by the distance flown. |
| Gross Weight | The fully-loaded weight of an aircraft, also known as “takeoff weight,” which includes the combined weight of passengers, cargo, and fuel. |
| Airworthiness | The ability of an aircraft, or other airborne equipment or system, to operate in flight and on the ground without significant hazard to aircrew, ground crew, passengers or to other third parties. |
| Airworthiness Standards | Detailed and comprehensive design and safety criteria applicable to the category of aeronautical product (aircraft, engine or propeller). |
| Fixed Base Operator (FBO) | A business or organization that operates at an airport. An FBO provides aircraft operating services like maintenance, fueling, flight training, charter services, hangaring, and parking. |
| High Net worth Individuals (HNWIs) | High Net worth Individuals (HNWIs) are individuals with over USD 1 million in liquid financial assets. |
| Ultra High Net worth Individuals (UHNWIs) | Ultra High Net worth Individuals (UHNWIs) are individuals with over USD 30 million in liquid financial assets. |
| Federal Aviation Administration (FAA) | The division of the Department of Transportation is concerned with aviation. It operates Air Traffic Control and regulates everything from aircraft manufacturing to pilot training to airport operations in the United States. |
| EASA (European Aviation Safety Agency) | The European Aviation Safety Agency is a European Union agency established in 2002 with the task of overseeing civil aviation safety and regulation. |
| Airborne Warning and Control System (AW&C) aircraft | Airborne Warning and Control System (AEW&C) aircraft is equipped with a powerful radar and on-board command and control center to direct the armed forces. |
| The North Atlantic Treaty Organization (NATO) | The North Atlantic Treaty Organization (NATO), also called the North Atlantic Alliance, is an intergovernmental military alliance between 30 member states – 28 European and two North American. |
| Joint Strike Fighter (JSF) | Joint Strike Fighter (JSF) is a development and acquisition program intended to replace a wide range of existing fighter, strike, and ground attack aircraft for the United States, the United Kingdom, Italy, Canada, Australia, the Netherlands, Denmark, Norway, and formerly Turkey. |
| Light Combat Aircraft (LCA) | A light combat aircraft (LCA) is a light, multirole jet/turboprop military aircraft, commonly derived from advanced trainer designs, designed for engaging in light combat. |
| Stockholm International Peace Research Institute (SIPRI) | Stockholm International Peace Research Institute (SIPRI) is an international institute that provides data, analysis, and recommendations for armed conflict, military expenditure, and arms trade as well as disarmament and arms control. |
| Maritime Patrol Aircraft (MPA) | A maritime patrol aircraft (MPA), also known as maritime reconnaissance aircraft is a fixed-wing aircraft designed to operate for long durations over water in maritime patrol roles, in particular, anti-submarine warfare (ASW), anti-ship warfare (AShW), and search and rescue (SAR). |
| Mach Number | The Mach number is defined as the ratio of true airspeed to the speed of sound at the altitude of a given aircraft. |
| Stealth Aircraft | Stealth is a Common term applied to low observable (LO) technology and doctrine, that makes an aircraft near invisible to radar, infrared or visual detection. |


Research Methodology
Mordor Intelligence follows a four-step methodology in all our reports.
- Step-1: Identify Key Variables: In order to build a robust forecasting methodology, the variables and factors identified in Step-1 are tested against available historical market numbers. Through an iterative process, the variables required for market forecast are set and the model is built on the basis of these variables.
- Step-2: Build a Market Model: Market-size estimations for the historical and forecast years have been provided in revenue and volume terms. For sales conversion to volume, the average selling price (ASP) is kept constant throughout the forecast period for each country, and inflation is not a part of the pricing.
- Step-3: Validate and Finalize: In this important step, all market numbers, variables and analyst calls are validated through an extensive network of primary research experts from the market studied. The respondents are selected across levels and functions to generate a holistic picture of the market studied.
- Step-4: Research Outputs: Syndicated Reports, Custom Consulting Assignments, Databases & Subscription Platforms


